325
Optimizing land use for the delivery of
catchment ecosystem services
Donnacha G Doody1*†, Paul JA Withers2†, Rachael M Dils3, Richard W McDowell4, Val Smith5,
Yvonne R McElarney1, Mike Dunbar3, and Donal Daly6
Despite widespread implementation of best management practices, sustainable farming is neither practical nor possible in certain locations, where protecting water quality and promoting agricultural production are likely to be incompatible. Some strategic prioritization of land- use options and acceptance of continually degraded waterbodies may be required to ensure optimization of multiple ecosystem services in catchments (also known as watersheds or drainage basins). We examine approaches to prioritization and propose catch-ment buffering capacity as a concept to manage the pressure–impact relationship between land use and aquatic ecosystems. Catchment buffering capacity can be considered as a continuum of biogeochemical, hydrological, and ecological catchment properties that define this relationship. Here, we outline a concep-tual framework to assist prioritization: (1) establish a water- quality target, (2) quantify the gap in compliance to achieve the desired target, (3) assess catchment sensitivity to change, and (4) determine the adaptive capacity of catchment communities to reach the target.
Front Ecol Environ 2016; 14(6): 325–332, doi: 10.1002/fee.1296
A
cross the globe, over the past century, the intensifi-cation of agriculture has resulted in the degradation of natural ecosystems. There has been no greater demon-stration of this impact than on aquatic ecosystems – with extensive land clearance, artificial drainage, nutrient inputs, pesticide use, and tillage practices all contributing to a deterioration in water quality and biodiversity (Moss 2008; Smith and Schindler 2009; Dodds et al. 2013). In the past 40 years, a plethora of voluntary, incentivized, and regulatory controls have been introduced to help curb and reverse the impact of modern agriculture on water quality (OECD 2012). Realizing this desired outcome has been complicated by uncertainties over eco-logical recovery trajectories, the continued impact of historical land- use practices, the difficulties of generating
evidence unequivocally linking cause and effect, and the reluctance to jeopardize productivity with overly restric-tive regulation of agricultural practices (Allan 2004; McGonigle et al. 2012; Page et al. 2012).
As the complexity of the effects of agricultural land use on water quality and aquatic ecology is better recognized (Burcher et al. 2007), the global human population con-tinues to rise unabated. The Food and Agriculture Organization of the United Nations (FAO) estimated that if current patterns of food consumption persist, 60% more food will need to be produced worldwide by 2050, as compared with that produced from 2005–2007 (FAO 2009). In response, future growth targets for agriculture in many countries will inevitably place further regional pressure on waterbodies unless agricultural intensification can be achieved sustainably (Pretty 2008; Garnett et al. 2013). However, our ability to predict where the dual objectives of agricultural intensification and preservation of water quality are achievable is still limited (Moss 2008), although operational frameworks for linking land-scape features and functionality with water- quality protection have been proposed (eg Gascuel- Odoux et al. 2009).
The desire to protect water quality and deliver agricultural growth may be unattainable in many catchments (also termed watersheds or drainage basins). In areas with challenging climate, topography, soil types, and/or extensive subsurface drainage, it may not be possible to achieve sus-tainable intensification (Doody et al. 2012). In some areas in England, substantial areas of land would need to come out of intensive agricultural production to meet nitrate standards in drinking water, as defined by the European Nitrates Directive. In freshwater habitats, phosphorus standards set under the EU Water Framework Directive (WFD) can be 1Agri-Food and Biosciences Institute, Belfast, UK *(donnacha.doody@
afbini.gov.uk); 2Bangor University, Bangor, UK; 3Environment
Agency, Wallingford, UK; 4AgResearch, Invermay Agricultural
Centre, Mosgiel, New Zealand; 5University of Kansas, Lawrence,
KS; 6Environmental Protection Agency, Dublin, Ireland; †these
authors contributed equally to this work
In a nutshell:
• Productive agriculture and protection of water quality are incompatible in many catchments
• Prioritization of catchment land use is therefore required to optimize the delivery of multiple ecosystem services • Catchment buffering capacity provides a basis for managing
the pressure–impact relationship between land use and aquatic ecosystems
326
exceeded even when best management practices (BMPs) are implemented (Withers et al. 2014). Some strategic prioriti-zation of land use and acceptance of degraded waterbodies may therefore be necessary to ensure the sustainability and optimization of a range of anthropogenic activities, includ-ing agriculture (Doody et al. 2014). Currently in the European Union (EU), this principle is not acceptable since one of the main objectives of the WFD is to prevent deteri-oration in the status of aquatic ecosystems. Prioritization requires an understanding of waterbody sensitivity to anthro-pogenic pressure (ie the pressure–impact relationship) from sustainable intensification.
The difficulty in balancing ecosystem services in all catchments suggests that a pragmatic approach is needed to prioritize catchments based on their ability to deliver aquatic and/or agricultural ecosystem services (Doody et al. 2014; Jarvie and Jenkins 2014). We examine approaches to prioritization and consider how the concept of catchment buffering capacity could be utilized to achieve this in the context of nutrient use in agriculture. We use the example of phosphorus (P) to develop a framework to facilitate the determination of where sustainable intensification is most likely to be achieved.
JCatchment prioritization
For many years, catchments have been prioritized to improve water quality, so as to ensure the best use of limited resources (human and financial) and to optimize the cost effectiveness of interventions (eg Barataud et al. 2014). To date, most of these efforts have focused on
impact- based prioritization, where resources are targeted to agricultural areas predicted by modeling assessments to have the greatest impact on water quality (eg Heathwaite et al. 2005). For instance, catchments in England have been prioritized for nonpoint source mit-igation under the EU WFD, where evidence indicates that nutrient pollution from farming contributes to failure in achieving “good” or “high ecological status” (Environment Agency 2014a). However, despite the widespread implementation of impact- based prioritization of catchments, demonstrating success has been chal-lenging (Doody et al. 2012; Page et al. 2012), as evidenced by the case of Ireland’s Lough Melvin catchment. The catchment is characterized by low- intensity farming; nevertheless, a substantial decline in water quality was not averted by mitigation efforts due to limited knowl-edge regarding farming practices, catchment hydrology, and lake sensitivity (Doody et al. 2012).
More recently, there has been a shift (Figure 1) toward outcome- based prioritization, where catchments are selected for intervention based on the probability of achieving positive chemical or ecological outcomes. In New Zealand, legislation has created a framework to prior-itize catchment actions partly based on community- accepted outcomes for water quality. The National Policy Statement on Freshwater Management (MFE 2014) sets national values for “ecosystem health” and “human health for recreation”, but the inclusion of other “optional” values – such as fishing, irrigation, and food production – allows local catchment stakeholders to prioritize catch-ment outcomes based on community values and therefore the provision of valued ecosystem services.
Full progression toward catchment prioritization based on multiple ecosystem services (Figure 1) is currently con-strained by the difficulty of linking land- use activities to their effects on waterbodies (Moss 2008), resolving con-flicts between achieving different types of services, and uncertainties over the beneficiaries and governance of these services (Bennett et al. 2015). Despite equally impor-tant legal, ethical, and social issues surrounding the prioritization of catchments, accurate assessment of the economic trade- offs required to deliver ecosystem services will be a key driver in determining the balance between future agricultural and environmental targets in catch-ments (Dodds et al. 2013). Withers et al. (2014) noted unsustainable runoff P concentrations at two UK sites that contained agronomic optimum soil P levels and that were farmed according to soil fertility BMPs. In such cases, a lower critical threshold for soil P – which would poten-tially compromise agronomic production – may be required to protect water quality. Progress in resolving these trade- offs and managing the pressure–impact relationships that exist between catchment ecosystem services is vital in order to identify locations in catchments where sustainable intensification can be achieved. This requires a flexible conceptual framework that can account for catchment sensitivity to multiple anthropogenic pressures.
Figure 1. Transformation framework representing the change in
327
JCatchment buffering capacity
One well- established concept that applies to all natural systems is buffering capacity – the ability of a system to resist change in response to an external stimulus. Buffering capacity has been used in the context of soils, waterbodies, and catchments to evaluate soil nu-trient availability, hydrologic residence times, regime shifts in aquatic ecosystems, and acidification (Leibowitz et al. 2000; Schippers et al. 2006; Fraterrigo and Downing 2008; Nair 2014). In each case, a system that is well buffered will be less sensitive to disturbance and will be better able to absorb the impact of a stressor for longer as compared with a poorly buffered system. The buffering capacity of a system will eventually reach a threshold (saturation) level, defined here as the point at which small changes in the inputs to a catchment cause a rapid change in the aquatic ecosystem (Figure 2). In his seminal review, Allan (2004) found studies sug-gesting that river ecology would not be adversely af-fected until agriculture occupied a percentage – ranging from 30% to 80% – of the catchment area. Also, Barry and Foy (2016) demonstrated a substantial var-iation in the relationship between river soluble reactive phosphorus (SRP) concentrations and agricultural in-tensity in headwater catchments in Northern Ireland (Figure 3a). We hypothesize that the variability in catchment P response described by Barry and Foy (2016) and Allan (2004) results from variations in catchment buffering capacity arising from differences in the phys-ical, chemphys-ical, and biological properties that influence the equilibrium between a catchment system and its surrounding environment. Two catchments with the same agricultural intensity may therefore have different outcomes in terms of impacts on aquatic ecosystems (Figures 3 and 5). In this way, catchment sensitivity to sustainable intensification pressure may be mediated through catchment buffering capacity.
Here we examine the concept of catchment buffering capacity as an approach to managing the pressure–impact relationship between agricultural P, aquatic ecosystems, and multiple ecosystem services. Catchment buffering capacity can be conceptualized as a continuum of biogeo-chemical, hydrological, and ecological catchment proper-ties that control the pressure–impact relationship between land use and aquatic ecosystems (Figure 3a and b). McDowell et al. (2003) observed that soils and sedi-ments will buffer changes in soil P concentrations and release to runoff depending on mineral composition, organic matter content, and redox condition (Figure 4). Landscapes buffer the delivery of P to receiving waters according to the residence time of hydrological pathways, which varies from minutes to years depending on proper-ties such as geology and soil structure (eg Fraterrigo and Downing 2008). Uptake as aboveground biomass (eg in wetlands and riparian areas) plays an important role in landscape buffering (Hattermann et al. 2006). In addition,
changes in biodiversity are buffered through complex food web interactions and recolonization routes that influence community- level resistance to impacts from external stressors (Figure 5; Groffman et al. 2006; Dodds et al. 2010). All three buffer components are intrinsically linked in both space and time, and are characterized by their geochemical (eg soil P, lake sediments), hydrologi-cal (eg soil water, groundwater), and biomass- related (eg crops, macrophytes, soil microbes) storage capacity (Table 1). We hypothesize that a catchment has a unique buffering capacity signal and that the identification of a threshold point, above which a catchment is poorly buff-ered, is vital in determining how far agriculture can be intensified in a specific catchment without unduly affect-ing aquatic ecosystems (Figure 2). For example, in New Zealand catchments, deer farming has a higher P export than dairy farming due to the former’s association with catchments with a lower buffering capacity (Figure 3b; Coop 1965; McDowell and Wilcock 2008).
Despite being a function of the natural landscape (eg soils, geology, hydrology, and stream order), a catch-ment’s innate buffering capacity will be altered over time by anthropogenic activities/impacts such as riparian man-agement, drainage, legacy nutrient effects, and dredging (Table 1). Where catchment buffering capacity is low, sustainable intensification will be more challenging unless technology, innovation, or scientific solutions can facilitate stakeholder’s adaption and increase catchment buffering capacity. We therefore envisage that assessing three aspects – namely, potential landscape buffering
Figure 2. Conceptual framework for the capacity of a catchment
328
capacity, how this buffering capacity might be improved (through innovative technologies and engineering), and social engagement to enact necessary change – will be key elements of sustainable watershed management in the future.
JA framework for prioritization
We have proposed buffering capacity as a central con-cept for the prioritization of catchment ecosystem
services, such as between agricultural production and water quality. However, this concept needs to be em-bedded in a framework through which prioritization can be implemented in practice. In this context, we identify four steps:
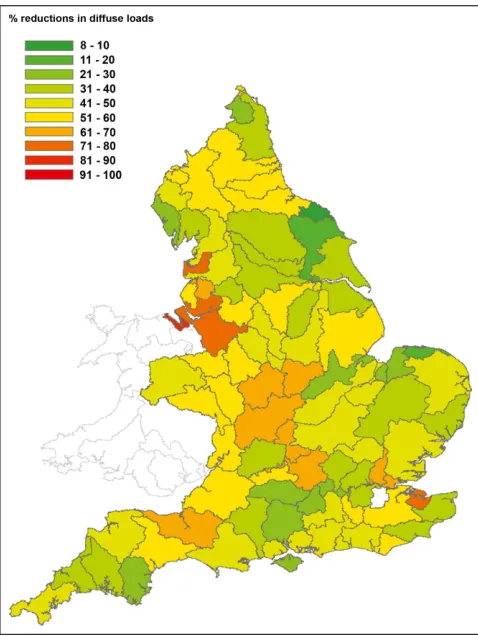
(1) Establish a catchment water-quality target. The identification of this target is based on social, eco-nomic, and political constructs that define societal goals for a waterbody including – among other things – total maximum daily load, ecological ref-erence conditions, or baseline contaminate concen-trations. The European approach has been to set targets based on reference conditions, which are defined for the purposes of the WFD as “the con-ditions that prevail in the absence or near absence of human disturbance” (Bouleau and Pont 2015); (2) Quantify the gap between the current and target
water quality or ecological condition, and the reductions required from agriculture to close this gap. This will vary on a catchment-specific basis; however, initial results suggest that, on average, agricultural phosphate loads need to be reduced by up to 43% across England to meet WFD stand-ards (Figure 6) (Environment Agency 2014b); (3) Identify how well buffered the catchment is and
whether the threshold point has been exceeded. If the catchment is poorly buffered, it will be more difficult to achieve a target (Figure 2). Understanding the biogeochemical, hydrological, or ecological cause of poor buffering capacity is important so as to inform the targeting of intervention strategies. Doody
Figure 4. Impact of Olsen P concentration (ie bicarbonate-
extractable inorganic soil P) on SRP concentration in runoff from three New Zealand soils. The sites differ in their buffering gradients and the threshold point at which SRP concentration in runoff increases sharply. This is due to variation in soil sorption capacity from low (Oporo), to medium (Waikoikoi), to high (Fleming). Adapted from McDowell et al. (2003).
Figure 3. Variation in catchment sensitivity to agricultural
pressures as demonstrated by (a) impact of stocking rate (expressed in dairy cow equivalence per hectare; ie where all grazing livestock are theoretically converted to dairy cows) on flow- weighted mean soluble reactive phosphorus (SRP) concentration in the rivers draining the sub- catchments of the Colebrooke and Upper Bann rivers and Lough Neagh in Northern Ireland (McElarney et al. 2015; Barry and Foy 2016) and by (b) annual P loss from a New Zealand catchment dominated by dairy, deer, or mixed (sheep and beef) farming systems (Coop 1965; McDowell and Wilcock 2008). The variation in the relationships expressed in both graphs demonstrates how catchments vary in their abilities to buffer inputs/pressures from agriculture as a function of catchment characteristics.
(a)
329
et al. (2012) demonstrated that rapid runoff in impermeable catchments can lead to large P exports, despite low soil P concentrations;
(4) Assess the ability of catchment communities to make the necessary adaptations to achieve the water-quality target. Adaptive capacity is defined as the precondition that enables adaption to change, including the financial, human, social, natural, and physical capitals that facilitate change (Brown et al. 2010; Lockwood et al. 2015). The adaptive capacity of communities will be affected by their ability to be innovative in implementing mitigation strategies and developing technology.
JDiscussion
We have proposed catchment buffering capacity as a central concept for managing catchment sensitivity to sustainable intensification and for prioritizing land- use management for the provision of multiple ecosystem services. New methodologies are now needed to deter-mine catchment buffering capacity and threshold points, and to link these to remediation targets and adaptive capacity. To date, setting targets for improving water quality and for addressing regime shifts in aquatic eco-systems have received more attention (eg Scheffer et al. 2001; Dodds et al. 2010). Identifying changes in catch-ment buffering capacity and proximity to a threshold may be more easily achieved through the use of long- term historical datasets that span the transition from pristine to impacted states, although the availability of such datasets is very limited (Swetnam et al. 1999). Alternatively, by relying on a range of data- rich catch-ments with shared characteristics, practitioners could determine comprehensive pressure–impact relationships
for particular stressors or ecoregions, similar to identi-fying reference conditions used for setting targets to control eutrophication (McDowell et al. 2013).
In the context of P, current understanding suggests that natural buffering capacity will be elevated in catchments with highly productive, deep, P- retentive soils; a high base- flow index (ie substantial contribution of groundwa-ter to river flows) and low specific runoff (ie low runoff discharge per unit area of the catchment); and a diverse in- stream ecological community. However, anthropo-genic impacts such as enriched soil P concentrations (legacy soil P), artificial field drainage, and in- channel dredging will substantially reduce catchment P buffering
Figure 5. Variation in the sensitivity of aquatic organisms to
agricultural intensity (expressed in dairy cow equivalence per hectare) in 42 sub- catchments of the Colebrook and Upper Bann rivers in Northern Ireland (Foy and Kirk 1995).
Table 1. Indicator and anthropogenic impacts of phosphorus (P) buffering capacity of catchments
Catchment component Indicator(s) of phosphorus buffering capacity Factors affecting phosphorus buffering capacity
Geochemical storage capacity • Adsorption capacity (eg Qmax*)
• Parent material • Soil pH
• Soil organic matter • Erosion vulnerability
• Legacy soil P
• Manure and fertilizer applications • Liming
• Tillage
• Legacy sediment P
Hydrological storage capacity • Residence time
• Q5/Q95 discharge • Effective rainfall
• Drainage class (eg HOST) • Hydrological connectivity • Bedrock storage • Specific runoff
• Distance to main river channel
• Artificial field drainage • Soil compaction • Wetland destruction • Removal of riparian zones • Loss of floodplains • Groundwater abstractions • Impoundment
Biomass storage and ecosystem resistance
(or resilience) • Gross primary production• Stream order
• Trophic status • Ecological connectivity
• Agricultural productivity • River alterations • Dredging
330
capacity (Table 1; Blann et al. 2009; Sharpley et al. 2013). The anthropogenic factors that lower catchment buffering capacity will also affect farmers’ adaptive capac-ity. Rowe et al. (2015) highlighted that utilizing legacy soil P may require lower agricultural P inputs to reduce the risk posed to water quality. On the other hand, this could compromise agricultural output, especially on housed (ie livestock kept indoors) or partially housed livestock farms, where it is currently uneconomical to transport manure away from farms to distant crop- producing areas. Such a scenario may limit livestock farmers’ adaptive capacity, while in other catchments, agricultural impacts may be due to contemporary management practices (eg poor fertilizer and manure management) that farmers can address more readily. In the future, engineering technologies may facilitate the development of new management practices to improve catchment buffering capacity – for example, by redesign-ing artificial drainage systems and ditch management so as to increase the retention of contaminates during trans-port (eg Kröger et al. 2013). In this way, a focus on catchment buffering capacity could encourage the creation of additional mitigation measures for eutrophi-cation control and functional land management.
Agricultural codes of basic good practice (CoPs) to control farm- based nutrient pollution have been inte-grated in cross- compliance rules (ie necessitating that farmers adhere to a set of statutory requirements and BMPs in order to qualify for full subsidy payments) under the Common Agricultural Policy in the EU, the Farm Bill in the US, and in the National Policy Statement on Freshwater Management policy in New Zealand (McDowell et al. 2016). However, there is a need to further develop agricultural CoPs that account for catchment heterogeneity to maximize ecosystem service provision and enable the implementation of catchment- specific BMPs to control diffuse pollution from agricul-ture. Schulte et al. (2014) proposed that an assessment of the functionality of soil resources in catchments would help inform the prioritization of multiple ecosystem services. Adaptive capacity will be a key determinant of the cost- effectiveness of catchment BMPs. In regions with a strong rural economy (eg based on forestry, tour-ism, or construction), farmers will have more options for off- farm work and/or may also receive incentive payments that help to alleviate any decline in farm profitability resulting from the impact of increased environmental compliance. In addition, farmers require proper educa-tional and extension services to respond to the chal-lenges of sustainable intensification (Buckwell and Armstrong- Brown 2004), with adaption to precision nutrient management unlikely if farmers do not have adequate access to extension services with trained per-sonnel (Davidson et al. 2015).
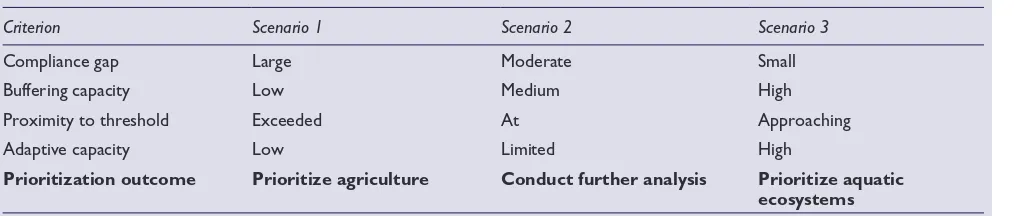
The prioritization framework outlined here provides a range of outputs – including scenarios 1, 2, and 3 pre-sented in Table 2 – informing the limits of agricultural intensification in individual catchments. The decision to prioritize agriculture and aquatic ecosystems in scenarios 1 and 3, respectively, may be relatively straightforward. For scenario 2, decision makers would have to determine whether (1) the investment required to train farmers and extension services is worthwhile in order to allow agricul-ture to intensify sustainably and (2) additional assessment is necessary, including establishing nutrient level targets (percent reductions in current nutrient levels) for agricul-tural operations within a given catchment. Such targets would relate to the current buffering capacity of the catch-ment, with mitigation strategies optimized within the catchment based on cost- effectiveness. Additional mode-ling could then be used to estimate the response (eg time lag) of a catchment and the uncertainty in the estimate produced (Howden et al. 2011). The ability of and time required for a catchment to meet a target would be esti-mated and balanced against the uncertainty associated with achieving the target and the investment necessary to maintain existing infrastructure and economically sustain-able agriculture. If the target is not achievsustain-able (or after consultation with catchment stakeholders, the uncer-tainty is considered too great), then this is a signal for revision of the water- quality target, identified in step 1 of
Figure 6. Percent reductions in agricultural P loads required for
331
the prioritization framework or, alternatively, for whole-sale land- use changes within the catchment.
Although the implementation of a prioritization approach may diverge from contemporary national policy and regulation in many countries, the current water- quality policies in Europe, New Zealand, and the US already provide mechanisms through which a limited prioritization approach could be implemented (McDowell et al. 2016). In each case, alternative targets can be set based on natural landscape conditions and technical infeasibility due to factors such as infrastructure (eg Bouleau and Pont 2015). With regard to the EU WFD and US Clean Water Act, the social and economic impacts of achieving a designated target can also be con-sidered through Article 4.5 and Use Attainability Analysis, respectively. In both cases, alternative water- quality objectives can be set if the cost of achieving a desired target is deemed unduly expensive or if a human activity supported by a waterbody is considered essential to society.
JConclusions
Our arguments for prioritization are not intended to advocate for the acceptance of unabated nutrient pol-lution in catchments prioritized for agriculture. Instead we argue that less stringent application and enforcement of environmental regulations, focused on targets of “continual improvement” or “stabilization” in water quality, should be applied in catchments where agri-cultural production is prioritized, or where production is not adversely affecting ecological status. Stricter reg-ulations will be required, on a targeted risk- based approach, where the probability of aquatic ecosystem recovery is highest. A minimum standard of agricultural BMPs should be applied in all catchments to provide a basic level of environmental protection. Thereafter, an adaptive system of policy intervention could be im-plemented, including guidance, voluntary approaches, economic incentives, and new regulations. The concep-tual framework outlined here places catchment buffering capacity at the center of the prioritization approach. Further research is required to develop this concept for various catchment typologies across ecoregions and for
multiple stressors. Phosphorus is just one of multiple stressors affecting aquatic ecosystems – with each catch-ment having a unique group of stressors that are a function of its multifaceted, heterogeneous nature, and anthropogenic activities that dominate its land use to varying degrees. Disentangling the effects of these mul-tiple stressors at the catchment scale remains difficult, but is a vital step toward prioritizing catchments. Though examined here in the context of agricultural P, the buffering capacity concept should be evaluated to assess its applicability to non- chemical stressors such as sed-iments and hydromorphology.
JAcknowledgements
Any views expressed here are those of the authors, and do not necessarily reflect those of the organiza-tions with which they are affiliated. We acknowledge the support of the Phosphorus Research Coordination Network run by Arizona State University, where discussions on this paper occurred. This paper is dedicated to the memory of our colleague Val Smith, who sadly passed away just as this paper was being published.
JReferences
Allan JD. 2004. Landscapes and riverscapes: the influence of land use on stream ecosystems. Annu Rev Ecol Evol S 35: 257–84. Barataud F, Durpoix A, and Mignolet C. 2014. Broad analysis of
French priority catchment areas: a step toward adaption of the Water Framework Directive? Land Use Policy 36: 427–40. Barry C and Foy R. 2016. Assessing the success of regional
meas-ures for lowering agricultural nutrient pollution in headwater streams. J Environ Qual; doi:10.2134/jeq2015.04.0184.
Bennett EM, Cramer W, Begossi A, et al. 2015. Linking biodiver-sity, ecosystem services, and human well- being: three challenges for designing research for sustainability. Curr Opin Environ Sustain 14: 76–85.
Blann KL, Anderson JL, Sands GR, and Vondracek B. 2009. Effects of agricultural drainage on aquatic ecosystems: a review.
Crit Rev Env Sci Tec 39: 909–1001.
Bouleau G and Pont D. 2015. Did you say reference conditions? Ecological and socio- economic perspectives on the European Water Framework Directive. Environ Sci Policy 47: 32–41. Brown PR, Nelson R, Jacobs B, et al. 2010. Enabling natural
resource managers to self- assess their adaptive capacity. Agr Syst 103: 562–68.
Table 2. Example scenarios arising from the catchment prioritization process*
Criterion Scenario 1 Scenario 2 Scenario 3
Compliance gap Large Moderate Small
Buffering capacity Low Medium High
Proximity to threshold Exceeded At Approaching
Adaptive capacity Low Limited High
Prioritization outcome Prioritize agriculture Conduct further analysis Prioritize aquatic ecosystems
332 Buckwell A and Armstrong-Brown S. 2004. Changes in farming and future prospects – technology and policy 1. Ibis 146: 14–21.
Burcher CL, Valett HM, and Benfield EF. 2007. The land cover cas-cade: relationships coupling land and water. Ecology 88: 228–42. Coop IE. 1965. A review of the ewe equivalent system. New
Zealand Agr Sci 1: 13–18.
Davidson EA, Suddick EC, Rice CW, and Prokopy LS. 2015. More food, low pollution (Mo Fo Lo Po): a grand challenge for the 21st century. J Environ Qual 44: 305–11.
Dodds WK, Clements WH, Gido K, et al. 2010. Thresholds, break-points, and nonlinearity in freshwaters as related to manage-ment. J N Am Benthol Soc 29: 988–97.
Dodds WK, Perkin JS, and Gerken JE. 2013. Human impact on freshwater ecosystem services: a global perspective. Environ Sci Technol 47: 9061–68.
Doody DG, Foy RH, and Barry CD. 2012. Accounting for the role of uncertainty in declining water quality in an extensively farmed grassland catchment. Environ Sci Policy 24: 15–23. Doody DG, Withers PJA, and Dils RM. 2014. Prioritizing
water-bodies to balance agricultural production and environmental outcomes. Environ Sci Technol 48: 7697–99.
Environment Agency. 2014a. Catchment Sensitive Farming Eva-luation Report – Phases 1 to 3 (2006–2014). http://publications. naturalengland.org.uk/category/6919090. Viewed 18 May 2016. Environment Agency. 2014b. Progressing towards WFD objectives
– the role of agriculture. London, UK: Environment Agency. FAO (Food and Agriculture Organization of the United Nations).
2009. How to feed the world in 2050. www.fao.org/fileadmin/ templates/wsfs/docs/expert_paper/How_to_Feed_the_World_ in_2050.pdf. Viewed 18 May 2016.
Foy RH and Kirk M. 1995. Agriculture and water quality: a regional study. Water Environ J 9: 247–56.
Fraterrigo JM and Downing JA. 2008. The influence of land use on lake nutrients varies with watershed transport capacity.
Ecosystems 11: 1021–34.
Garnett T, Appleby MC, Balmford A, et al. 2013. Sustainable inten-sification in agriculture: premises and policies. Science 341: 33–34. Gascuel-Odoux C, Massa F, Durand P, et al. 2009. Framework and
tools for agricultural landscape assessment relating to water quality protection. Environ Manage 43: 921–35.
Groffman PM, Baron JS, Blett T, et al. 2006. Ecological thresholds: the key to successful environmental management or an impor-tant concept with no practical application? Ecosystems 9: 1–13. Hattermann FF, Krysanova V, Habeck A, and Bronstert A. 2006.
Integrating wetlands and riparian zones in river basin model-ling. Ecol Model 199: 379–92.
Heathwaite AL, Quinn PF, and Hewett CJM. 2005. Modelling and managing critical source areas of diffuse pollution from agricultural land using flow connectivity simulation. J Hydrol
304: 446–61.
Howden NJK, Burt TP, Mathias SA, et al. 2011. Modelling long- term diffuse nitrate pollution at the catchment- scale: data, parameter and epistemic uncertainty. J Hydrol 403: 337–51. Jarvie HP and Jenkins A. 2014. Accounting for ecosystem services
in water quality standards compliance. Environ Sci Technol 48: 14072–74.
Kröger R, Dunne EJ, Novak J, et al. 2013. Downstream approaches to phosphorus management in agricultural landscapes: regional applicability and use. Sci Total Environ 442: 263–74.
Leibowitz SG, Loehle C, Li BL, and Preston EM. 2000. Modeling landscape functions and effects: a network approach. Ecol Model 132: 77–94.
Lockwood M, Raymond CM, Oczkowski E, and Morrison M. 2015. Measuring the dimensions of adaptive capacity: a psychometric approach. Ecol Soc 20: 37.
McDowell RW and Wilcock RJ. 2008. Water quality and the effects of different pastoral animals. New Zealand Vet J 56: 289–96.
McDowell RW, Dils RM, Collins AL, et al. 2016. A review of the policies and implementation of practices to decrease water quality impairment by phosphorus in New Zealand, the UK, and the US. Nutr Cycl Agroecosys 104: 289–305.
McDowell RW, Monaghan RM, and Morton J. 2003. Soil phos-phorus concentrations to minimise potential P loss to surface waters in Southland. New Zealand J Agr Res 46: 239–53. McDowell RW, Snelder TH, Cox N, et al. 2013. Establishment of
reference or baseline conditions of chemical indicators in New Zealand streams and rivers relative to present conditions. Mar Freshwater Res 64: 387–400.
McElarney Y, Rippey B, Rosell R, et al. 2015. Development of tar-geted ecological modelling tools for lake management (DOLMANT) – technical report. EU INTERREG IVA Cross-border Programme. https://www.afbini.gov.uk/articles/dol-mant-development-lake-management-tools#toc-5.
McGonigle DF, Harris RC, McCamphill C, et al. 2012. Towards a more strategic approach to research to support catchment- based policy approaches to mitigate agricultural water pollu-tion: a UK case- study. Environ Sci Policy 24: 4–14.
MFE (Ministry for Environment – New Zealand). 2014. National Policy Statement for Freshwater Management. Publication reference number ME 1155. www.mfe.govt.nz/node/19456. Viewed 18 May 2016.
Moss B. 2008. Water pollution by agriculture. Philos T Roy Soc B
363: 659–66.
Nair VD. 2014. Soil phosphorus saturation ratio for risk assessment in land use systems. Front Environ Sci 2; doi:10.3389/ fenvs.2014.00006.
OECD (Organisation for Economic Cooperation and Development). 2012. Water quality and agriculture: meeting the policy challenge. Paris, France: OECD Studies on Water, OECD Publishing; doi:10.1787/9789264168060- en.
Page T, Heathwaite AL, Moss B, et al. 2012. Managing the impacts of nutrient enrichment on river systems: dealing with complex uncertainties in risk analysis. Freshwater Biol 57: 108–23. Pretty J. 2008. Agricultural sustainability: concepts, principles and
evidence. Philos T Roy Soc B 363: 447–65.
Rowe H, Withers PJA, Baas P, et al. 2015. Integrating legacy soil phosphorus into sustainable nutrient management strategies for future food, bioenergy and water security. Nutr Cycl Agroecosys; doi:10.1007/s10705- 015- 9726- 1.
Scheffer M, Carpenter S, Foley JA, et al. 2001. Catastrophic shifts in ecosystems. Nature 413: 591–96.
Schippers P, van de Weerd H, De Klein J, et al. 2006. Impacts of agricultural phosphorus use in catchments on shallow lake water quality: about buffers, time delays and equilibria. Sci Total Environ 369: 280–94.
Schulte RP, Creamer RE, Donnellan T, et al. 2014. Functional land management: a framework for managing soil- based ecosys-tem services for the sustainable intensification of agriculture.
Environ Sci Policy 38: 45–58.
Sharpley A, Jarvie HP, Buda A, et al. 2013. Phosphorus legacy: over-coming the effects of past management practices to mitigate future water quality impairment. J Environ Qual 42: 1308–26. SLIM (Social Learning for the Integrated Managing and
sustaina-ble use of water at catchment scale). 2004. Social learning as a policy approach for sustainable use of water. http://bit.ly/1qr-M5Uf. Viewed 18 May 2016.
Smith VH and Schindler DW. 2009. Eutrophication science: where do we go from here? Trends Ecol Evol 24: 201–07. Swetnam TW, Allen CD, and Betancourt JL. 1999. Applied
his-torical ecology: using the past to manage for the future. Ecol Appl 9: 1189–206.

![Figure 2. Conceptual framework for the capacity of a catchment to buffer changes in a catchment attribute (eg soluble phosphorus [P] concentrations in the river) in response to nutrient inputs to the catchments (eg P fertilizer inputs)](https://thumb-us.123doks.com/thumbv2/123dok_us/9604593.1488881/3.612.285.533.53.219/conceptual-framework-catchment-catchment-phosphorus-concentrations-catchments-fertilizer.webp)