Efficient and low complexity analysis of
Bio-signals using continuous Haar wavelet
transforms for removing noise
S.GANESAN Asst. Professor, Dept. of ECE Adhiparasakthi Engineering College Melmaruvathur, Tamilnadu, India-603 319.
and
Research Scholar, Anna University of Technology-Coimbatore Dr. D.SIVAKUMAR
Professor & Head
Dept. of Information & Technology Adhiparasakthi Engineering College Melmaruvathur, Tamilnadu, India-603 319. Dr.T.ARUL DOSS ALBERT VICTOIRE
Assistant Professor Dept of Electrical & Electronics Anna University of Technology-Coimbatore
Coimbatore, India-641 047
Abstract:
This work has been inspired by the need to find an efficient method for ECG Signal Analysis which is simple and has good accuracy and less computation time. The initial task for efficient analysis is the removal of noise. It actually involves the extraction of the required cardiac components by rejecting the background noise. Enhancement of signal is achieved by the use of Empirical Mode Decomposition (EMD) method. The use of EMD was inspired by its adaptive nature. The second task is that of R peak detection which is achieved by the use of Continuous Wavelet Transform (CWT).Efficiency of the method is measured in terms of detection error rate. Various other methods of R peak detection like Hilbert Transform and Difference Operation Method are implemented and the results when compared with the Continuous Wavelet Transform prove that CWT is a better method. The simulation is done in MATLAB environment. The experiments are carried out on MIT-BIH database. The results show that our proposed method is very effective and an efficient method for fast computation of R peak detection.
Keywords: Electrocardiography (ECG), Empirical Mode Decomposition (EMB), Continuous Wavelet Transform CWT), MIT-BIH database.
1.Introduction
1.1 ECG Processing Tasks
Electrocardiogram (ECG) is a nearly periodic signal that reflects the activity of the heart. A lot of information on
Another useful processing task is a noise alert algorithm which determines the fidelity of the ECG by indicating the level and type of noise in the signal
1.2 R wave peak detection
A lot of work has been done in the field of ECG signal Analysis using various approaches and methods. The basic principle of all the methods however involves transformation of ECG signal using different transformation techniques including Fourier Transform, Hilbert Transform, Wavelet transform etc. Physiological signals like ECG are considered to be quasi-periodic in nature. They are of finite duration and non stationary. Hence, a technique like Fourier series (based on sinusoids of infinite duration) is inefficient for ECG. On the other hand, wavelet which is a very recent addition in this field of research, provides a powerful tool for extracting information from such signals. There has been use of both Continuous Wavelet Transform CWT) as well as Discrete Wavelet Transform (DWT). However CWT has some inherent advantages over DWT. Unlike DWT, there is no dyadic frequency jump in CWT. Moreover, high resolution in time-frequency domain is achieved in CWT [3]. Transmission of ECG often results in the corruption of signal due to introduction of noise. [5] Various factors responsible for introduction of noise include poor channel conditions, Baseline wander (caused by respiration), 50 or 60 Hz power line interference etc. Analyzing such a noisy signal is bound to give erroneous results. Thus the signal is first made free of noise, a process called denoising or rather we may call it enhancement. A number of methods have been incorporated for enhancement ECG signal. These include use of filter banks, neural network, adaptive filtering etc. Empirical Mode Decomposition is a recent development which provides a powerful tool for decomposing a signal into a finite number of IMFs (Intrinsic Mode Functions). Empirical Mode Decomposition (EMD) has been used in a number of literatures for R-peak detection as well as enhancement. Fig 1 shows the block diagram of the process incorporated in the proposed method
Figure 1. Block diagram of proposed method
1.3 Objective
ECG reflects the state of cardiac heart and hence is like a pointer to the health conditions of a human being.
ECG, if properly analyzed, can provide us information regarding various diseases related to heart. However, ECG being a non-stationary signal, the irregularities may not be periodic and may show up at different intervals. Clinical observation of ECG can hence take long hours and can be very tedious. Moreover, visual analysis cannot be relied upon. This calls for computer-based techniques for ECG analysis. Various contributions have been made in literature regarding beat detection and classification of ECG [18] [19] [20].
2. Materials and Methods
2.1 ECG: anatomical and physiological background Heart:
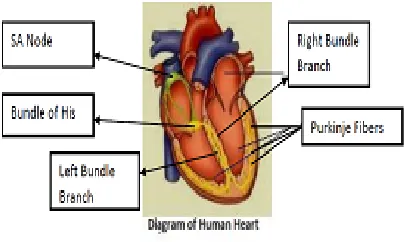
The heart, located in the mediastinum, is the central structure of the cardiovascular system. It is protected by the bony structures of the sternum anteriorly, the spinal column posteriorly, and the rib cage. Sinoatrial (SA) node is the dominant pacemaker of the heart, located in upper portion of right atrium. It has an intrinsic rate of 60– 100bpm.Atrioventricular (AV) node is a part of AV junctional tissue. It slows conduction, creating a slight delay before impulses reach ventricles. It has an intrinsic rate of 40–60 bpm [10].
The Heart: Phases: There are two phases of the cardiac cycle [10].
Systole: The ventricles are full of blood and begin to contract. The mitral and tricuspid valves close
(between atria and ventricles). Blood is ejected through the pulmonic and aortic valves.
Diastole: Blood flows into the atria and through the open mitral and tricuspid Valves into the ventricles.
Fig. 2 shows conduction system structure. ECG stands for electrocardiography. It is a series of waves and deflections recording the heart’s electrical activity from a certain “view”. Many views, each called a lead, monitor voltage changes between electrodes placed in different positions on the body.
Figure 2. Conduction system structure
Each cardiac cell is surrounded by and filled with solutions of Sodium (Na+), Potassium (K+), and Calcium (Ca++). The interior of the cell membrane is considered to be negative with respect to outside during resting conditions. When an electric impulse is generated in the heart, the interior part becomes positive with respect to the exterior.
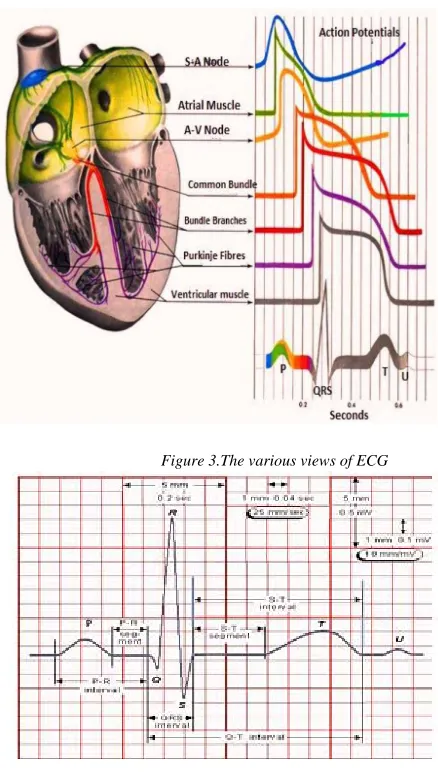
Figure 3.The various views of ECG
Figure 4. Normal ECG signal and its various components
2.2 P-QRS-T deflections
The impulses of the heart are recorded as waves called P-QRS-T [10].
deflections. The following is the description and significance of each deflection and segment i. P wave : Indicates atrial depolarization (and contraction).
ii. PR Interval: Measures time during which a depolarization wave travels from the atria to the ventricles.
iii. QRS Interval: Includes three deflections following P wave which indicates ventricular depolarization (and contraction). Q wave is the first negative deflection while R wave is the first positive deflection. S wave indicates the first negative deflection after R wave.
ST Segment : Measures the time between ventricular depolarization and beginning of repolarization.
2.3 Arrhytmia
Normally, the SA Node generates the initial electrical impulse and begins the cascade of events that result in a heart-beat. For a normal healthy person the ECG comes off as a nearly periodic signal with depolarization followed by repolarization at equal intervals. However, sometimes this rhythm becomes irregular. Cardiac arrhythmia(also dysrhythmia) is a term for any of a large and heterogeneous group of conditions in which there is abnormal electrical activity in the heart. The heart beat may be too fast or too slow, and may be regular or irregular. Arrthymia comes in varieties. It may be described as a flutter in chest or sometimes “racing heart”. The diagnosis of Arrthymia requires Electrocardiogram. By studying ECG, Doctors can diagnose the diseaseand prescribe the required medications. 3. Enhancement of ECG Signal using EMD Method
ECG provides information regarding the state of heart i.e. it gives us useful data regarding diseases. Thus ECG analysis is an important method for monitoring patients. However, the efficiency of diagnosis relies heavily upon accurate analysis of the signal. But the ECG signal that we obtain for analysis is not free from noise. The most important job for a coder is to denoise the ECG i.e. to extract the valid cardiac components and reject the rest of the background noise.
Transmission of ECG often results in the corruption of signal due to introduction of noise [4] [5]. Various factors responsible for introduction of noise include poor channel conditions, Baseline wander (caused by respiration), 50 or 60 Hz power line interference etc. Analyzing such a noisy signal is bound to give erroneous results. The process of extracting the required components while rejecting the background noise is called Enhancement of ECG signal. Numerous methods have been implemented for denoising ECG signals. Some of them are use of Neural Networks [8], Wavelet Transform [9], Independent Component analysis [7] etc. These methods have shown good performance but have some limitations like arbitrary nature, dependence on frequency content etc.
In our search for an efficient enhancement technique, we have implemented a combination of Empirical Mode Decomposition method and low-pass filtering for the enhancement of ECG signal.
3.1 Empirical Mode Decomposition:
A new non-linear technique, called Empirical Mode Decomposition method, has recently been developed by N.E.Huang et al for adaptively representing non-stationary signals as sums of zero mean AM-FM components [6]. EMD is an adaptive, high efficient decomposition with which any complicated signal can be decomposed into a finite number of Intrinsic Mode functions (IMFs). The IMFs represent the oscillatory modes embedded in the signal, hence the name Intrinsic Mode Function. The starting point of EMD is to consider oscillations in signals at a very local level. It is applicable to non-linear and non-stationary signal such as ECG signal.
An Intrinsic Mode function is a function that satisfies two conditions [6]:
The number of extrema and the number of zero crossings must differ by at most 1.
At any point the mean value of the envelope defined by maxima and the envelope defined by minima must be zero.
Shifting Process
Some of the assumptions made for decomposition are:
The signal has at least two extrema: one maximum and one minimum
The characteristic time scale is defined by the time lapse between the extrema.
The basic principle of this method is to identify the intrinsic oscillatory modes by their characteristic time scales in the data empirically and then decompose the data. A systematic way to extract the IMFS is called the Sifting Process and is described below:
Identify all the extrema of x(t).
Interpolate between minima, ending up with a signal min (t) and similarly between extrema to give max (t).
Compute the average: e(t)= ( min (t) + max (t))/2
Extract the detail: d(t) = x(t)-e(t) (Steps 1-4 are repeated till d(t) satisfies both the criteria of IMF)
Iterate on the residual e(t)
In practice, after a certain number of iterations, the resulting signals do not carry significant physical information. To prevent this, we go for some boundary conditions. We can stop the sifting process by limiting the normalized standard deviation (nstd). [12]
The nstd is defined as :
The nstd is set between 0.2 and 0.3 for proper results. [12]
The sifting process was applied on an ECG signal to obtain the various IMFs. This has been represented in Fig.5 and Fig.6.
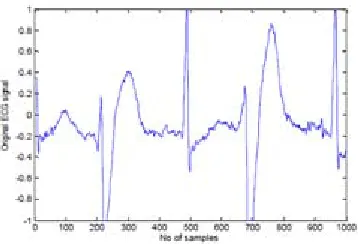
Fig 5. Shows an ECG signal (200_1 MIT-BIH database) containing 1000 samples. Fig.6 shows the various IMF’s of the ECG signal given in fig. 5
Figure 6. The various IMF’s of the ECG signal given in fig.5
The EMD method is a powerful tool for analyzing ECG signal. It is very reliable as the base functions depend on the signal itself. EMD is very adaptive and avoids diffusion and leakage of signal. The basic principle of enhancement of ECG signal using EMD is expressing the noisy ECG as sum of a series of IMFs. It has been shown that the 1st IMF contains nothing but high frequency noise [4]. So we can easily eliminate this component. The next two IMFs contain both noise as well as information. It has been shown that if we remove the 2nd IMF there is heavy distortion of the R- peaks [4]. In order to remove noise while preserving the information we go for filtering.
The whole procedure can be described by the following algorithm. The ECG signal is first decomposed into IMFs. The sum of these IMFs should represent the signal well. The IMFs are obtained using the sifting process described in the earlier section. The first four IMFs are filtered to remove noise. We use a low pass filter as the noise comprises the higher frequency components. The filter used by us in programming is the low pass Butterworth filter. We use a Butterworth filter because of its inherent characteristics of having a flat frequency response.The 1st IMF is now eliminated. We reconstruct the enhanced signal by eliminating the 1st IMF and adding up the rest IMFs.
4 . R peak Detection of ECG Signal
ECG signal can be expressed as repetitions of P-QRS-T waves. The basic principle behind the analysis of ECG signal is finding the QRS complex. R peak detection is the 1st and foremost step in finding the QRS complex. Various methods have been implemented in the recent past for R peak detection including Fourier Transform, Hilbert Transform [1], Difference Operation Method [2], Wavelet Transform [3], Empirical Mode Decomposition [11] etc. We have tried out a few methods in the course of our search for an efficient algorithm for R peak detection.
4.1 Use of Hilbert Transform for R-peak detection:
Hilbert Transform
Given a real time function x(t) its Hilbert transform is given by X(t) as
X(t) and x(t) are related to each other in such a way that they together create a strong analytic signal. The strong analytic signal can been written with a amplitude and phase where the derivative of phase can be identified as the instantaneous frequency. The Fourier transform of the strong analytic signal gives us a one sided spectrum in frequency domain.
And its instantaneous phase angle in the complex plane can be defined by
Applying the fourier transform we have
Thus we find that a function and its Hilbert transform are orthogonal. Hilbert transform of the original function x(t) represents its harmonic conjugate. The use of Hilbert Transform in ECG signal analysis was first described by Bolton and Westphal. The envelope determined using (4) has the same slope and magnitude of the original signal x(t) at or near its maxima. Moreover B(t) is always a positive function as can be seen from (4). Hence, when x(t)=0, the maximum contribution to B(t) is given by the Hilbert transform. So if we have to find the peaks, i.e. the points where
(7)
then indirectly we need to find the maximum contribution to the envelope of the first differential of the ECG. This is the basic principle underlying the use of Hilbert Transform in R-peak detection. The Algorithm developed by D. Benitez [2] is described below: Fig. 7 shows the process of finding R peaks using Hilbert transforms.
Figure 7. Block diagram of process of finding R peaks using Hilbert transforms
The steps followed can be summarized as follows:
4.2 Difference Operation Method :
Difference Operation is a simple and fast method for detecting QRS complexes [1]. DOM includes two stages: 1st stage is to find the R peak by applying difference operation to the ECG signal. 2nd stage looks for points Q and S to find the QRS complex. The Difference Operation method doesn’t involve any complex mathematical calculation such as cross-correlation, Fourier transform etc. It essentially involves finding the difference signal or the derivative. Thus it uses basic calculus for finding the peak points. The method of Difference operation is as follows:
Obtain the difference signal of a given signal x(t) as d(t)= x(t)-x(t-1) The difference signal is passed through a low pass filter to obtain df(t) Threshold is used for finding the required peak points.
The algorithm for the difference operation method [1] is described below: The difference operation is first implemented according to the following steps:
• Download the original ECG signal x
• Obtain the difference signal xd given as xd(n)=x(n)-x(n-1) • Pass the difference signal through a low pass filter to obtain xdf • xdf is then put through thresholding to obtain xdf 1
R peaks are then detected by following the steps as given below: • Separate xdf1 into two kinds of signals: positive and negative parts • Select the correct extreme value points
• The position of maximum positive value is point R in the interval The process followed for Q and S detection is:
• Consider 20 points before and after R-peak .The position of minimum value in front of R is Q1 and after R is S1.
• Consider 80 points before and after R peak. The position of minimum value in front of R is Q2 and after R is S2.
• If pos(Q2)=pos(Q1) then Q=Q1 If Vq2<Vq1 then Q=Q2 If Vq2>Vq1 then Q=Q1
• Similar method is followed for S detection
4.3 Use of Continuous Wavelet Transform in R peak Detection
1.Wavelet Transform: Wavelets are a powerful tool for the representation and analysis of ECG signal. They have
been implemented for the analysis of physiological waveforms like ECG, Phonocardiogram etc. [15] [3] [13] [17]. This is because wavelet has finite duration as compared to Fourier methods based on sinusoids of infinite duration. Wavelet Transform involves the decomposition of signal into various components. They provide both time and frequency view. Unlike Fourier transform, they are very efficient for non-stationary signals like ECG.
This process is repeated by varying the length of the window. So we have a collection of representations, hence the name multi-resolution analysis.
2. Continuous Wavelet Transform: Wavelet transforms are applied to decompose the signal into a set of coefficients
that describe the signal frequency content at given times. The continuous wavelet transform of the signal, x(t), is defined as [3]:
Here Ψ(t) is the analyzing wavelet function a is the dilation parameter and
b is the location parameter of the wavelet
Actually the wavelets are generated from a single basic wavelet Ψ(t), the so called mother wavelet, by scaling and translation.
Here τ is the scaling factor and √ (1/s) is for normalization across the different scales.
Due to the scaling and translation, Wavelet Transform is localized in both time and frequency. Several Mother Wavelets like Mexican-hat and Morlet have been used in ECG signal analysis. The mother wavelet has a lot of significance for the efficiency of the process. In this paper we have used Haar Wavelet as the mother wavelet. We have gone for Haar wavelet because the oscillatory nature of other mother wavelets results in several ridges for each ECG component, while only one pair of ridges is generated via the Haar wavelet due to its configuration. Fig. 8 shows the Haar wavelet. The Haar wavelet's mother wavelet function Ψ(t) as shown in Fig.8 can be described as
Ψ(t) = 1 0 ≤ t < 1 /2 = -1 1/ 2 ≤ t < 1 = 0 otherwise
Figure 8. Haar mother wavelet
CWT over DWT is choosed because unlike DWT there is no dyadic frequency jump in Continuous wavelet transform [3]. Also high resolution in time-frequency domain is achieved. The basic principle involved here is using a threshold detector [3]. After the enhancement of the ECG signal, it is transformed using Continuous Wavelet Transform using equation (2).
The mother wavelet used here is the Haar Mother wavelet. It is preferred here because the oscillatory nature of other mother wavelets results in several ridges for each ECG component, while only one pair of ridges is generated via the Haar wavelet due to its configuration. The second step involves the use of a Threshold based detector. Positive maximum peaks larger than a threshold are selected. The main threshold is chosen as a fraction of root mean square of the signal. We have chosen this to be around two times the root mean square of the signal after carrying out a series of experiments.
For further identification of Q and S peaks we use search intervals. Other positive and negative peaks are searched about the R peaks. The positive maximum peak to the left of R peak denotes Q and the negative minimum peak to the right of R peak denotes S.
5. Experimental Results
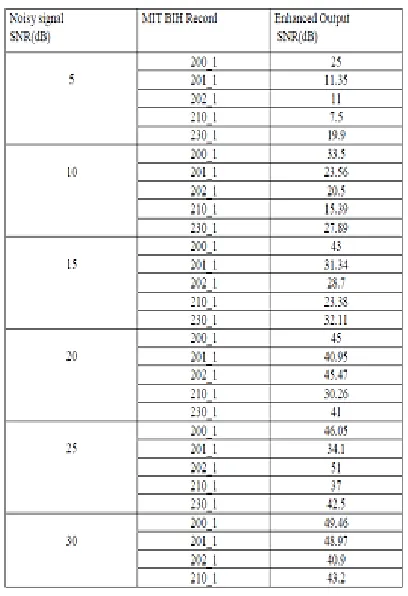
MIT-BIH database is used to validate the efficiency of proposed method. Simulation was carried out in MATLAB environment. Addition of White Gaussian noise to the clean ECG signals to obtain a collection of noisy ECG signals with SNR varying from 5 dB to 30 dB is done.
The enhancement algorithm was then used and the SNRs of the enhanced signals were calculated to find the efficiency of the proposed method.
To validate the efficiency of the method, after the process of enhancement, implementation of R peak detection using CWT.
Fig. 9. (a) shows clean ECG signal and 9. (b) and 9. (c) shows noisy ECG signal after the addition of white Gaussian noise and Denoised signal after signal enhancement. Table 1 shows experimental results for Enhanced method using EMD
Fig. 10 shows Step by step representation of each stage in the process of using Hilbert transform and Table 1 shows Experimental results for Enhanced method using EMD
Table 1 Experimental results for Enhanced method using EMD
Table 2 shows experiments of using Hilbert transform for R peak detection
This indicates the detection error rates and sensitivity. Here FP denotes False Positive i.e. False peak detection and FN denotes False Negative i.e. failure to detect.
The total detection error rate is calculated as (FP +FN)/Total no of R peaks *100. The average detection error rate is found to be 0.21%. Efficiency is measured in terms of Sensitivity given by
Here TP stands for True Positives which is the total no of peaks correctly detected by the detector. Sensitivity is calculated to be 99.8 % which shows the method has a good efficiency
Although this method is very crude it comes with some advantages. The unwanted effects of large peaked T and P waves are minimized. Moreover it has been shown to perform extremely well in the presence of noise [2].
Experimental results for Difference operation method
Figure 10. Step by step representation of each stage in the process of using Hilbert transforms
The efficiency was measured in terms of detection error rate i.e. it is a measure of the number of failures.
Simulation was carried out in MATLAB environment. The signals used are from the MIT-BIH database. Fig. 11 shows experimental results for Differential operation method (DOM). This shows Step by step representation of the various stages in the DOM method.
Table 2 experiments of using Hilbert transform for R peak detection
Fig. 12 shows R peak and QRS detection using DOM approach: Red lines denote R peaks and QRS complexes. Table 3 indicates the detection error rates and sensitivity. The average detection error rate is found to be 0.21%. Sensitivity is calculated to be 99.94%.
Figure 12. R peak and QRS detection using DOM approach: Red lines denote R peaks and QRS complexes.
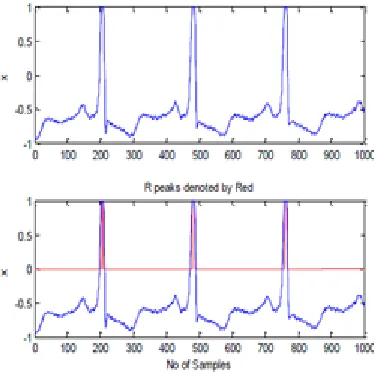
The method may not show outstanding efficiency but has its advantages. It is very simple and fast and doesn’t involve complex equations as in case of Fourier methods. It is useful in cardiac arrhythmia diagnosis method [14]. Fig. 13 shows R peak detection using continuous wavelet transform.
Table 3: Experimental Results for the use of DOM approach in R peak detection
Table 4 Experimental results of the R peak detection using CWT
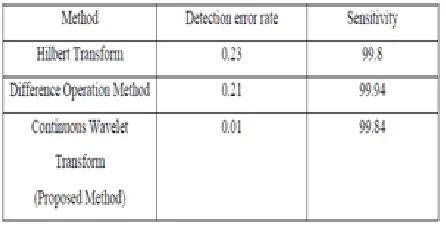
Table 4 indicates the detection error rates and sensitivity. The detection error rate calculated for this method is 0.01% while the sensitivity is found to be 99.84%. Fig.12 indicates R peak detection using CWT. The CWT method is found to have a good sensitivity. The average detection error rate is very low making this method highly lucrative. Moreover this method is much more evolved than others. The best feature of this method is that it is suitable for non-stationary signals like ECG. Comparing the detection error rates and sensitivity of the different methods in Table 5 we find that CWT is a better choice for R peak detection.
Table 5. Performance comparison of methods of R peak detection
6. Conclusion
Sole objective of this project is to develop a method for efficient analysis of ECG signal. In this piece of work, we have proposed a novel method of enhancement of ECG signal using Empirical Mode Decomposition. Deviating from other approaches of using EMD, we proposed the use of low-pass filters for efficient noise removal. A number of earlier proposed methods for R peak detection including Hilbert Transform, Difference Operation Method and Continuous Wavelet Transform were implemented. Efficiency in case of CWT is better as compared to other methods. The average detection error rate for CWT is 0.01% as compared to 0.23% of Hilbert Transform Method and 0.21% of DOM method. The sensitivity of DOM (99.94%) is better than CWT (99.84%), but the low detection error rates compensates for this. Thus the method of signal enhancement and R peak detection using Empirical Mode Decomposition method and Continuous Wavelet Transform is a novel, efficient method having less computation time, hence best suited for analysis of ECG signal for clinical purposes.
REFERENCES
[1] Yun-Chi Yeh, Wen-June Wang, “QRS complex detection for ECG signal: The Difference Operation Method”, Computer Methods and Programs in Biomedicine 9I(2008) 245-254
[2] D.Benitez, “The use of Hilbert Transform in ECG Signal Analysis”, Comput. Biol .Med. 31 (2001) 399-406
[3] A.Ghaffari, H.Golabayani, M.Ghasemi, “A new mathematical based QRS detector using continuous wavelet transform”, Computers and Electrical Engineering 34(2008) 81-91
[4] Yan Lu, Jingyu Yan, and Yeung Yam, “Model Based ECG denoising using empirical mode decomposition,” IEEE International Conference on Bioinformatics and Biomedicine, pp. 191-196, 2009.
[5] Guodong Tang and Aina Qin, “ECG Denoising based on Empirical Mode Decomposition,” 9th International Conference for Young Computer Scientists, pp. 903-906
[6] N. E. Huang, Z. Shen, S. R. Long, M. C. Wu, H. H. Shih, Q. Zheng, N.-C. Yen, C. C. Tung, and H. H. Liu, “The empirical mode decomposition and the Hilbert spectrum for nonlinear and nonstationary time series analysis,” Proc. Roy. Soc. Lond., vol. A 454, pp. 903– 995, 1998.
[7] A.Barros, A.Mansour, and N.Ohnishi, “Removing Artifacts from ECG signals using independent components analysis”, Neuro-computing, vol.22, pp-173-186, 1998
[8] G.D. Clifford and L. Tarassenko, “One-pass training of optimal architecture auto-associative neural network for detecting ectopic beats,” Electron Lett., vol. 37, no. 18, pp. 1126-1127, Aug. 2001
[9] P.M. Agante and J.P.M de Sa, “ECG noise filtering using wavelets using soft thresholding methods”, in Proc. Comput. Cardiology 1999, pp. 535-542
[10] F.A.Davis, “ECG_NOTES,” 2005
[11] Jing- tian Tang,Xiao –li Yang, “The Algorithm of R peak detection in ECG based on empirical Mode Decomposition”, IEEE, 4th International Conference on Natural Computation.
[12] Hualao Ling,Qiu-Hua Lin and J.D.X.Chen, “Application of the Empirical Mode decomposition to the analysis of Esophageal Reflux Disease”, IEEE transactions on Biomedical Engineering, Vol.52,No.10 (2005)
[14] Yun-Chi Yeh, Wen-Jun Wang, Che Wun Chiou,” Cardiac arrhythmia diagnosis method using linear discriminant analysis on ECG signals”, Measurement 42(2009) 778-789
[15] Sreeraman Rajan, R. Doraiswami, M. Stevenson and R.Waltrous,” Wavelet based bank of correlators approach for phonocardiogram signal classification”, IEEE, pp. 77-80 (1998)
[16] Nugent, C.D, Webb, J.A.C, Black, N.D., Wright, G.T.H.and M. McIntyre; “An intelligent framework for the classification of the 12-lead ECG”, Artificial Intelligence in Medicine 16 (1999) 205–222
[17] Szi-Wen Chena, Hsiao-Chen Chena and Hsiao-Lung Chanb ; “A real-time QRS detection method based on moving-averaging incorporating with wavelet denoising”; Computer methods and programs in biomedicine 82 (2006) 187–195.
[18] I.K. Daskalov and I.I. Christov, “Electrocardiogram signal preprocessing for automatic detection of QRS boundaries” Medical Engineering & Physics, vol. 21, pp. 37–44, 1999.
[19] S.S. Mehta and N.S. Lingayat, “SVM-based algorithm for recognition of QRS complexes in electrocardiogram”, IRBM 29 (2008) 310–317. [20] S.S. Mehta, D.A. Shete, N.S. Lingayat and V.S. Chouhan , “K-means algorithm for the detection and delineation of QRS-complexes in