Planned Birth Before 39 Weeks
and Child Development: A
Population-Based Study
Jason P. Bentley, MBiostat, a, b, c Christine L. Roberts, DrPH, a, b Jenny R. Bowen, PhD, d Andrew J. Martin, PhD, e Jonathan M. Morris, PhD, a, b Natasha Nassar, PhDcabstract
OBJECTIVE: To investigate the association of gestational age and mode of birth with early childdevelopment.
METHODS: Population-based record linkage cohort study was conducted among 153 730 live-born infants of ≥32 weeks’ gestation with developmental assessments at school age, in New South Wales, Australia, 2002 to 2007. Children were assessed in 5 domains: physical health and well-being, language and cognition, social competence, emotional maturity, and general knowledge and communication. Children scoring in the bottom 10% of national domains were considered developmentally vulnerable, and children developmentally vulnerable for ≥2 domains were classified as developmentally high risk (DHR), the primary outcome. Robust multivariable Poisson models were used to obtain individual and combined adjusted relative risks (aRRs) of gestational age and mode of birth for DHR children.
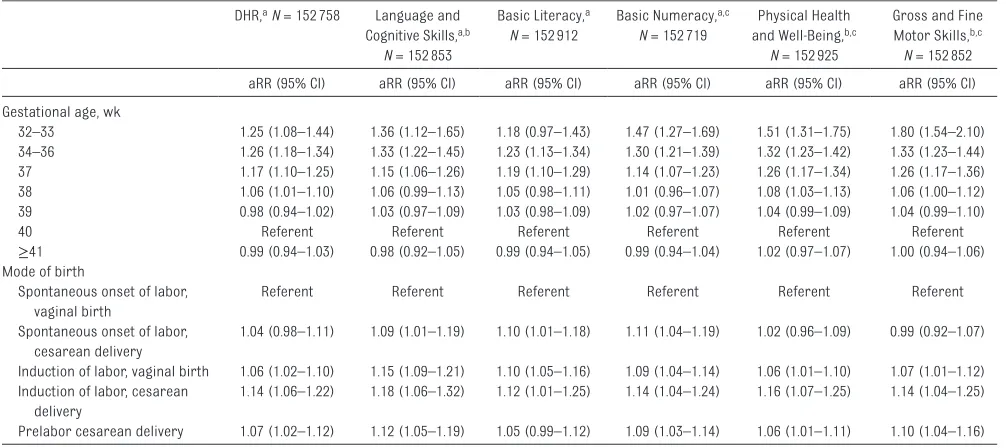
RESULTS: Overall, 9.6% of children were DHR. The aRR (95% confidence interval) of being DHR increased with decreasing gestational age (referent: 40 weeks); 32 to 33 weeks 1.25 (1.08–1.44), 34 to 36 weeks 1.26 (1.18–1.34), 37 weeks 1.17 (1.10–1.25), 38 weeks 1.06 (1.01–1.10), 39 weeks 0.98 (0.94–1.02), ≥41 weeks 0.99 (0.94–1.03), and for labor induction or prelabor cesarean delivery (planned birth; referent: vaginal birth after spontaneous labor), 1.07 (1.04–1.11). The combined aRR for planned birth was 1.26 (1.18–1.34) at 37 weeks and 1.13 (1.08–1.19) at 38 weeks.
CONCLUSIONS: Early (at <39 weeks) planned birth is associated with an elevated risk of poor child development at school age. The timing of planned birth is modifiable, and strategies to inform more judicious decision-making are needed to ensure optimal child health and development.
aClinical and Population Perinatal Health Research, Kolling Institute, Northern Sydney Local Health District, St
Leonards, New South Wales, Australia; bSydney Medical School Northern and cMenzies Centre for Health Policy,
Sydney School of Public Health, The University of Sydney, Sydney, New South Wales, Australia; dDepartment of
Neonatology, Royal North Shore Hospital, St Leonards, New South Wales, Australia; and eSchool of Education,
The University of New South Wales, Sydney, New South Wales, Australia
Mr Bentley contributed to the study design, undertook data preparation, conducted all analyses, interpreted results, and drafted the initial manuscript; Drs Roberts, Morris, and Nassar conceived the project, contributed to the study design, assisted in data acquisition and interpretation of results, provided expert clinical input and oversight, and were involved in critical revision of the intellectual content; Drs Bowen and Martin contributed to the study design and interpretation of results, provided expert clinical input and oversight, and were involved in critical revision of the intellectual content; and all authors approved the fi nal manuscript as submitted.
DOI: 10.1542/peds.2016-2002 Accepted for publication Sep 20, 2016
To cite: Bentley JP, Roberts CL, Bowen JR, et al. Planned Birth Before 39 Weeks and Child Development: A Population-Based Study. Pediatrics. 2016;138(6):e20162002
WHAT’S KNOWN ON THIS SUBJECT: Fetal brain development accelerates after 32 weeks’ gestation, and children born before 39 weeks have elevated risk of poor development. Internationally, modal gestational age has decreased due to increasing numbers of planned births (prelabor cesarean delivery and labor induction).
Fetal growth and development is a continuum, with the optimal time of birth at 39 to 40 weeks’ gestation. Fetal brain development accelerates rapidly in the later stages of
pregnancy from 32 weeks’ gestation, making it vulnerable to disruption from shortened gestation. 1, 2 There
is growing evidence that, in addition to preterm birth (≤37 weeks’ gestation), infants born early term (37–38 weeks) have a greater risk of neurodevelopmental impairment or poor school performance compared with infants born at the optimal time. 3 –7 Early childhood development
is also important for future educational achievement, health, and well-being, 8 with 11% to 17% of
children aged 4 to 6 years considered to be developmentally high risk (DHR) by school age. 9–12
Gestational age at birth arises after the spontaneous onset of labor or is determined by a clinical decision that birth should occur. In the latter case, these planned births are performed by induction of labor or prelabor cesarean delivery. Internationally, significant changes in clinical practice have seen an increase in planned births before 39 to 40 completed weeks’ gestation, particularly at 37 to 38 weeks, and a decrease in modal gestational age from 40 to 39 weeks. 13 –17 This “left-shift” in
gestational age has been attributed to increasing primary and repeat cesarean delivery, greater use of labor induction, and the clinical perception that birth just before the optimal date carries little significant morbidity. 17, 18 If poorer
neurodevelopmental outcomes are a possible consequence of early planned birth, and waiting is at all possible, then there is an urgent need to inform clinicians, mothers, and families to ensure judicious decision-making in curtailing pregnancy. To date, there has been no investigation of the potential impact of early planned birth on child development, specifically
the contribution of mode of birth. This study used record linkage of population birth, hospital, and development data to investigate the association of gestational age and mode of birth with development at school age.
METHODS
Study Population and Data Sources
The study population included all live births from 32 weeks’ gestation between 2002 and 2007 in New South Wales (NSW), Australia. The study cohort consisted of births that subsequently had measures of early development in their first year of full-time school in 2009 or 2012.
Birth records for 2002 to 2007 were obtained from the NSW Perinatal Data Collection, a population-based statutory surveillance system that includes all live births and stillbirths of ≥20 weeks’ gestation or ≥400 g birth weight if gestational age is unknown. The birth record captures information on maternal characteristics, pregnancy, labor and delivery factors, and infant outcomes. Maternal and infant hospital admission records were obtained from the NSW Admitted Patient Data Collection and used to supplement information recorded at the time of birth. Admission records include demographic, facility, diagnosis, and procedure information for every inpatient admitted to any public or private hospital in NSW. Development for children in their first year of full-time school (aged 4–6 years) was ascertained from the Australian Early Development Census (AEDC) developmental assessment instrument. 19 The AEDC is a triennial
census that was first implemented in 2009. The AEDC is the Australian adaptation of the Canadian Early Development Index. 20 Teachers
assess and record information on nearly 100 characteristics for each child, which are then combined and aggregated to calculate scores
for 5 domains and 16 subdomains. AEDC records for 2009 and 2012 were available for this study. Birth, hospital, and development records for individuals were probabilistically linked by the NSW Centre for Health Record Linkage. 21 The study was
approved by the NSW Population and Health Services Research Ethics Committee (reference number 2012-12-430).
Gestational Age and Mode of Birth
The study exposures of interest were gestational age and mode of birth, which are reliably reported in birth data. 22 Gestational age, reported in
completed weeks as determined by the best clinical estimate including early ultrasound and last menstrual period, was categorized as 32 to 33, 34 to 36, 37, 38, 39, 40 (referent), and ≥41 weeks. Mode of birth (vaginal birth or cesarean delivery) and onset of labor (spontaneous, labor induction, or prelabor cesarean section) were combined to create 5 mutually exclusive groups, with vaginal birth after spontaneous labor as the referent group. Planned births (labor induction or prelabor cesarean delivery) were also classified and compared with infants born after spontaneous labor.
Early Childhood Development
The AEDC instrument assesses development in 5 main domains: physical health and well-being, language and cognitive skills, social competence, emotional maturity, and communication skills and general knowledge. 23 Each domain contains
a number of related but distinct developmental subdomains. The AEDC instrument has been through extensive development and testing and shown to be reliable and valid. 24–26
as having special needs or aged <4 years were not assigned a domain category. The primary study outcome was children who were DHR, defined as being DV on ≥2 of the 5 main domains. 23 DV for selected domains
and subdomains was considered a priori as separate secondary study outcomes and included the physical health and well-being domain, the language and cognitive development domain, and the gross and fine motor skills, basic literacy, and basic numeracy subdomains.
Confounders
We considered a number of possible confounders of the association between developmental outcomes and gestational age and mode of birth. These included, from birth records, maternal age, parity, timing of first antenatal visit, plurality, small for gestational age,
28 5-minute Apgar score <7, sex,
and socioeconomic status 29; from
birth and hospital records, maternal diabetes or hypertension, smoking during pregnancy, maternal country of birth, and private obstetric care; from hospital records, marital status at birth and major congenital conditions; and from development records, age at assessment, assessment year, and English as a second language. (See Table 1 for categorizations.)
Statistical Analysis
Gestational age, mode of birth, developmental outcomes, and confounders were described in contingency tables. Multivariable logistic regression with progressive backward elimination was used to construct a model for each of the developmental outcomes, with gestational age and mode of birth adjusted for potential confounders. Variables were retained if they were significant at P < .05 or if they were confounders based on a change in the adjusted associations of ≥10%. Once final models were determined,
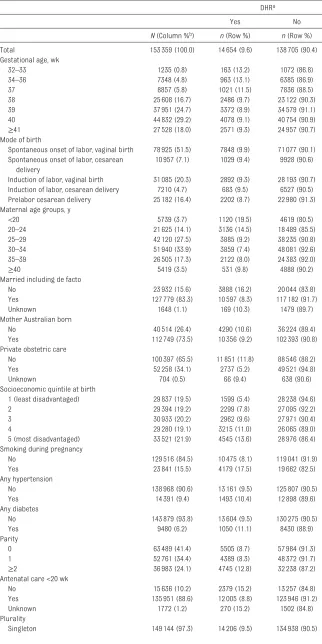
TABLE 1 Birth and Child Assessment Characteristics by DHR Status, NSW 2009 and 2012
DHRa
Yes No
N (Column %b) n (Row %) n (Row %)
Total 153 359 (100.0) 14 654 (9.6) 138 705 (90.4)
Gestational age, wk
32–33 1235 (0.8) 163 (13.2) 1072 (86.8)
34–36 7348 (4.8) 963 (13.1) 6385 (86.9)
37 8857 (5.8) 1021 (11.5) 7836 (88.5)
38 25 608 (16.7) 2486 (9.7) 23 122 (90.3)
39 37 951 (24.7) 3372 (8.9) 34 579 (91.1)
40 44 832 (29.2) 4078 (9.1) 40 754 (90.9)
≥41 27 528 (18.0) 2571 (9.3) 24 957 (90.7)
Mode of birth
Spontaneous onset of labor, vaginal birth 78 925 (51.5) 7848 (9.9) 71 077 (90.1) Spontaneous onset of labor, cesarean
delivery
10 957 (7.1) 1029 (9.4) 9928 (90.6)
Induction of labor, vaginal birth 31 085 (20.3) 2892 (9.3) 28 193 (90.7) Induction of labor, cesarean delivery 7210 (4.7) 683 (9.5) 6527 (90.5) Prelabor cesarean delivery 25 182 (16.4) 2202 (8.7) 22 980 (91.3) Maternal age groups, y
<20 5739 (3.7) 1120 (19.5) 4619 (80.5)
20–24 21 625 (14.1) 3136 (14.5) 18 489 (85.5)
25–29 42 120 (27.5) 3885 (9.2) 38 235 (90.8)
30–34 51 940 (33.9) 3859 (7.4) 48 081 (92.6)
35–39 26 505 (17.3) 2122 (8.0) 24 383 (92.0)
≥40 5419 (3.5) 531 (9.8) 4888 (90.2)
Married including de facto
No 23 932 (15.6) 3888 (16.2) 20 044 (83.8)
Yes 127 779 (83.3) 10 597 (8.3) 117 182 (91.7)
Unknown 1648 (1.1) 169 (10.3) 1479 (89.7)
Mother Australian born
No 40 514 (26.4) 4290 (10.6) 36 224 (89.4)
Yes 112 749 (73.5) 10 356 (9.2) 102 393 (90.8)
Private obstetric care
No 100 397 (65.5) 11 851 (11.8) 88 546 (88.2)
Yes 52 258 (34.1) 2737 (5.2) 49 521 (94.8)
Unknown 704 (0.5) 66 (9.4) 638 (90.6)
Socioeconomic quintile at birth
1 (least disadvantaged) 29 837 (19.5) 1599 (5.4) 28 238 (94.6)
2 29 394 (19.2) 2299 (7.8) 27 095 (92.2)
3 30 933 (20.2) 2962 (9.6) 27 971 (90.4)
4 29 280 (19.1) 3215 (11.0) 26 065 (89.0)
5 (most disadvantaged) 33 521 (21.9) 4545 (13.6) 28 976 (86.4) Smoking during pregnancy
No 129 516 (84.5) 10 475 (8.1) 119 041 (91.9)
Yes 23 841 (15.5) 4179 (17.5) 19 662 (82.5)
Any hypertension
No 138 968 (90.6) 13 161 (9.5) 125 807 (90.5)
Yes 14 391 (9.4) 1493 (10.4) 12 898 (89.6)
Any diabetes
No 143 879 (93.8) 13 604 (9.5) 130 275 (90.5)
Yes 9480 (6.2) 1050 (11.1) 8430 (88.9)
Parity
0 63 489 (41.4) 5505 (8.7) 57 984 (91.3)
1 52 761 (34.4) 4389 (8.3) 48 372 (91.7)
≥2 36 983 (24.1) 4745 (12.8) 32 238 (87.2)
Antenatal care <20 wk
No 15 636 (10.2) 2379 (15.2) 13 257 (84.8)
Yes 135 951 (88.6) 12 005 (8.8) 123 946 (91.2)
Unknown 1772 (1.2) 270 (15.2) 1502 (84.8)
Plurality
robust Poisson generalized
estimating equations with a log-link and exchangeable correlation were used to estimate adjusted relative risks (aRRs) and to account for the similarity of children assessed by the same teacher. Individual and combined adjusted associations for gestational age and by mode of birth or planned birth were calculated. To address confounding by indication for early planned birth, we repeated the analysis for low-risk pregnancies, defined as women aged 20 to 34 years without diabetes or hypertension with a liveborn, singleton infant born at ≥37 weeks’ gestation, cephalic presenting, and with a birth weight for gestational age and sex between the 10th and 90th percentiles. 28 In addition, for
multiparous women the previous pregnancy had to be low-risk, with the exception of noncephalic presentation. All analyses were performed in SAS 9.4 (SAS Institute, Inc, Cary, NC).
RESULTS
Of the 204 156 children with a 2009 or 2012 AEDC assessment, 162 872 (80%) had a linked birth record between 2002 and 2007. Children with no recorded gestational age or mode of birth or a gestational age <32 weeks (n = 1770; 1.1%) or no assigned domain category (n = 8405; 5.2%) were excluded (n = 9142; 5.6%), providing a study cohort of 153 730 children with an average assessment age of 5.5 years (SD = 0.35). Overall, 5.6% of infants were born at 32 to 36 weeks’ gestation and 22.5% at 37 to 38 weeks. Planned birth accounted for 41.4% of all births ( Table 1). Among births at 37 weeks, planned birth accounted for almost half (48.4%), and at 38 weeks they made up more than half (55.2%) (Supplemental Fig 2).
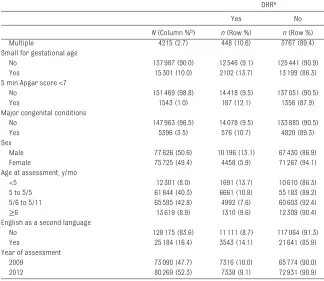
Overall, 9.6% of children were DHR and were more likely to be male, small for gestational age, or born to mothers with lower maternal
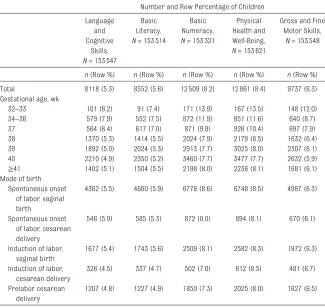
age, with greater socioeconomic disadvantage, or who smoked during pregnancy ( Table 1). The proportion of DHR children decreased with increasing gestational age: 13.1% of preterm (<37 weeks) births, 10.2% of early-term (37–38 weeks) births, and 9.0% of term (39–40 weeks) births ( Table 1). The percentage of DV children ranged from 5.3% for language and cognitive skills to 8.4% for physical health and well-being ( Table 2). As with DHR, the proportion of DV children for each of the selected measures decreased with increasing gestational age and was lowest at 39 to 40 weeks ( Table 2). The decreasing proportion of DHR or DV children with increasing gestational age was also apparent by labor onset (Supplemental Fig 3). For all outcomes the observed proportion of DHR or DV children varied by the mode of birth and was higher for vaginal birth after spontaneous labor (DHR 9.9%, DV 5.5%–8.5%) and lower for labor induction (DHR 9.3%, DV 5.2%–8.3%) and prelabor cesarean delivery (DHR 8.7%, DV 4.8%– 8.0%) ( Tables 1 and 2). However, after adjustment for confounders, compared with vaginal birth after spontaneous labor, all modes of birth that involved obstetric interventions were consistently associated with a higher risk of being DHR or DV. The increased risk of being DHR or DV associated with labor induction (6%–18%) was similar to that of prelabor cesarean delivery (5%– 12%) ( Table 3). Cesarean section after labor induction was consistently associated with the largest increase in risk (14%–18%). The adjusted risk of being DHR or DV decreased with increasing gestational age to 39 to 40 weeks. Infants born at 37 weeks’ gestation (14%–16%) and 38 weeks’ gestation (1%–8%) had a higher risk of being DHR or DV compared with those born at 40 weeks ( Table 3). Figure 1 presents the combined aRRs for the association of mode of birth and
DHRa
Yes No
N (Column %b) n (Row %) n (Row %)
Multiple 4215 (2.7) 448 (10.6) 3767 (89.4)
Small for gestational age
No 137 987 (90.0) 12 546 (9.1) 125 441 (90.9)
Yes 15 301 (10.0) 2102 (13.7) 13 199 (86.3)
5 min Apgar score <7
No 151 469 (98.8) 14 418 (9.5) 137 051 (90.5)
Yes 1543 (1.0) 187 (12.1) 1356 (87.9)
Major congenital conditions
No 147 963 (96.5) 14 078 (9.5) 133 885 (90.5)
Yes 5396 (3.5) 576 (10.7) 4820 (89.3)
Sex
Male 77 626 (50.6) 10 196 (13.1) 67 430 (86.9)
Female 75 725 (49.4) 4458 (5.9) 71 267 (94.1)
Age at assessment, y/mo
<5 12 301 (8.0) 1691 (13.7) 10 610 (86.3)
5 to 5/5 61 844 (40.3) 6661 (10.8) 55 183 (89.2)
5/6 to 5/11 65 595 (42.8) 4992 (7.6) 60 603 (92.4)
≥6 13 619 (8.9) 1310 (9.6) 12 309 (90.4)
English as a second language
No 128 175 (83.6) 11 111 (8.7) 117 064 (91.3)
Yes 25 184 (16.4) 3543 (14.1) 21 641 (85.9)
Year of assessment
2009 73 090 (47.7) 7316 (10.0) 65 774 (90.0)
2012 80 269 (52.3) 7338 (9.1) 72 931 (90.9)
a DV on ≥2 domains.
b Column percentages may not add to 100% because of missing data.
gestational age with being DHR. The pattern of increasing risk with each mode of birth and shorter gestation is apparent. For example, the combined aRRs demonstrate that compared with vaginal birth after spontaneous labor at 40 weeks’ gestation, all other modes of birth at <37 weeks’ gestation increased the risk of being DHR by 30% to 43%, at 37 weeks by 22% to 33%, and at 38 weeks by 10% to 20%. For planned birth at 37 to 38 weeks’ gestation compared with spontaneous vaginal birth at 39 to 40 weeks, the risk of being DHR increased by 17% (aRR 1.17; 95% confidence interval [CI], 1.12–1.22). The pattern of increasing risk with each mode of birth and shorter gestation was similar for the other DV secondary outcomes (Supplemental Fig 4).
To address the potential for
confounding by indication, we repeated the main analysis by using a subgroup of 54 848 (35.7%) women with low-risk pregnancies (Supplemental Table 4 and Supplemental Fig 5). The association between gestational age and developmental outcomes remained similar to the main results. However, the associations between DHR, DV in basic literacy, and DV in gross and fine motor skills and birth at 37 weeks’ gestation strengthened. The association between developmental outcomes and mode of birth varied slightly. For infants born via vaginal birth after labor induction or by cesarean section after spontaneous labor, the risk of poor development attenuated. In contrast, the aRR between prelabor cesarean delivery and all developmental outcomes became similar to, or stronger than, the risk for cesarean delivery after labor induction. In these analyses, the estimated associations were less precise because of the reduced sample size.
DISCUSSION
We have demonstrated that early planned birth is independently
associated with poor child development. This finding is significant because early birth due to planned birth now accounts for almost half of births before 39 to 40 weeks’ gestation. The decision for planned birth is predicated on beliefs that it is safer for the baby or mother to deliver early. It is of paramount importance to ensure that there are no unintended harms from such a significant shift in clinical practice. Although increased risks of poor health in childhood are associated with early planned birth, early childhood development is another important aspect of child well-being that predicts adult social, educational, and health outcomes. To our knowledge this is the first study to investigate the combined risk of mode of birth and gestational age and demonstrate the increased risk of poorer early childhood development with early planned
birth. We found not only that the risk of poor development increased for every additional week a child is born before 39 to 40 weeks’ gestation but that it increased more for modes of birth other than vaginal birth after the spontaneous labor, even among women whose pregnancies we were able to identify as being low risk. For gestational age, our findings agree with other population-based record linkage studies showing an association between decreasing gestational age and poorer childhood neurodevelopmental and cognitive outcomes. 3, 4, 6, 30–32
However, our results extend this existing knowledge revealing that poor development is exacerbated in the case of planned birth, where a considered decision made to deliver an infant determines gestational age. Because the timing of planned birth is modifiable, delaying birth may
TABLE 2 Cognitive and Physical Developmental Vulnerability by AEDC Domain for Gestational Age and Mode of Birth, NSW 2009 and 2012
Number and Row Percentage of Children Language
and Cognitive
Skills, N = 153 547
Basic Literacy, N = 153 514
Basic Numeracy, N = 153 321
Physical Health and Well-Being, N = 153 621
Gross and Fine Motor Skills,
N = 153 548
n (Row %) n (Row %) n (Row %) n (Row %) n (Row %) Total 8118 (5.3) 8552 (5.6) 12 509 (8.2) 12 861 (8.4) 9737 (6.3) Gestational age, wk
32–33 101 (8.2) 91 (7.4) 171 (13.9) 167 (13.5) 148 (12.0)
34–36 579 (7.9) 552 (7.5) 872 (11.9) 851 (11.6) 640 (8.7)
37 564 (6.4) 617 (7.0) 871 (9.8) 926 (10.4) 697 (7.9)
38 1370 (5.3) 1414 (5.5) 2024 (7.9) 2179 (8.5) 1632 (6.4)
39 1892 (5.0) 2024 (5.3) 2913 (7.7) 3025 (8.0) 2307 (6.1)
40 2210 (4.9) 2350 (5.2) 3460 (7.7) 3477 (7.7) 2632 (5.9)
≥41 1402 (5.1) 1504 (5.5) 2198 (8.0) 2236 (8.1) 1681 (6.1)
Mode of birth Spontaneous onset
of labor, vaginal birth
4362 (5.5) 4660 (5.9) 6776 (8.6) 6748 (8.5) 4987 (6.3)
Spontaneous onset of labor, cesarean delivery
546 (5.0) 585 (5.3) 872 (8.0) 894 (8.1) 670 (6.1)
Induction of labor, vaginal birth
1677 (5.4) 1743 (5.6) 2509 (8.1) 2582 (8.3) 1972 (6.3)
Induction of labor, cesarean delivery
326 (4.5) 337 (4.7) 502 (7.0) 612 (8.5) 481 (6.7)
Prelabor cesarean delivery
improve neurologic development. The biological underpinning for an elevated risk of poor development is multifactorial and related to the curtailment of brain development, resulting in reduced gray matter volume, underdevelopment of neural and physiologic pathways critical to supporting brain growth postnatally, and subsequent learning difficulties arising from behavioral disorders. 1, 2
Although early birth may be indicated and of demonstrated short-term benefit for selected high-risk pregnancies (eg, hypertension, prolonged pregnancy, suspected fetal growth restriction, prelabor rupture of membranes at term), for many conditions evidence is lacking or suggests little benefit (eg, suspected fetal macrosomia, maternal
diabetes, preterm prelabor rupture of membranes). 33 –39 Furthermore,
clinical research suggests that the threshold for planned birth and the gestational age for intervening has decreased. 17, 18 Numerous reasons
have been used to justify early planned birth, including litigation, patient and provider perception
of safety versus risk, reduced perinatal mortality, increased fetal monitoring, maternal age, obesity, and convenience. Despite these justifications and the increasing trend in planned births, national stillbirth and neonatal mortality rates have remained stable, and there has been no change in the risk of stillbirth from 36 to 40 weeks’ gestation.40
Furthermore, recent studies from the United States have demonstrated that reducing planned delivery before 39 weeks’ gestation has not increased the rates of stillbirth. 41, 42
The study findings support clinical guidelines and policies recommending that labor induction or prelabor cesarean delivery for nonmedical reasons should not be routinely carried out before 39 to 40 weeks’ gestation. Despite a specific maternity policy to this effect introduced in our own setting in 2007, there has been no appreciable change in practice. 43, 44 There also
exists substantial practice variation in the use and timing of labor induction or prelabor cesarean delivery. 44–46 Alternative measures
that encourage the peer review of medical indications for early birth and support education for health care providers have been shown to be effective in reducing rates of early planned birth and may be more successful by ensuring stronger thresholds for medical indication. 47
The increased risk of poor child development is among many short- and long-term risks to an infant born a bit early. Therefore, the potential benefits and harms of early birth for the mother and infant must be balanced against those for continuing the pregnancy. This includes increased risk of neonatal and infant morbidity, pediatric emergency department visits, childhood hospitalizations, and health care costs. 48 –51 There are also
studies suggesting that these effects, including poorer cognitive outcomes, may persist into adolescence and adulthood.52, 53 The findings of this
study add to the growing clinical and epidemiologic evidence that prolonging pregnancy (increasing gestational age), even at term (from 37–38 weeks), can benefit brain
TABLE 3 aRR of Children Being DHR or DV by AEDC Domain for Gestational Age and Mode of Birth, NSW 2009 and 2012
DHR, aN = 152 758 Language and Cognitive Skills, a, b
N = 152 853
Basic Literacy, a
N = 152 912
Basic Numeracy, a, c
N = 152 719
Physical Health and Well-Being, b, c
N = 152 925
Gross and Fine Motor Skills, b, c
N = 152 852 aRR (95% CI) aRR (95% CI) aRR (95% CI) aRR (95% CI) aRR (95% CI) aRR (95% CI) Gestational age, wk
32–33 1.25 (1.08–1.44) 1.36 (1.12–1.65) 1.18 (0.97–1.43) 1.47 (1.27–1.69) 1.51 (1.31–1.75) 1.80 (1.54–2.10) 34–36 1.26 (1.18–1.34) 1.33 (1.22–1.45) 1.23 (1.13–1.34) 1.30 (1.21–1.39) 1.32 (1.23–1.42) 1.33 (1.23–1.44) 37 1.17 (1.10–1.25) 1.15 (1.06–1.26) 1.19 (1.10–1.29) 1.14 (1.07–1.23) 1.26 (1.17–1.34) 1.26 (1.17–1.36) 38 1.06 (1.01–1.10) 1.06 (0.99–1.13) 1.05 (0.98–1.11) 1.01 (0.96–1.07) 1.08 (1.03–1.13) 1.06 (1.00–1.12) 39 0.98 (0.94–1.02) 1.03 (0.97–1.09) 1.03 (0.98–1.09) 1.02 (0.97–1.07) 1.04 (0.99–1.09) 1.04 (0.99–1.10)
40 Referent Referent Referent Referent Referent Referent
≥41 0.99 (0.94–1.03) 0.98 (0.92–1.05) 0.99 (0.94–1.05) 0.99 (0.94–1.04) 1.02 (0.97–1.07) 1.00 (0.94–1.06) Mode of birth
Spontaneous onset of labor, vaginal birth
Referent Referent Referent Referent Referent Referent
Spontaneous onset of labor, cesarean delivery
1.04 (0.98–1.11) 1.09 (1.01–1.19) 1.10 (1.01–1.18) 1.11 (1.04–1.19) 1.02 (0.96–1.09) 0.99 (0.92–1.07)
Induction of labor, vaginal birth 1.06 (1.02–1.10) 1.15 (1.09–1.21) 1.10 (1.05–1.16) 1.09 (1.04–1.14) 1.06 (1.01–1.10) 1.07 (1.01–1.12) Induction of labor, cesarean
delivery
1.14 (1.06–1.22) 1.18 (1.06–1.32) 1.12 (1.01–1.25) 1.14 (1.04–1.24) 1.16 (1.07–1.25) 1.14 (1.04–1.25)
Prelabor cesarean delivery 1.07 (1.02–1.12) 1.12 (1.05–1.19) 1.05 (0.99–1.12) 1.09 (1.03–1.14) 1.06 (1.01–1.11) 1.10 (1.04–1.16) All models adjusted for maternal age at birth, marital status at birth, private obstetric care, socioeconomic status at birth, smoking during pregnancy, maternal hypertension, maternal diabetes, parity, timing of fi rst antenatal visit, plurality, small for gestational age, age at assessment, English as a second language, and sex.
maturity at birth and potentially improve long-term health and cognitive outcomes. 1, 2, 4, 6, 7, 54
To support informed decision-making with their pregnancy care provider, it is important for women and their families to have readily available and accessible information about the optimal duration of pregnancy and any increased risk of poorer development or other adverse outcomes associated with early planned birth. 55 This
information is relevant given recent research reporting that >90% of women indicated the earliest gestational age for safe delivery was before 39 weeks. 56, 57 Furthermore,
another study reported that almost half of women thought a cesarean delivery without medical indication should be performed upon request, despite minimal knowledge about the risks and benefits of one. 58 We
advocate policies and strategies that support informed and shared decision-making for women, their families, and clinicians. Nevertheless, there are instances where the spontaneous onset of labor occurs before 39 weeks or planned birth is unavoidable, and it is important that appropriate interventions and support in early childhood are developed and provided for these potentially vulnerable children.
This study examined a large population-based cohort of
children by using validated measures of early childhood development and reliably reported information for gestational age, mode of birth, and potential confounders. 22, 24, 26, 59
Developmental outcomes were collected independently and prospectively of gestational age and mode of birth, and missing data were minimal. Follow-up through record linkage provided a cohort covering >80% of all children assessed in NSW in 2009 and 2012, with the remainder having been born outside NSW. Because of the
limitations of using administrative data, we were unable to obtain information on every potentially relevant confounder. However, face validity is demonstrated with others studies investigating childhood development adjusting for factors we could not and reporting similar findings to ours for gestational age.3 The association between
planned birth and development may be subject to confounding by indication. 60 However, because the
exact indications for planned birth are not captured in the data, we examined the association between a subgroup of low-risk pregnancies
and obtained results consistent with the main analysis.
CONCLUSIONS
Early planned birth is associated with an elevated risk of poor child development. Because the timing of planned birth is modifiable, delaying birth for an additional week or more may have significant long-term benefits. Strategies and interventions to support and encourage more judicious decision-making, weighing the risks and benefits for early planned birth, are needed to
FIGURE 1
ensure optimal child health and development.
ACKNOWLEDGMENTS
This research was supported by the use of population data from the Australian Government Department of Education and NSW Ministry of Health. However, the findings and views reported in this article are those of the authors and should not be attributed to these departments.
We also acknowledge the NSW Centre for Health Record Linkage for linking the data sets. Mr Bentley was supported by an Australian Postgraduate Award Scholarship, Sydney University Merit Award, and a Northern Clinical School Scholarship Award. Dr Roberts was supported by a National Health and Medical Research Council Senior Research Fellowship (APP1021025), and Dr Nassar was supported by a National Health and Medical Research Council
Career Development Fellowship (APP1067066).
ABBREVIATIONS
AEDC: Australian Early Development Census aRR: adjusted relative risk CI: confidence interval
DHR: developmentally high risk DV: developmentally vulnerable NSW: New South Wales
Address correspondence to Jason P. Bentley, MBiostat, Perinatal and Child Health Research, Menzies Centre for Health Policy, Level 6 The Hub, Charles Perkins Centre D17, The University of Sydney, New South Wales, 2006 Australia. E-mail: [email protected]
PEDIATRICS (ISSN Numbers: Print, 0031-4005; Online, 1098-4275). Copyright © 2016 by the American Academy of Pediatrics
FINANCIAL DISCLOSURE: The authors have indicated they have no fi nancial relationships relevant to this article to disclose.
FUNDING: Funded by a National Health and Medical Research Council project grant (APP1085775). The funding sources had no involvement in the study design; collection, analysis, and interpretation of the data; or the decision to submit this article for publication.
POTENTIAL CONFLICT OF INTEREST: The authors have indicated they have no potential confl icts of interest to disclose.
COMPANION PAPER: A companion to this article can be found online at www. pediatrics. org/ cgi/ doi/ 10. 1542/ peds. 2016- 3088.
REFERENCES
1. Davis EP, Buss C, Muftuler LT, et al. Children’s brain development benefi ts from longer gestation. Front Psychol. 2011;2:1
2. Kim D-J, Davis EP, Sandman CA, et al. Longer gestation is associated with more effi cient brain networks in preadolescent children. Neuroimage. 2014;100:619–627
3. Chan E, Leong P, Malouf R, Quigley MA. Long-term cognitive and school outcomes of late-preterm and early-term births: a systematic review. Child Care Health Dev. 2016;42(3):297–312
4. Smithers LG, Searle AK, Chittleborough CR, Scheil W, Brinkman SA, Lynch JW. A whole-of-population study of term and post-term gestational age at birth and children’s development. BJOG. 2015;122(10):1303–1311
5. Poulsen G, Wolke D, Kurinczuk JJ, et al. Gestational age and cognitive ability in early childhood: a population-based cohort study. Paediatr Perinat Epidemiol. 2013;27(4):371–379
6. Noble KG, Fifer WP, Rauh VA, Nomura Y, Andrews HF. Academic achievement varies with gestational age among
children born at term. Pediatrics. 2012;130(2). Available at: www. pediatrics. org/ cgi/ content/ full/ 130/ 2/ e257
7. Williams BL, Dunlop AL, Kramer M, Dever BV, Hogue C, Jain L. Perinatal origins of fi rst-grade academic failure: role of prematurity and maternal factors. Pediatrics. 2013;131(4):693–700
8. Lloyd JEV, Hertzman C. From kindergarten readiness to fourth-grade assessment: longitudinal analysis with linked population data. Soc Sci Med. 2009;68(1): 111–123
9. Curtin M, Madden J, Staines A, Perry IJ. Determinants of vulnerability in early childhood development in Ireland: a cross-sectional study. BMJ Open. 2013;3(5):e002387
10. Woolfson LM, Geddes R, McNicol S, Booth JN, Frank J. A cross-sectional pilot study of the Scottish early development instrument: a tool for addressing inequality. BMC Public Health. 2013;13(1):1187
11. Australian Government. A Snapshot of Early Childhood Development
in Australia 2012: Australian Early Development Index (AEDI) National Report. Canberra, Australia: Australian Government; 2013
12. Healthy Child Manitoba. Starting Early, Starting Strong: The Early Development Instrument (EDI) Report 2012–2013. Winnipeg, Canada: Government of Manitoba; 2013
13. Morris JM, Algert CS, Falster MO, et al. Trends in planned early birth: a population-based study. Am J Obstet Gynecol. 2012;207(3):186. e1–186.e8
14. Nassar N, Schiff M, Roberts CL. Trends in the distribution of gestational age and contribution of planned births in New South Wales, Australia. PLoS One. 2013;8(2):e56238
15. Zhang X, Kramer MS. The rise in singleton preterm births in the USA: the impact of labour induction. BJOG. 2012;119(11):1309–1315
17. Declercq E, Menacker F, MacDorman M. Rise in “no indicated risk” primary caesareans in the United States, 1991–2001: cross sectional analysis.
BMJ. 2005;330(7482):71–72
18. Signore C. No time for complacency: labor inductions, cesarean deliveries, and the defi nition of “term.” Obstet Gynecol. 2010;116(1):4–6
19. Commonwealth of Australia. Australian Early Development Census. 2015. Available at: www. aedc. gov. au/ . Accessed November 3, 2015
20. Janus M, Offord DR. Development and psychometric properties of the Early Development Instrument (EDI): a measure of children’s school readiness. Can J Behav Sci. 2007;39(1):1–22
21. Centre for Health Record Linkage. Quality assurance: procedures for record linkage. Available at: www. cherel. org. au/ quality- assurance. Accessed September 15, 2015
22. Taylor L, Pym M, Bajuk B, Sutton L, Travis S, Banks C. Validation Study: NSW Midwives Data Collection 1998. North Sydney, Australia: NSW Department of Health; 2000
23. Brinkman SA, Gregory TA, Goldfeld S, Lynch JW, Hardy M. Data resource profi le: the Australian Early Development Index (AEDI). Int J Epidemiol. 2014;43(4):1089–1096
24. Brinkman SA, Silburn S, Lawrence D, Goldfeld S, Sayers M, Oberklaid F. Investigating the validity of the Australian Early Development Index.
Early Educ Dev. 2007;18(3):427–451
25. Goldfeld S, Sayers M, Brinkman S, Silburn S, Oberklaid F. The process and policy challenges of adapting and implementing the Early Development Instrument in Australia. Early Educ Dev. 2009;20(6):978–991
26. Janus M, Brinkman SA, Duku EK. Validity and psychometric properties of the Early Development Instrument in Canada, Australia, United States, and Jamaica. Soc Indic Res. 2011;103(2):283–297
27. Australian Early Development Census. How to understand the AEDC results. Available at: www. aedc. gov. au/ about- the- aedc/ how- to- understand- the- aedc- results. Accessed March 23, 2016
28. Dobbins TA, Sullivan EA, Roberts CL, Simpson JM. Australian national birthweight percentiles by sex and gestational age, 1998–2007. Med J Aust. 2012;197(5):291–294
29. Australian Bureau of Statistics. Socio-economic Indexes for Areas (SEIFA). Data only, 2006. Catalogue 2033.0.55.001. Available at: www. abs. gov. au/ ausstats/ abs@. nsf/ mf/ 2033. 0. 55. 001/ . Accessed February 5, 2015
30. Chan E, Quigley MA. School performance at age 7 years in late preterm and early term birth: a cohort study. Arch Dis Child Fetal Neonatal Ed. 2014;99(6):F451–F457
31. Lipkind HS, Slopen ME, Pfeiffer MR, McVeigh KH. School-age outcomes of late preterm infants in New York City.
Am J Obstet Gynecol. 2012;206(3):222. e1–222.e6
32. Guthridge S, Li L, Silburn S, Li SQ, McKenzie J, Lynch J. Impact of perinatal health and socio-demographic factors on school education outcomes: a population study of Indigenous and non-Indigenous children in the Northern Territory. J Paediatr Child Health. 2015;51(8):778–786
33. Boers KE, Vijgen SMC, Bijlenga D, et al; DIGITAT study group. Induction versus expectant monitoring for intrauterine growth restriction at term: randomised equivalence trial (DIGITAT). BMJ. 2010;341:c7087
34. Koopmans CM, Bijlenga D, Groen H, et al; HYPITAT study group. Induction of labour versus expectant monitoring for gestational hypertension or mild pre-eclampsia after 36 weeks’ gestation (HYPITAT): a multicentre, open-label randomised controlled trial.
Lancet. 2009;374(9694):979–988
35. Irion O, Boulvain M. Induction of labour for suspected fetal macrosomia.
Cochrane Database Syst Rev. 2000;2(2):CD000938
36. Boulvain M, Senat M-V, Perrotin F, et al; Groupe de Recherche en Obstétrique et Gynécologie (GROG). Induction of labour versus expectant management for large-for-date fetuses: a randomised controlled trial. Lancet. 2015;385(9987):2600–2605
37. Buchanan SL, Crowther CA, Levett KM, Middleton P, Morris J. Planned early birth versus expectant management for women with preterm prelabour rupture of membranes prior to 37 weeks’ gestation for improving pregnancy outcome. Cochrane Database Syst Rev. 2010;3(3):CD004735
38. Dare MR, Middleton P, Crowther CA, Flenady VJ, Varatharaju B. Planned early birth versus expectant management (waiting) for prelabour rupture of membranes at term (37 weeks or more). Cochrane Database Syst Rev. 2006;1(1):CD005302
39. Gülmezoglu AM, Crowther CA, Middleton P, Heatley E. Induction of labour for improving birth outcomes for women at or beyond term. Cochrane Database Syst Rev. 2012;6(6):CD004945
40. Hilder L, Li Z, Zeki R, Sullivan EA.
Stillbirths in Australia, 1991–2009. Perinatal statistics series no. 29. Cat. no. PER 63. Canberra, Australia: AIHW National Perinatal Epidemiology and Statistics Unit; 2014
41. Little SE, Zera CA, Clapp MA, Wilkins-Haug L, Robinson JN. A multi-state analysis of early-term delivery trends and the association with term stillbirth. Obstet Gynecol. 2015;126(6):1138–1145
42. MacDorman MF, Reddy UM, Silver RM. Trends in stillbirth by gestational age in the United States, 2006–2012. Obstet Gynecol. 2015;126(6):1146–1150
43. NSW Kids and Families. Maternity: towards normal birth in NSW. Sydney, Australia: NSW Kids and Families; 2010. Available at: http:// www0. health. nsw. gov. au/ policies/ pd/ 2010/ pdf/ PD2010_ 045. pdf. Accessed February 19, 2015
44. Schemann K, Patterson J, Nippita TA, Ford JB, Matha D, Roberts CL. Variation in and factors associated with timing of low risk, pre-labour repeat caesarean sections in NSW, 2008–2011. Public Health Res Pract. 2016;26(1):e2611608
46. Schemann K, Patterson JA, Nippita TA, Ford JB, Roberts CL. Variation in hospital caesarean section rates for women with at least one previous caesarean section: a population based cohort study. BMC Pregnancy Childbirth. 2015;15:179
47. Clark SL, Frye DR, Meyers JA, et al. Reduction in elective delivery at <39 weeks of gestation: comparative effectiveness of 3 approaches to change and the impact on neonatal intensive care admission and stillbirth.
Am J Obstet Gynecol. 2010;203(5):449. e1–449.e6
48. Petrou S, Khan K. Economic costs associated with moderate and late preterm birth: primary and secondary evidence. Semin Fetal Neonatal Med. 2012;17(3):170–178
49. Stephens AS, Lain SJ, Roberts CL, Bowen JR, Simpson JM, Nassar N. Hospitalisations from 1 to 6 years of age: effects of gestational age and severe neonatal morbidity. Paediatr Perinat Epidemiol. 2015;29(3):241–249
50. Lain SJ, Nassar N, Bowen JR, Roberts CL. Risk factors and costs of hospital
admissions in fi rst year of life: a population-based study. J Pediatr. 2013;163(4):1014–1019
51. Vohr B. Long-term outcomes of moderately preterm, late preterm, and early term infants. Clin Perinatol. 2013;40(4):739–751
52. Lindström K, Winbladh B, Haglund B, Hjern A. Preterm infants as young adults: a Swedish national cohort study. Pediatrics. 2007;120(1):70–77
53. Heinonen K, Eriksson JG, Lahti J, et al. Late preterm birth and neurocognitive performance in late adulthood: a birth cohort study. Pediatrics. 2015;135(4). Available at: www. pediatrics. org/ cgi/ content/ full/ 135/ 4/ e818
54. Espel EV, Glynn LM, Sandman CA, Davis EP. Longer gestation among children born full term infl uences cognitive and motor development. PLoS One. 2014;9(11):e113758
55. Vlemmix F, Warendorf JK, Rosman AN, et al. Decision aids to improve informed decision-making in pregnancy care: a systematic review.
BJOG. 2013;120(3):257–266
56. Zhang LY, Todd AL, Khambalia A, Roberts CL. Women’s beliefs about the duration of pregnancy and the earliest gestational age to safely give birth. Aust N Z J Obstet Gynaecol. 2015;55(2):156–162
57. Goldenberg RL, McClure EM, Bhattacharya A, Groat TD, Stahl PJ. Women’s perceptions regarding the safety of births at various gestational ages. Obstet Gynecol. 2009;114(6):1254–1258
58. Dursun P, Yanik FB, Zeyneloglu HB, Baser E, Kuscu E, Ayhan A. Why women request cesarean section without medical indication?
J Matern Fetal Neonatal Med. 2011;24(9):1133–1137
59. Lain SJ, Hadfi eld RM, Raynes-Greenow CH, et al. Quality of data in perinatal population health databases: a systematic review. Med Care. 2012;50(4): e7–e20
DOI: 10.1542/peds.2016-2002 originally published online November 7, 2016;
2016;138;
Pediatrics
M. Morris and Natasha Nassar
Jason P. Bentley, Christine L. Roberts, Jenny R. Bowen, Andrew J. Martin, Jonathan
Study
Planned Birth Before 39 Weeks and Child Development: A Population-Based
Services
Updated Information &
http://pediatrics.aappublications.org/content/138/6/e20162002 including high resolution figures, can be found at:
References
http://pediatrics.aappublications.org/content/138/6/e20162002#BIBL This article cites 50 articles, 8 of which you can access for free at:
Subspecialty Collections
http://www.aappublications.org/cgi/collection/obstetrics_sub
Obstetrics
http://www.aappublications.org/cgi/collection/gynecology_sub
Gynecology
milestones_sub
http://www.aappublications.org/cgi/collection/growth:development_
Growth/Development Milestones
al_issues_sub
http://www.aappublications.org/cgi/collection/development:behavior
Developmental/Behavioral Pediatrics
following collection(s):
This article, along with others on similar topics, appears in the
Permissions & Licensing
http://www.aappublications.org/site/misc/Permissions.xhtml in its entirety can be found online at:
Information about reproducing this article in parts (figures, tables) or
Reprints
DOI: 10.1542/peds.2016-2002 originally published online November 7, 2016;
2016;138;
Pediatrics
M. Morris and Natasha Nassar
Jason P. Bentley, Christine L. Roberts, Jenny R. Bowen, Andrew J. Martin, Jonathan
Study
Planned Birth Before 39 Weeks and Child Development: A Population-Based
http://pediatrics.aappublications.org/content/138/6/e20162002
located on the World Wide Web at:
The online version of this article, along with updated information and services, is
http://pediatrics.aappublications.org/content/suppl/2016/11/03/peds.2016-2002.DCSupplemental Data Supplement at:
by the American Academy of Pediatrics. All rights reserved. Print ISSN: 1073-0397.