DEVELOPMENT AND VALIDATION OF STABILITY INDICATING RP-HPLC METHOD FOR THE SIMULTANEOUS ESTIMATION OF SITAGLIPTIN AND SIMVASTATIN
5
0
0
Full text
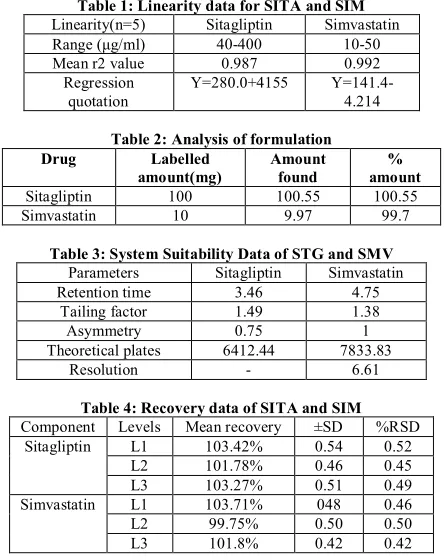
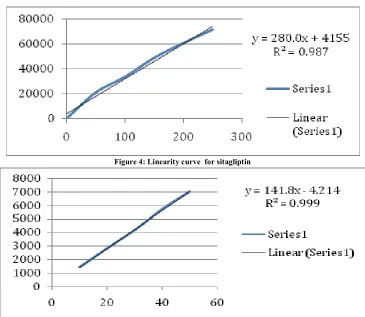
(2) Kavitha K.Y et al. IRJP 2012, 3 (12) response. Overlay spectrum of sitagliptin and simvastatin in Figure 2. Preparation of Standard solutions Standard stock solutions were prepared by dissolving 100 mg of sitagliptin and 10 mg of simvastatin in 100 ml of mobile phase (stock I) and then 4 ml of the above solution was further diluted to 100 ml with the same mobile phase, to get a concentration of 40μg/ml for sitagliptin and 4μg/ml for simvastatin respectively (stock II). A typical chromatogram is given in Figure 3. Procedure for calibration curve Five standard calibration solutions of sitagliptin and simvastatinhaving concentration in the range of 15-45μg/ml and 1-3μg/ml respectively were prepared by diluting the stock I solution with mobile phase. (Table 1 & Figure 4 & 5) Estimation of sitagliptin and simvastatin in tablet formulation Take 20 tablets weight and crushed the powder equivalent to 100 mg of sitagliptin and 10mg of simvastatin was accurately weighed and transferred into clean, dry 100ml volumetric flask. The powder was first dissolved in few ml of mobile phase by sonication, the volume was made up to 100ml and then filtered through a Whatmann filter to obtain the concentration 1000μg/mL and 100μg/ml for sitagliptin and simvastatin respectively. From 100ml with the mobile phase to get the concentration of 100μg/ml for sitagliptin 10μg/ml for simvastatin respectively. 20μl solution of the working sample solutions were injected repeatedly into the chromatograph, at a flow rate of 1 ml/min and detection at 236 nm and the % assay were calculated. (Table 2) System Suitability Tests System suitability was verified by injecting working standard solution of 30μg/ml of sitagliptin chloride and 2μg/ml of simvastatin. Various parameters such as HETP, number of theoretical plates, tailing factor and resolution between the peaks of sitagliptin and simvastatin were obtained. (Table 3) Validation parameters18 The HPLC method was validated in terms of accuracy, precision, LOD, LOQ, linearity, range and robustness as per ICH guidelines. Accuracy This parameter is performed to determine the closeness of test results with that of the true value which is expressed as % recovery. These studies were performed at three different levels (50%, 100% and 150%) and the %recovery of sitagliptin and simvastatin was calculated. (Table 4) Precision The precision of the proposed method was evaluated by carrying out six independent assays of test sample. RSD (%) of six assay values obtained was calculated. The intermediate precision was carried out by analyzing the sample in different days. (Table 5) Specificity Specificity of the method was evaluated by injecting the blank, working standard and stressed samples into the chromatograph to check the co-elution, if any, at the retention time of sitagliptin peak and simvastatin peak (Figure 5 & 6) Limit of Detection and Limit of Quantitation The limit of detection (LOD) and the limit of quantitation (LOQ) for sitagliptin and simvastatin were determined from standard deviation of the response and the slope. LOD= σ/S X 3.3, LOQ= σ/S X 10 for the component sitagliptin and simvastatin (Table 6). Robustness The robustness of the method was determined as a measure of the analytical method capability to be unaffected by small variations in method parameters. The different variations such as variation in flow rate by ± 0.2 ml/minute, variation in wavelength by ± 2 nm. At these changed conditions, the standard solutions were injected. The amounts of sitagluptin and simvastatin were calculated (% assay) in each varied condition. (Table7) Forced degradation study To confirm the stability indicating nature of the analytical method, forced degradation of simvastatin and sitagliptin were carried out under acid/base hydrolytic, oxidative, photolytic and thermal stress conditions as per ICH recommended test conditions19The drugs were subjected to acid hydrolysis by using 0.1N hydrochloric acid for 6 hrs, base hydrolysis by using 0.1N sodium hydroxide solution for 6hrs, oxidation by using 3%v/v solution of hydrogen peroxide for 6hrs, thermal stress in a controlled- temperature oven at 60oC for 48hrs and photolytic stress using UV lamp for 48hrs. Table 1: Linearity data for SITA and SIM Linearity(n=5) Sitagliptin Simvastatin 40-400 10-50 Range (μg/ml) 0.987 0.992 Mean r2 value Regression Y=280.0+4155 Y=141.4quotation 4.214 Table 2: Analysis of formulation Labelled Amount amount(mg) found Sitagliptin 100 100.55 10 9.97 Simvastatin Drug. % amount 100.55 99.7. Table 3: System Suitability Data of STG and SMV Parameters Sitagliptin Simvastatin Retention time 3.46 4.75 1.49 1.38 Tailing factor Asymmetry 0.75 1 Theoretical plates 6412.44 7833.83 Resolution 6.61 Table 4: Recovery data of SITA and SIM Component Levels Mean recovery ±SD %RSD Sitagliptin L1 103.42% 0.54 0.52 101.78% 0.46 0.45 L2 L3 103.27% 0.51 0.49 Simvastatin L1 103.71% 048 0.46 99.75% 0.50 0.50 L2 L3 101.8% 0.42 0.42 Table 5: Intermediate precision data of STG and SMV Compound Compound(n=6) Intra-day Precision Inter-day Precision % RSD %of Label % RSD % of Label Sitagliptin 100.15 0.55 9.948 0.65 10.2 0.58 10.1 0.7 Simvastatin Table 6: LOD, LOQ data for sitagliptin and simvastatin LOQ(mcg/ml) LOD(mcg/mg) Component Sitagliptin 0.94 0.312 1.01 0.333 Simvastatin Factor Flow rate Wave length. Table 7: Robustness data of STG and SMV Level STG (n=3), Mean % SMV(n=3), Mean % assay (% RSD) assay (% RSD) 98.66%(0.92%) 99.18% (0.83%) 0.9ml/min 1.1ml/min 99.09% (0.95%) 99.78% (0.94%) 230nm. 99.2% (1.11%) 99.02% (0.92%) 98.94% (0.95%) 99.34% (0.91%) 240nm.. Page 124.
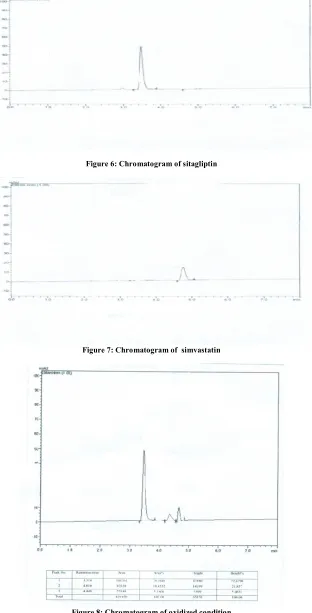
(3) Kavitha K.Y et al. IRJP 2012, 3 (12). Figure 2: Overlay Spectrum of Sitagliptin and Simvastatin. Figure 3. A typical chromatogram of sitagliptin(3.4 min) and simvastatin (4.7 min). Figure 4: Linearity curve for sitagliptin. Figure 5: Linearity curve for simvastatin. Page 125.
(4) Kavitha K.Y et al. IRJP 2012, 3 (12). Figure 6: Chromatogram of sitagliptin. Figure 7: Chromatogram of simvastatin. Figure 8: Chromatogram of oxidized condition. RESULTS AND DISCUSSION Method development Several mobile phase compositions were tried to resolve the peaks of sitagliptin, simvastatin and degraded components. The optimum mobile phase containing water and acetonitrile 20:80 (v/v) was selected because it could resolve the peaks of sitagliptin (Rt = 3.4 ± 0.02) and simvastatin (Rt = 4.7 ± 0.03) with a resolution factor of 6.6. Quantification was achieved with UV detection at 236 nm on the basis of peak area. A. typical HPLC chromatogram obtained during simultaneous estimation of sitagliptin and simvastatin. Method validation The proposed method was found to be accurate as the percentage recoveries at three levels 103.42%, 101.78%, 103.22 for STG and 103.71%, 99.75%, 101.8% for SMV respectively which were found to be within the limits of acceptance criteria (90- 110%). For precision and intermediate precision % RSD of STG and SMV were within Page 126.
(5) Kavitha K.Y et al. IRJP 2012, 3 (12) 2.0% thus they confirm good precision of the analytical method development. The method was found to be specific as there is no interference of the degraded components with the standard drugs. The LOD and LOQ of STG and SMV were found to be 3ng/ml, 9ng/ml and 0.09ng/ml,0.101ng/ml respectively. The calibration plot for the method was linear over the concentration range of 40-400μg/ml for STG and 1050μg/mL for SMV respectively. The correlation coefficients (r2) were 0.987 for STG and SMV respectively. Robustness of the method was performed by making deliberate changes in flow rate and wave length and by calculated % RSD values and was found within acceptance criteria range of 2.0%. Forced Degradation Forced degradation studies were carried out for the simultaneous estimation of sitagliptin and simvastatin in acidic/alkaline hydrolysis, oxidation, thermal and photolytic stress. The peaks of the degradation components were well resolved from the peaks of main component and the drug components passed the purity test. Results of forced degradation study depict that degradents appeared during oxidation stress study at retention time of 2.8min for sitagliptin and 4.4min for simvastatin respectively where as during the alkali hydrolysis simvastatin showed degradation at retention time of 4.4min. (Figure 7) CONCLUSION A simple, precise and accurate method was developed for the quantitative estimation of sitagliptin and simvastatin in bulk drug and marketed formulation without any interference from the excipients. The method is very simple and specific as both the peaks were well separated from their impurities and degraded components. The method has been found to be better than previously reported methods, because of use of a less economical and readily available mobile phase and lack of extraction procedures which makes the method especially suitable for routine quality control analysis work and biological fluids. REFERENCES 1.RamziaI.El-Bagary, EhabF.Elkady, Bassam M. Ayoub. Spectroflourometric and Spectrophotometric Methods for the Determination of Sitagliptin in Binary Mixture with Metformin and Ternary Mixture with Metformin and Sitagliptin Alkaline Degradation Product. International Journal of Biomedical Science 2011;7 Suppl 1 ;62-69 2 RP Dixit, CR Barhate, SG Padhye, CL Viswanathan, MS Nagarsenker.Stability indicating RP-HPLC method for simultaneous determination of simvastatin and ezetimibe from tablet Dosage form.Indian Journal of Pharmaceutical Sciences 2010; 7 Suppl 2: 204-210 3. Ghazala Khan, Dinesh Sahu, Y. P. Agrawal, NeetuSabarwal, Avnish Jain and A. K. Gupta. Simultaneous Estimation of Metformin and Sitagliptin In Tablet Dosage Form. Asian Journal of Biochemical and Pharmaceutical Research 2011; 1 Suppl 2: 353-358.. 4.Shyamala.M, Mohideen.S, Satyanarayana .T, Ch.NarasimhaRaju, Suresh Kumar.P, Swetha.K .Validated RP-HPLC for Simultaneous Estimation of Sitagliptin Phosphate and Metformin Hydrochloride in Tablet Dosage Form. American Journal of PharmaTech Research 2012; Suppl 1: 2249-3387. 5.Chellu S. N. Malleswararao, Mulukutla V. Suryanarayana 1, khaggamukkanti. Simultaneous Determination of Sitagliptin Phosphate Monohydrate and Metformin Hydrochloride in Tablets by a Validated UPLC method, ScientiaPharmaceutica, Sci Pharm. 2010;80 Suppl 1 :139-152 6. John G. Swale. Simultaneous quantitation of metformin and sitagliptin from mouse and human dried blood spots using laser diode thermal desorption tandem mass spectrometry. Journal of Pharmaceutical and Biomedical Analysis 2011; 6 Suppl 55: 544-551. 7. TamasSohajda,WenHui Hu, Li sLiZeng, Houg Li, LajosSzente, BelaNoszal, SzabolcsBeni. Evaluation of the interaction between sitagliptin and cyclodextrin derivatives by capillary electrophoresis and nuclear magnetic resonance spectroscopy. Wiley online Library, Vol. 32, Issue 19 8. Srivastava B., Akhtar J. and Baghel U.S.. Simultaneous estimation of ezetimibe and simvastatin by Vierodt’s method. International Journal of Pharmacy & Life Sciences, 1 Suppl 2:105-108. 9. P Bonde, S Sharma, N Kourav, A Attar, Development And Validated UV Spectrophotometric And RP-HPLC Methods For The Estimation Of Simvastatin And Ezetimibe In Combined Pharmaceutical Dosage Form. Inter J Curr Trends Sci Tech2010; 1 Suppl 3:135-142. 10. Nilesh Jain, Ruchi Jain, Hemant Swami and Deepak Kumar Jain. RPHPLC Method for Simultaneous Estimation of Simvastatin and Ezetimibe in Bulk Drug and its Combined Dosage Form.Asian J.Research Chem JulySept.2008;1:1.29-31 11. S Balaji And A Sunitha. Development And Validation Of Spectrophotometric Method For Simultaneous Determination Of Simvastatin And Ezetimibe In Tablet Formulations. Pak. J.Pharm.Sci October 2010; .23 Suppl 4: 375-378 12. N. M. Bhatia, D. D. Deshmukh, S. U. Kokil and M. S. Bhatia. Simultaneous Spectrophotometric Estimation of Simvastatin and Ezetimibe in Tablet Formulation.Indian J Pharm Sci 2006; 5 Suppl 3 68-69 13. VineetSingla, RadhikaBhaskar and Rahul Bhaskar. Simultaneous Estimation of Simvastatin and Metformin Hydrochloride in Bulk and Solid Dosage Forms. http://www.rasayanjournal.com2010;.3Suppl 3: 507-513 14. VarshaBalkrishna Mane, Surekha Babar, Nita Kulkarni. Development of UV Spectrophotometric method for the simultaneous estimation of Simvastatin and Ezetimibe in tablet dosage form by simultaneous Equation and Absorbance ratio method. International Journal of Pharma Tech Research July-sept 2011; 3 Suppl 3 pp 1459-466. 15. MujeeburRahman, GazalaParveen, N.K.Nyola, Shahroz Khan, SushmaTalegaonkar, M. Shaharyar and R.K.Khar. Simultaneous Estimation of Simvastatin and Ezetimibe in Pharmaceutical Tablet Dosage Forms by RP-HPLC: a review. International Journal of Pharma Research and Development – Online, Publication Ref No.: PRD/2010/Pub/Arti/Vov2/Issue-9/Nov/008 (Cited date – 1 -10-2012) 16. Chaudhari BG, Patel NM, Shah PB. Stability-indicating reversed-phase liquid chromatographic method for simultaneous determination of simvastatin and ezetimibe from Their coimbination drug products ,JAOAC Int 2007;20 Suppl 9 789-790 17. B.StephenRathinaraj, V.Rajamanickam, P.Joseph Mazarin Fiedlis, A. L. AshikElahi, Ch.Rajveer, D.Kumaraswamy. Development and validation of analytical methods for simultaneous estimation of simvastatin and ezetimibe in combined dosage form. Journal of Advanced Pharmaceutical Research 2010;1 Suppll 2 133-139 18 . ICH, “Validation of Analytical Procedures: Text and Methodology,” International Conference on Harmonisation Guidance Documents. Q2(R1) 2005. 19. ICH, Stability Testing, Q1A (R2), Stability Testing of New Drug Substances and Products. Feb 2003; 1-20.. Source of support: Nil, Conflict of interest: None Declared. IRJP is an official publication of Moksha Publishing House. Website: www.mokshaph.com. All rights reserved.. Page 127.
(6)
Figure
Related documents
The main purpose of this paper is to examine “vision” as one of the main components of change management for implementing technology-based changes in the Malaysian
Domain abbreviations and definitions: ankyrin repeats, tandemly repeated modules of about 33 amino acids; AT hook, DNA binding motif with a preference for A/T-rich regions; BAH,
In fact, all five strains genotyped as SIT149:A were drug resistant according to the line probe assay (Additional file 1 : Table S1), and four of these five strains were
Good dreams, unlike bad dreams, have different effects on both the dreamer and the hearers.. For one, the dreamer will naturally be
The frequencies of IgM-IB antibody reactivity to leptospiral antigens were determined with convalescent-phase sera of 74 leptospirosis patients and compared with the blood donor
For example, Kavikumar and Khamis [10] studied fuzzy ideals and fuzzy quasi- ideals in ternary semirings, Kavikumar, Khamis and Jun [11] studied fuzzy bi-ideals in ternary
The fitted parameters for the long-term outbreak in Hong Kong using parameter estimation Method 1 indicate that regular infected individuals move so quickly into isolation that we
The purposes of this study were three-fold: (1) to evaluate the default performance of existing state-of-the-art deep learning based dependency parsers on clinical text; (2) to
