Optimization of Atropine Extraction Process from
Atropa Belladonna
by Modified Bubble Column Extractor
with Ultrasonic Bath
Abbaspour, Akbar; Khadiv-Parsi, Parissa*
+School of Chemical Engineering, College of Engineering, University of Tehran, P.O. Box 11155-4563 Tehran, I.R. IRAN
Khalighi-Sigaroodi, Farahnaz; Ghafarzadegan, Reza
Medicinal Plants Research Center, Institute of Medicinal Plants, ACECR, P.O. Box 31375-369 Karaj I.R. IRAN
ABSTRACT: Modified Bubble Column Extraction with Ultrasonic Bath (BCE-UB) method was used to extract atropine from the stem and leaves of Atropa belladonna. Optimum condition were obtained with Kamada solvent which was chloroform-methanol-ammonia 15:15:1(v/v/v) as extraction solvent, the particle size of less than 350 µm, an extraction time of 23.95 min, a liquor to material ratio of 15.08 mL/g and an air flow of 6.31 mL/min.g. In this state, percent of extracted atropine was calculated which was equal to 6.81%. Percent of extracted atropine was 6.31% that showed a little difference compared to the predicted value. In order to study the effect of bubbles on the extraction rate, the same extraction with the previous method was performed in a stirred tank. Percent of atropine was 5.59%.
KEYWORDS: Atropine; Bubble column extraction; Uniform design; UV-Visible spectroscopy; Atropa belladonna.
INTRODUCTION
Tropane alkaloids are a group of alkaloids and secondary metabolites which are widely used in medicine for their analgesic, anticholinergic, mydriatic, antispasmodic and antimuscarinic (parasympathetic inhibition) action. They are commonly found in plants of four families, named, Solanaceae, Erythtroxylaceae, Proteaceae and Convolvulaceae [1-4]. Solanaceae is a family of flowering plants that consist of some important agricultural crops, although many species are toxic plants.
Many members of the Solanaceae family are used by human, and are important sources of food, spice and medicine [5]. Atropa belladonna belongs to the solanaceae family and the plant is a good source of Tropane alkaloids. Atropine is the main tropane alkaloids (usually the most plentiful) in Atropa belladonna, which results from racemization of (-)-hyoscyamine during the extraction process [6,7]. Atropine is well known as hallucinogenic and for its specific properties
*To whom correspondence should be addressed. +E-mail: [email protected]
(mydriatic and muscarinic antagonist) and has been used for the cure of various illnesses such as Parkinson, gastrointestinal, parturition and cardiopathy diseases [8,9].
Many extraction methods including microwave-assisted extraction, pressurized solvent extraction, solid-phase microextraction, and supercritical fluid extraction were once reported to extract atropine from Solanaceae plants [10]. All of these methods have some limitations such as cost, availability, high extraction time and low yield. The selection of extraction method depends on the active ingredients in the plants and the type of plant tissue. Usually, there are two kinds of limitations to improve the extraction rate. The extraction of active ingredients from plant cell to the surface is the first limitation and the extraction of the active ingredients from solid surface to solvent is the second one [11]. Seidi & Yamini [12] discussed in details the effect of ultrasonic waves on the plant cells. However, it can be briefly said that, the ultrasonic waves can increase the vibration of the cell, or even, break it down. This effect suggests that the ultrasonic waves can improve the extraction rate in an extraction process through overcoming the first limitation mentioned above.
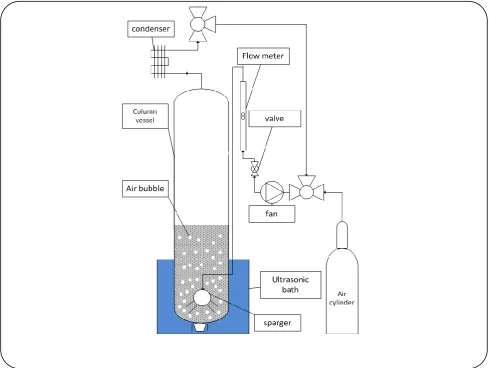
A bubble column extractor is basically a cylinder-shaped vessel with a gas sparger at the lower part of the vessel. The gas is sparged in the form of bubbles into either a liquid phase or a liquid–solid suspension [13]. Currently, bubble columns have been extensively used for extraction of natural products [14,15]. In this device, bubbles were injected into liquid–solid system (made of the extraction solvent and plant material) to increase mass transfer rate [16-18]. Therefore, a modified bubble column extractor with ultrasonic bath may be a good choice, to overcome both aforementioned limitations.
It is noticeable to mention that, the contact area of particle-solvent is increased by reducing the particle size, and therefore enhances the extraction rate. However, when the particle size is lower than a limiting value, even if there is ultrasonic wave, a phenomenon called conglomeration causes to reverse the results [19]. Therefore, the particle size is an important parameter that must be optimized in the extraction process. One of the most important advantages of the bubble column extraction device is that the turbulence created by the bubbles increases the extraction rate and also the destruction of the local conglomerates. As a result,
in a bubble column extraction device the particle size can be reduced to the smallest possible condition to increase the extraction rate.
In this respect, a bubble column extractor coupled with ultrasonic bath was designed and used to extract atropine from Atropa belladonna in this work. The effects of various extraction parameters such as extraction solvent, particle size, extraction time, liquor to material ratio, temperature and air flow were investigated on the extraction yields of atropine.
Different methods have been reported to measure the amount of atropine such as Gas Chromatography (GC), high performance liquid chromatography (HPLC) and Capillary Electrophoresis (CE) [20-24]. In this study Gas Chromatography (GC–FID) was used for qualitative analysis and UV-Visible spectroscopy was used for quantitative analysis of atropine that was more economical respect to the others. This method is based on measuring the amount of light that a sample (liquid and sometimes gas) absorbs in particular wavelength. Chloranilic acid reagent was used to create color with atropine [25-27]. Finally, the total amount of atropine was obtained per gram of powdered plant.
EXPERIMENTAL SECTION
Equipment
BCE device: bubble column extractor (made in the laboratory)
Fig. 1: Bubble column extractor coupled with ultrasonic bath; BCE- UB.
in the first and the third intervals and turned off in the second and the fourth intervals.
Ultrasound device
Ultrasound device was applied for the experiments, made in Germany, model of LC130H operated with frequency of 35 MHz. Because, in this frequency there is enough time for entering the bubbles into the cell wall structure and disturbing order of it.
Gas chromatography
as Chromatography (GC-FID) was used for qualitative analysis of extracted atropine. Capillary GC carried out using a Younglin Acm 6000 GC with HP-5(30m×0.25mm×0.25µm) column. Oven temperature was performed as follows: 50 ° C for 5 min and then heated to 240 ° C with a rate of 3° C/min; finally heated to 300 °C
with a rate of 15° C/min and kept constant at 300° C for 3 min.; injector temperature 290° C; helium as the carrier gas with 0.8 milliliters per minute flow rate and a flame ionization detector. Quantitative data were obtained from FID area percentage data. The calculations were based on Area [mV×s][28].
Spectrophotometer UV–visible
Spectrophotometer UV–visible that was used for the experiments, was made by Human Corporation Company from X-ma 2000 type.
Reagents and Materials
Doubled distilled deionized water was used in all experiments. Atropa belladonna plants were cultivated and collected (2012 B.C) in Institute of Medicinal Plants-ACECR, Karaj, Iran. Plant materials were dried in shadow before extraction and analysis.
Extraction Procedure
Preparation of Plant for Extraction
The impurities and the pebbles were separated from the plant. It was placed in the shade for several days. Then, the leaves and the stems were separated from each other and after that were powdered separately. Leaves and stems of 5 samples were weighted to find the actual leave to stem weight ratio of plant materials. It was found that there was an about 1 to 1 ratio for the weight of leave to stem in the selected individual plants; and therefore, we prepared the samples with 1 to 1 weight ratio of leave to stem, in all experiments. The prepared samples were screened with the specified mesh sizes of 18, 30 and 45. Finally, the prepared samples with an equal leave to stem weight ratio and mesh sizes of 18, 30 and 45 were used separately to extract the Atropa belladonna.
Selection of Parameters
Many parameters can affect the extraction of the active ingredients from plants according to the type of plant and the extraction method. A number of them were selected as the most effective parameters according to the requirements and operational conditions and limitations of facilities. After the evaluation of these parameters, the ones that had the greatest effect on the rate of extraction were selected for optimization and other parameters were fixed at their best conditions. On the basis of primary tests and laboratory facilities, two experimental factors, namely, extraction solvent (Kamada solvent) and particle size of powdered plants (less than 354µm) were kept constant in all experiments. Extraction time (X1), liquor to material ratio (X2) and air flow (X3) were used as factors (independent variables) and the extraction yield of atropine (Y) was used as response variable.
Extraction by Stirred Tank Extractor coupled with the Ultrasonic Bath (STE-UB)
Another Extraction was designed to study the effect
of the bubbling. In this respect, the solvent and the powdered plant were added to the flask which is attached to a condenser and were stirred with the rate of 2400 rpm. This process was carried out with ultrasonic bath in optimal condition that was used in pervious method.
Extraction by Soxhlet extractor
For this part, a conventional Soxhlet extraction was used. An amount of 10g of powdered plant was prepared and placed inside the Soxhlet extractor, on the top of a round-bottom flask filled with 150 mL of solvent. The system was boiled using a bath boiler. This experiment was performed in three different times of 0.5h, 12h, and 6h. After filtration, the extract was maintained in 10mL flasks prior to UV-Visible spectroscopy analysis.
Experimental Design
The uniform design of experiments is a class of space filling design from number theory, developed by Fang & Wang [29]. This technique has been successful in many different fields such as chemical engineering and applied chemistry. In addition, the experimental design based on uniformity in comparison with other experimental methods like orthogonal design, factorial design, Box-Behnken design and response surface method [30-32] significantly reduces the number of experiments, and it is an appropriate method to study the unknown model of multi-level and multifactor [33]. In our work, a uniform design was used to design the extraction model for extraction of the atropine from Atropa belladonna plants based on regression analysis to predict the best extraction condition.
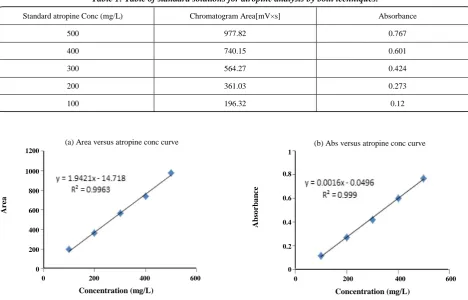
Table 1: Table of standard solutions for atropine analysis by both techniques.
Standard atropine Conc (mg/L) Chromatogram Area[mV×s] Absorbance
500 977.82 0.767
400 740.15 0.601
300 564.27 0.424
200 361.03 0.273
100 196.32 0.12
Fig. 2: Standard curves for atropine analysis techniques (a) GC-FID (b) UV-Visible.
Analysis
Qualitative analysis by GC–FID
Gas Chromatography (GC–FID) was used for qualitative analysis of extracted atropine. Comparison between GC-FID results for the standard solution of atropine and test solution confirmed the presence of atropine in the test solution of Atropa belladonna L.
Quantitative analysis using spectrophotometry
The complexometeric UV-visible spectroscopy was used for quantitative analysis of extracted atropine. This method is based on measuring of the amount of light that a sample of liquid and gas (some times) absorbs in a particular wave length. Chloranilic acid reagent was used to create color with atropine. Finally, the total concentration of atropine was obtained per gram of powdered plant. The accuracy of the spectrophotometric analysis was also confirmed by comparing the results of this method with the results of GC-FID. Based on these results, it can be concluded that the accuracy of UV–Visible spectroscopy is good compared to the GC-FID standard method.
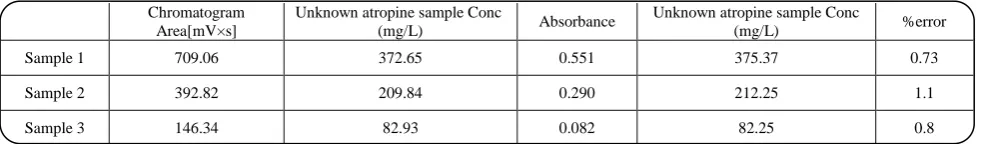
For this purpose, 5 different concentrations of atropine standard solution were prepared (Table 1) and then standard curves were plotted by both techniques, GC-FID and UV–Visible spectroscopy (Fig. 2). It is important to emphasize that each experiment was repeated three times to ensure accuracy and precision. Three similar test solutions were prepared using same extraction method. Then, one of the test solutions was diluted twice and the other was diluted four times. These solutions were measured by both techniques. Results are listed in Table 2. According to the results, comparison of GC-FID with UV–Visible spectroscopy showed that the error is less than one percent.
Preparation of extracted solution after running the experiments
After the system was established in specified conditions, plant and extract were conducted to the bottom valve and filtered. Then, the extract was dried in a rotary evaporator.
The residue was dissolved in 25 mL of CHCl3 and 25 mL of 1 N sulfuric acid and mixed thoroughly. Aqueous
0 200 400 600 1200
1000 800 600 400 200 0
(a) Area versus atropine conc curve
0 200 400 600 1
0.8 0.6 0.4 0.2 0
(b) Abs versus atropine conc curve
Concentration (mg/L)
A
b
so
rb
a
n
ce
Concentration (mg/L)
Ar
Table 2: Table of unknown solutions for atropine analysis by both techniques.
Chromatogram Area[mV×s]
Unknown atropine sample Conc
(mg/L) Absorbance
Unknown atropine sample Conc
(mg/L) %error
Sample 1 709.06 372.65 0.551 375.37 0.73
Sample 2 392.82 209.84 0.290 212.25 1.1
Sample 3 146.34 82.93 0.082 82.25 0.8
solution was separated from the CHCl3 rich phase, and was basified (i.e. about pH=10) using 25% ammonium hydroxide.
Alkaloids were extracted once with 10 mL of CHCl3 and twice with 5 mL of chloroform. After the addition of anhydrous Na2SO4, the organic solution was filtered to 100 mL flask. The solvent was removed by vacuum evaporation at 40°C and residue was dissolved in appropriate volume (10 mL) of methanol [36,37]. This solution is the unknown solution for the next experiments.
Spectrophotometry of Atropine –Chloranilic Acid Complex
The complexometeric UV-visible spectroscopy was used for quantitative analysis of extracted atropine. The extracted atropine was reacted with chloranilic acid to form a dye complex. The 0.005 M stock solution of chloranilic acid in methanol was used in all experiments. Also, 10 mL of 1000 µg/L standard atropine solution was prepared with methanol.
1.5 mL of stock solution of chloranilic acid in methanol was added to six 5 mL volumetric flasks and then 0.0, 0.5, 1.0, 1.5, 2.0 and 2.5 mliliters of atropine standard solution were added to each of them, separately. All flasks were brought to volume. The first solution was a blank solution and the others were considered as the standard solution. The absorbance of the mentioned solutions was measured by UV-Visible spectrophotometer in λmax=530 nm and the standard curve were plotted (Fig. 2).
RESULTS AND DISCUSSION
Atropine Identification by GC-FID
The GC-FID results confirmed the presence of atropine in the Atropa belladonna L. sample. Fig. 2 shows the chromatogram of atropine stock standard solution and unknown solution together obtained by GC-FID method (Fig. 3). 10 mL of 1000 µg/L standard atropine solution was prepared with methanol and was injected into
the GC device that was removed from the column at Retention time= 7.87. Another sample was extracted from the plant and it was injected into the GC device. As a result, Obtained two peaks were similar that showed the presence of atropine in the Atropa belladonna L. sample.
Quantitative Analysis by Spectrophotometry of Atropine-Chloranilic Acid Complex
The complexometeric UV-visible spectroscopy was used for quantitative analysis of extracted atropine. 5 mL of the prepared unknown solution entered to 10 mL flasks and 3 mL of stock solution of chloranilic acid was added to it. The volume of the solution was reached to 5 mL by adding methanol, and the absorbance was measured using UV-visible spectrophotometer in λmax=530nm. The concentration of the unknown solution was determined using the prepared standard curve. The obtained results are reported in Table 1.
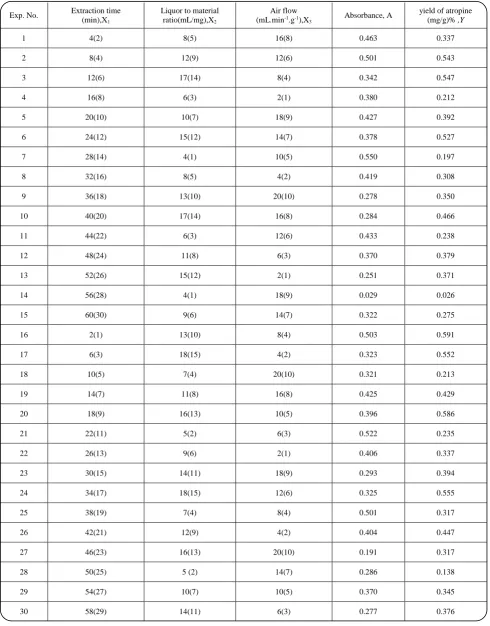
Effect of Extraction Time, Liquor to Material Ratio and Air Flow
On the basis of primary tests and laboratory facilities, two experimental factors, namely, extraction solvent (Kamada solvent) and particle size of powdered plants (less than 354µm) were kept constant in all experiments. Extraction time (X1), liquor to material ratio (X2) and air flow (X3) were used as factors (independent variables) and the extraction yield of atropine (Y) was used as response variable. The obtained results are reported in Table 3.
Different mathematical equations were used to reproduce the response against the independent factors. The best results were obtained when the following quadratic polynomial equation was used.
Num RT[min] Area[mV×s] Type With[s] Area% 1 7.8700 1877.5992 VP 18.0000 100
Num RT[min] Area[mV×s] Type With[s] Area% 1 4.1433 15346.904 BB 61.7000 69.469 2 5.1950 167.8892 VV 8.7000 0.7600 3 5.8233 215.3894 VP 21.8000 0.9750 4 6.3633 602.3728 VP 12.2000 2.7267 5 6.6033 217.9455 VP 13.5000 0.9866 6 6.9333 167.4987 VP 14.1000 0.7582 7 7.0283 209.4387 VP 9.4000 0.9480 8 7.3000 1052.7566 VP 12.8000 4.7654 9 7.8600 709.0632 VP 8.2000 3.2096 10 8.1467 904.9514 VP 12.5000 4.0964 11 8.8183 1628.3219 VV 20.5000 7.3708 12 8.9317 869.1013 VP 13.4000 3.9341
Sum 22091.633
Fig. 3: Chromatogram of standard solution of atropine versus solution extracted from the plants Atropa belladonna.
2 2 2
1 1 2 2 3 3 4 1 2
Y X X X X X (1)
5X X 1 3 6X X2 3 7X 1 8X2 9X 3 1
0
Where β1 to β10 are coefficients. The parameters of the
model were estimated by multiple regressions as follows (Table 4).
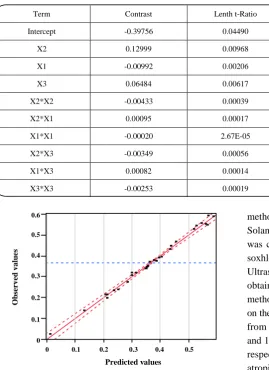
The goodness of this fitting was evaluated using the residual standard deviation and regression coefficient. Fig. 4 shows the observed values against predicted ones using Eq. (2).
Y -0.000199X120 00433. X220 00253. X32 (2)
. X X1 2 . X X1 3 . X X2 3
0 000945 0 000824 0 00349
. X1 . X2 . X3 .
0 00992 0 1300 0 06484 0 39756
It can be seen from this figure, that the correlation is the best (R2=0.9939). In addition, the statistical data of observed and predicted values revealed the residual standard deviation value is 0.0132. These results confirm that the numerical simulation is successful due to the goodness of the fitting between the observed and the predicted values. ANOVA results showed on the Table 5.
Moreover, Eq. (2) can be used to predict the response values in the experimental domain. The optimum extraction conditions were predicted by Eq. (2).
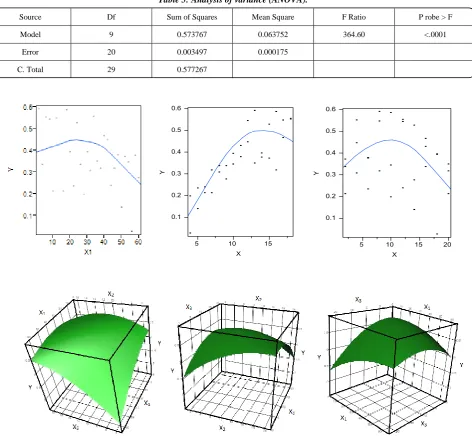
Based on the obtained results, it was found that the extraction rate increased with time of the process; however, after about 24 minutes the extraction rate was decreased. This observation might be referred to the evaporation of the solvent during the extraction process that decreased the available solvent for extraction; and subsequently the rate of extraction was decreased in long time periods.
Effect of liquor to material ratio was also studied and it was found that the extraction rate increased with increasing this factor to about 15g/mL and above this value, the extraction rate shows a steady and constant behavior. It seems that in this case the mass transfer to the solution was increased in the presence of the excess amount of solvent. However, the atropine content of the plant was limited and mass transfer reached its maximum condition which led to the constant behavior of the extraction rate. It should be noted that ultrasound waves was used in order to accelerate the penetration of atropine from plant cells to the surface of the powdered plants.
3.00 8.00 1000.0000
925.0000 850.0000 775.0000 700.0000 626.0000 552.0000 475.0000 400.0000 325.0000 250.0000
Time (min)
V
o
tt
.
(mV)
3.00 8.00
Time (min)
1000.0000 925.0000 850.0000 775.0000 700.0000 626.0000 552.0000 475.0000 400.0000 325.0000 250.0000
V
o
tt
.
Table 3: Results of uniform experimental design for the extraction of atropine.
yield of atropine (mg/g)% ,Y
Absorbance, A Air flow
(mL.min-1.g-1),X3 Liquor to material
Table 4: Parameter estimates.
Term Contrast Lenth t-Ratio Individual p-Value Simultaneous p-Value
Intercept -0.39756 0.04490 -8.85 <.0001
X2 0.12999 0.00968 13.49 <.00012
X1 -0.00992 0.00206 -4.82 <.0001
X3 0.06484 0.00617 10.51 0.0001
X2*X2 -0.00433 0.00039 -11.11 <.0001
X2*X1 0.00095 0.00017 5.45 0.0006
X1*X1 -0.00020 2.67E-05 -7.46 0.0759
X2*X3 -0.00349 0.00056 -6.24 0.8492
X1*X3 0.00082 0.00014 6.04 <.0001
X3*X3 -0.00253 0.00019 -13.80 <.0001
Fig. 4: Observed values vs. predicted values of atropine obtained from estimated model.
The optimum condition for the air flow was also found to be about 6.31 mL/min.g. On the one hand, it was obvious that increasing the air flow caused the increasing of the turbulence in the extraction system which resulted in the improvement of the extraction rate. On the other hand, the high values of the air flow resulted in the separation of the solid phase (the powdered plants) from the liquid phase (extraction solvent), and subsequently the extraction rate was reduced. Fig. 5 shows atropine concentration versus (X1) extraction time, (X2) liquor to material ratio and (X3) air flow and pairs of them versus (Y) yield.
Comparison of different extraction methods
There are several conventional methods to extract atropine from Solanaceae plants. In this research, another
method was introduced to extract atropine from Solanaceae plants. To evaluate the efficiency, this method was compared with other conventional methods such as soxhlet and Stirred Tank Extractor coupled with Ultrasonic Bath (STE-UB). Percent of atropine was obtained 5.59% from with ultrasonic bath (STE-UB) method. This result indicates that the effect of bubbles on the extraction rate is good. The average yield of atropine from soxhlet methods for extraction times of 0.5 h, 6.0 h and 12.0 h were 0.339 mg/g, 0.674 mg/g and 0.670 mg/g, respectively. Assuming that the average percentage of atropine obtained by soxhlet method was completed at relatively long time (6.0 h and 12.0 h had approximately equal efficiency), the efficiency of this method was 94%. It is important to stress that each experiment was repeated three times to ensure accuracy and precision.
CONCLUSIONS
Based on the results obtained from the Uniform Design (UD) method used in this work, it was found that the optimum conditions for the process is the extraction time of 23.95 min, the liquor to material ratio of 15.08 mL/g and an air flow rate of 6.31 mL/min.g. After determining this condition, experiments were carried out in the nearest and the most possible condition. In this respect, an experiment was performed in extraction time of 24 min, a liquor to material ratio of 15 mL/g and an air flow of 6 mL/min.g. Under these optimum conditions, the average yield of atropine for 3 independent experiments was 0.631 mg/g, which showed
0.6 0.5 0.4 0.3 0.2 0.1 0
0 0.1 0.2 0.3 0.4 0.5 0
Ob
ser
v
ed
v
a
lu
es
Predicted values
Table 5: Analysis of variance (ANOVA).
Source Df Sum of Squares Mean Square F Ratio P robe > F
Model 9 0.573767 0.063752 364.60 <.0001
Error 20 0.003497 0.000175
C. Total 29 0.577267
Fig. 5: Atropine concentration versus (X1) extraction time (X2) liquor to material ratio (X3)
air flow curves and pairs of them versus (Y) yield.
slight difference from the predicted value and therefore, the optimized results might be reliable.
In a similar condition, it was found that the percent of atropine which obtained by BCE-UB method was greater than STE-UB. These results showed that the bubbles might be increased the rate of extraction. Also, this method was fast and had a high extraction rate. Therefore, BCE is a fast and efficient method for the extraction of Atropine and other pharmaceutical
ingredients in the pilot and industrial scales of herbal products.
Acknowledgements
thesis entitled “Optimization of atropine and hyoscyamine tropane alkaloids extraction process from Atropa belladonna by bubble column extractor”.
Nomenclature
BCE-UB Bubble column extraction coupled with ultrasonic bath CE Capillary electrophoresis GC–FID Gas Chromatography–Flame Ionization Detector HPLC High performance liquid chromatography M Molarity MHz Megahertz N Normality R.S.D. Relative standard deviation STE-UB Stirred tank extractor coupled with ultrasonic bath UD Uniform design X1 Extraction time, min X2 Liquor to material ratio, mL/g X3 Air flow, L/min Y Extraction yield of atropine, mg/g βi Coefficients of the equation, i=1, 2, 3, 4, 5, 6, 7, 8, 9, 10 λmax The wavelength at which the absorption is at a maximum
Received : Jan. 27, 2015 ; Accepted : Mar. 1, 2016
REFERENCES
[1] Parr A.J., Payne J., Eagles J., Chapman B.T., Robins R.J., Rhodes M.J.C., Variation in Tropane Alkaloid Accumulation Within the Solanaceae and Strategies
for Its Exploitation, Phytochemistry, 29(8):
2545-2550 (1990).
[2] Georgiev M.I., Pavlov A.I, Bley T., Hairy root type Plant in Vitro Systems as Sources of Bioactive
Substances, Applied Microbiology and
Biotechnology, 74(6): 1175-1185 (2007).
[3] Djilani A., Legseir B., Extraction of Atropine by
Ultrasounds in Different Solvent Systems,
Fitoterapia, 76(2): 148-152 (2005).
[4] Tafaghodi M., Hasanzadeh khayyat M., Rahimizadeh M., Isolation and Identification of Hyoscyamus Insanus
Alkaloids, Journal of Medicinal Plants, 3(7):
29-36(2003) .
[5] Bown D.,“The Royal Horticultural Society
Encyclopedia of Herbs & Their Uses”, Dorling
Kindersley Limited, Wallingford (1995).
[6] Ashtiania F., Sefidkonb F., Tropane Alkaloids of Atropa Belladonna L. and Atropa acuminata Royle
ex Miers Plants, Journal of Medicinal Plants
Research., 5(29): 6515-6522 (2011).
[7] Dimitrov K., Metcheva D., Boyadzhiev L., Integrated Processes of Extraction and Liquid Membrane
Isolation of Atropine from Atropa Belladonna Roots,
Separation and Purification Technology, 46(1): 41-45 (2005).
[8] Manske R.H.F., Holmes H.L, The Alkaloids:
Chemistry and Physiology, The American Journal of
the Medical Sciences, 224(6): 705 (1952).
[9] Mortazavi F., Rakhshani M.H., The Effect of Atropine, Hyoscine and Promethazine on the duration of Labor Stages and Rate of Labor Progress
in Multiparous Women, Journal of Gorgan
University of Medical Sciences, 6(2): 92-96 (2004). [10] Fattorusso E., Taglialatela-Scafati O., “Modern
Alkaloids: Structure, Isolation, Synthesis, and
Biology”, John Wiley & Sons, Inc. (2008).
[11] Romdhane M., Gourdon C., Investigation in
Solid-Liquid Extraction: Influence of Ultrasound,
Chemical Engineering Journal, 87(1): 11-19 (2002). [12] Seidi S., Yamini Y., Analytical Sonochemistry; Developments, Applications, and Hyphenations of Ultrasound in Sample Preparation and Analytical
Techniques, Open Chemistry, 10(4): 938-976 (2012).
[13] Kantarci N., Borak F., Ulgen K.O., Bubble Column
Reactors, Process Biochemistry, 40(7): 2263-2283 (2005).
[14] Zhao C., Zu Y., Li C., Extraction of Solanesol from Tobacco (Nicotiana Tobaccum L.) Leaves by
Bubble Column, Chemical Engineering Processing:
Process Intensification, 48(1): 203-208 (2009). [15] Gourich B., Vial Ch., El Azher N., Ziyad M.,
Improvement of Oxygen Mass Transfer Estimation from Oxygen Concentration Measurements in Bubble
Column Reactors, Chemical Engineering Science,
61(18): 6218-6222 (2006).
[16] Essadki H., Delmas H., Svendsen H.F., Friction on a Solid Sphere Exposed to Liquid and Gas-Liquid-Solid Flow in Bubble Column and Fluidized
Bed Reactor, Journal of Chemical Technology and
[17] Stirba C., Hurt D.M, Turbulence in Falling Liquid
Films, AIChE J., 1(2): 178-184 (1955).
[18] Davarnejad R., Niza N.M., Arpanahzadeh Sh., Zakeri M., Supercritical Fluid Extraction of β-Carotene from Crude Palm Oil Using CO2 in
a Bubbler Extractor: Mass Transfer Study, Iranian
Journal of Chemistry and Chemical Engineering (IJCCE), 2014. 33(4): 79-87 (2014).
[19] Thompson D.C., “Fertiliser Caking and its prevention “Paper Read before the Fertiliser Society of London on 13th January 1972”, Proceedings / The
Fertiliser Society; no. 125. 1972, London: [s.n.]
(1972).
[20] Bahmanzadegan A., Sefidkon F., and Sonboli A., Determination of Hyoscyamine and Scopolamine in
Four Hyoscyamus Species from Iran, Iranian
Journal of Pharmaceutical Research, 8(1): 65-70 (2009).
[21] Boros B., Farkas A., Jakabova S.,Bacskay I., Kilar F.,Felinger A., LC-MS Quantitative Determination of Atropine and Scopolamine in the Floral Nectar of
Datura Species, Chromatographia, 71(1): 43-49 (2010).
[22] Yuan B., Zheng C.,Teng H.,You T., Simultaneous Determination of Atropine, Anisodamine, and Scopolamine in Plant Extract by Nonaqueous
Capillary Electrophoresis Coupled with
Electrochemiluminescence and Electrochemistry
Dual Detection, Journal of Chromatographia A,
1217(1): 171-174 (2010).
[23] Sarafraz Yazdi A., Stephen W.I., Comparative Gas Chromatography of Halides Using Different Substituted Phenylboronic Acids as Derivatizing
Reagents, Iranian Journal of Chemistry and Chemical
Engineering (IJCCE), 11(2): 29-34 (1992). [24] Drager B., Analysis of tropane and related alkaloids.
Journal of Chromatographia A, 978(1-2): 1-35 (2002).
[25] Dallali N., Agrawal Y., Solvent Extraction and Spectrophotometric Determination of Magnesium by
Paratoly 1-2-Thenohydroxamic Acid and
Quinalizarin, Iranian Journal of Chemistry and
Chemical Engineering (IJCCE), 23: 65-72 (2004). [26] Elsayed M.A.-H., Agarwal S.P., Spectrophotometric
Determination of Atropine, Pilocarpine and
Strychnine with Chloranilic Acid, Talanta, 29(6):
535-537 (1982).
[27] Mandal S., Naqvi A., Thakur R., A Spectrophotometric Method for the Quantitative Determination of
Tropane Alkaloids from Plant, Indian Journal of
Pharmaceutical Sciences, 52(5): 242-244 (1990). [28] Sedaghat S., Hajiaghaee R., Taghizad Farid D.,
Kadkhoda Z., Ghasemi S.V., Naghdibadi M.,Harriri F., Rezazadeh, Sh., Identification and Determination of Different Alkaloids from Atropa Belladonna L. by
Gas Chromatography Method, Journal of Herbal
Drugs (An International Journal on Medicinal Herbs), 2(3): 203-210 (2011).
[29] Liang Y.-Z., Fang K.-T, Xu Q.-S., Uniform Design and Its Applications in Chemistry and Chemical
Engineering, Chemometrics and Intelligent
Laboratory Systems, 58(1): 43-57 (2001).
[30] Wang H.-J., Pan M.-Ch., Chang Ch.-K., Chang Sh.-W., Hsieh Ch.-W., Optimization of Ultrasonic-Assisted Extraction of Cordycepin from Cordyceps militaris
Using Orthogonal Experimental Design, Molecules,
19(12): 20808-20820 (2014).
[31] Luo D., Optimization of total polysaccharide Extraction from Dioscorea Nipponica Makino Using
Response Surface Methodology and Uniform Design,
Carbohydrate Polymers, 90(1): 284-288 (2012). [32] Ghafarzadegan, R., Khadiv- Parsi P., Khalighi
Sigaroodi F., PirAli- Hamedani M., Kadkhoda Z., Rezazadeh Sh., Optimization of Extraction Method
of Hyoscine from Hyoscyamus niger L, Journal of
Medicinal Plants, 9(36): 87-95 (2010).
[33] Ryan T.P., “Introduction, in Modern Experimental
Design”, John Wiley & Sons, Inc. (2006).
[34] Foster D.P, George E.I, The Risk Inflation Criterion
for Multiple Regression, Annals of Statistics, 22:
1947- 1975 (1994).
[35] Fang K.-T., “Uniform Experimental Design, in
International Encyclopedia of Statistical Science”,
Lovric M., Ed., Springer Berlin, Heidelberg (2011). [36] Huie C.W., A Review of Modern Sample-Preparation
Techniques for the Extraction and Analysis of
Medicinal Plants, Analytical and Bioanalytical.
Chemistry, 373(1-2): 23-30 (2002).
[37] Jaber‐Vazdekis N.E., Gutierrez- Nicolas F., Ravelo A.G., Zarate R., Studies on Tropane Alkaloid Extraction by Volatile Organic Solvents:
Dichloromethane vs. Chloroform, Phytochemical