Access methods for Big Data: current status and future
directions
A N M Bazlur Rashid*
Assistant Professor (Computer), Department of Textile Machinery Design & Maintenance, Bangladesh University of Textiles, Dhaka – 1208, Bangladesh
Abstract
Heterogeneity, size, timeliness, difficulty & confidentiality problems with Big Data hinder advancement at all phases of the channel that can create value from data. Data analysis, organization, retrieval & modeling are initial challenges for Big Data. Data investigation is a clear traffic jam in many applications, both due to lack of scalability of the core algorithms and due to the difficulty of the data that needs to be analyzed. Despite this, the appearance of the results and its understanding by non-technical experts is vital to extracting actionable knowledge. To defeat these, there is a need for novel architectures, techniques, algorithms & analytics to deal with it as well as to retrieve the value and unseen knowledge. Further, we need to build up efficient and optimized access methods for countless reasons such as velocity of Big Data. In this article, we present a brief overview of the current status of access methods for Big data and discuss a few promising research directions.
Keywords: access methods, analytics, big data, data mining, data science.
Received on 05 September 2017, accepted on 28 September 2017, published on 28 December 2017
Copyright © 2017A N M Bazlur Rashidet al., licensed to EAI. This is an open access article distributed under the terms of the Creative Commons Attribution licence (http://creativecommons.org/licenses/by/3.0/), which permits unlimited use, distribution and reproduction in any medium so long as the original work is properly cited.
doi: 10.4108/eai.28-12-2017.153520
*Corresponding author. Email: [email protected]
1. Introduction
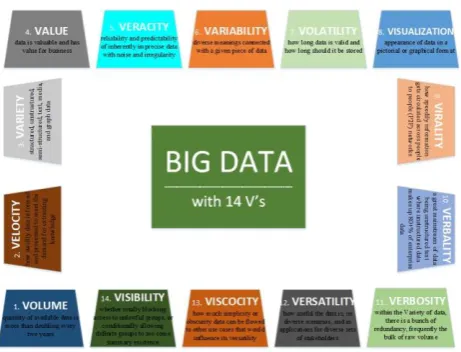
The term “Big Data” has newly been functional to datasets that nurture so big that they become uncomfortable to work with using conventional database management systems. They are data sets whose size is ahead of the ability of generally used software tools and storage systems to capture, store, manage, as well as process the data within a reasonable elapsed time [1]. Big Data is a well-liked term used to explain the exponential escalation and availability of data, both structured and unstructured. In 2001, Doug Laney (currently with Gartner) an industry analyst uttered the now mainstream definition of Big Data with three V’s: volume, velocity, and variety [2]. Data size in the range of Petabytes, Exabytes and even more is estimated that the quantity of available data (volume) is more than doubling every two years [3]. Velocity states both on how swiftly data is being formed and how rapidly the data must be processed to meet up the demand for extracting
knowledge. In order to dig out knowledge, diverse types of data (i.e., the variety of structured, unstructured, semi-structured, text, media, and graph data) require being related together. Another V was introduced by Gamble and colleagues and it links with the value and indicates if the data is valuable and has value for business [4]. A number of other views have been mentioned in the literature, such as Veracity relating to deal with the reliability and predictability of inherently imprecise data with noise and irregularity; Variability signifying the diverse meanings connected with a given piece of data; and Volatility addressing the difficulty of how long data is valid and how long should it be stored or is it no longer relevant to the present analysis and decisions.
Figure 1: Big Data technology with 14 V’s
The industry has started to be thankful for that management and analysis of Big Data nowadays also involve upfront cognizance of its verbality, verbosity, versatility, viscosity, and visibility [5].
Verbality indicates to a great mainstream of data being unstructured text where unstructured data makes up 80+% of enterprise data. News, internal emails, call recordings, research reports, presentation decks, customer communications, patents, social media content, and documents of all kinds are extremely related to any organization as data.
Verbosity is that within the unstructured, the semi-structured, and in structured data, there is a bunch of redundancy, a frequently bulk of the raw volume. Understanding how to hurriedly unscramble the meaning anybody cares about from its redundancies is vital for the efficiency of processing, but yet more significant for supporting the value and versatility dimensions, the recycle, of the data.
Versatility of data reflects how useful the data is, in diverse scenarios, and in applications for diverse sets of stakeholders, even though invariably having been created for a definite reason. Understanding its quality, origin, meaning, and context is a key to this.
Viscosity is with how much simplicity or obscurity data can flow to other use cases that would influence its versatility. Highly viscous data has a lot of internal friction stemming from customized, though hopefully internally consistent, representations that, at a minimum, require high-touch explanation, conversion, and integration.
Visibility of data is the access control about it, whether totally blocking access to unlawful groups, or conditionally allowing definite groups to see some summary existence or explanation of the data without revealing its sensitive facts. This latter empowers self-service breakthrough of data sets by groups who can then ask for access to suitable governance channels.
Big Data sizes are continually rising, at present ranging from a few dozen terabytes (TB) to many petabytes (PB) of data in a single dataset. Subsequently, some of the complications linked to Big Data include capture, storage, search, sharing, analytics, and visualizing. Today, enterprises are exploring huge volumes of highly detailed data so as to find out facts they didn’t be familiar with before [6].
The inclination to big data sets is due to and should profit from the extra information derivable from analysis of a single large set of associated data, as compared to detach minor sets with the identical total amount of data, allowing correlations to be found to spot business trends, decide quality of research, put off diseases, connect legal citations, fight crime, improve production and logistics, decide real-time roadway traffic conditions, and limitless other applications [7].
Therefore, Big Data analytics is where improved analytic techniques are functional on Big Data sets. Analytics based on huge data samples reveals and leverages business change. On the other hand, the greater the set of data, the additional complicated it becomes to deal with. The rest of the paper has been organized in the following order. Section 2 presents a literature review of previous relevant research; section 3 provides challenges and opportunities with Big Data; future research directions have been included in section 4; section 5 includes proposed methodologies of efficient and optimized access methods for Big Data; finally, section 6 ends with the concluding remarks.
2. Literature review
The organization of data can be grouped into 3 types: structured, semi-structured and unstructured data [8].
(i) Structured data: consists of text, numbers, strings, dates and Relational data (row column schema). (ii) Semi-structured data: may be irregular or
incomplete. It combines data from multiple sources with related properties and generally has some structure but does not conform to a specific schema akin to in structured data. XML documents are the instance of semi-structured data.
(iii) Unstructured data: can be textual and non-textual form. Textual data contain data from the web resembling emails, blogs, power point presentation etc. and non-textual data consists of audio, video files JPEG and MP3 files.
With the development of technology and the increased multitudes of data flowing in and out of organizations daily, there has become a call for faster and more efficient ways of analyzing such data. Having plenty of data on hand is no longer enough to make efficient decisions at the accurate time.
Such data sets can no longer be easily analyzed with conventional data management and analysis techniques and infrastructures. Therefore, there arises a requirement for new tools and methods dedicated to Big Data analytics, as well as the required architectures for storing and managing such data. Accordingly, the appearance of Big Data has an effect on everything from the data itself and its collection, to the processing, to the final extracted decisions.
Figure 2: Definitions of Big Data based on an online survey of 154 global executives in April 2012 [10]
Consequently, the Big – Data, Analytics, and Decisions (B-DAD) framework proposed by Elgendy [11] and it incorporates the Big Data analytics tools and methods into the decision-making process. The diverse Big Data storage, management, and processing tools, analytics tools and methods, and visualization and evaluation tools are mapped by the framework to the diverse phases of the decision-making process. Hence, the changes linked with Big Data analytics are reflected in three main areas: Big Data storage and architecture, data and analytics processing, and, ultimately, the Big Data analysis which can be functional for knowledge discovery and informed decision-making.
Conversely, since Big Data is still developing as a significant field of research and new findings and tools are regularly developing [12].
2.1. Big Data research area
There are numerous challenges with Big Data together with how to capture, curate, store, search, share, transfer, analyze, and visualize the data [13]. A few other challenges that generate research opportunities are:
(i) Improving data analytic techniques: Collect all data filter them out on definite constraints and utilize them to take confidential decisions.
(ii) Natural language processing methods: New processing techniques on Big Data to discover out the present sentimental trend that can be employed in business, politics, finance etc.
(iii) Big Data tools and deployment platforms: Traditional tools are incompetent to handle Big Data, new tools can be developed especially information retrieval tools for efficient data searching.
(iv) Better data mining techniques: Data mining is a process to discover patterns and trends from a big quantity of data. Enhanced distributed crawling techniques and algorithms are needed for scrape data from manifold platforms.
(v) Improvements in data visualization: Visualization leverages the human visual system to augment human intellect. In order to visualize the necessary information from a large figure of data, powerful algorithms are vital for a perfect result.
(vi) Data fusion and aggregation: The data sensed from dissimilar platforms especially from wireless sensor networks must be aggregated or summarized at intermediate sensor nodes by using appropriate data fusion mechanisms. These data collecting techniques must be energy efficient and balance load amongst diverse sensor nodes. Data fusion is not only cooperative in avoiding data redundancy at the base station, but also to trim down data transmission. (vii) New metadata structure: Metadata can significantly
streamline and improve processes to gather, integrate, and analyze Big Data sources. Innovative or enhanced metadata structure is required to decrease access to storage and to manage metadata. (viii) Security and privacy issues: The Big Data safety
measures objectives are no different from any other data types - to conserve its confidentiality, integrity, and availability.
(ix) Fraud detection: In a world where transactions and documents are digitally recorded in one way or another, the proof is out there to assist investigators in the clash against harmful fraudulent schemes. The more complicated question is "how to simply and rapidly find that proof?"
(x) Sentiment analysis: Sentiment analysis is the procedure of using text analytics to mine for opinions of a variety of sources of data e.g., social media, mobile devices, and web browsers. Efficient Big Data technology is essential to manage the diverse sources and diverse formats of such structured and unstructured data.
2.2. Big Data analytic processing
make use of OLAP, BPM, Mining and database systems like RDBMS.
In the 1980s, artificial intelligence-based algorithms were evolved for data mining. Wu et al. [14] mention the ten most leading data mining algorithms k-means, C4.5, Apriori, Expectation Maximization (EM), PageRank, SVM (support vector machine), AdaBoost, CART, ave Bayes and kNN (k-nearest neighbors). The majority of these algorithms have been utilized commercially as well. Alam and Shakil [15] proposed an architecture for management of data through cloud techniques [16].
A lot of platforms for large-scale processing have tried to meet the challenges of Big Data in the last years [17]. These platforms attempt to carry closer the distributed technologies to the benchmark user (engineers and data scientists) by hiding the technical difficulties derived from distributed environments. Complex designs are mandatory to construct and uphold these platforms, which generalizes the exercise of distributed computing. However, Big Data platforms also entail additional algorithms that offer support to appropriate tasks, like Big Data pre-processing and analytics. Standard algorithms for those tasks should be also re-designed (sometimes, entirely) if we want to study from large-scale datasets. It is not an insignificant thing and presents a big challenge for researchers.
The first framework that enabled the processing of large-scale datasets was MapReduce [18]. This revolutionary tool was planned to process and create huge datasets in an automatic and distributed way. By implementing two primitives, Map and Reduce, the user is capable to make use of a scalable and distributed tool devoid of worrying about technical nuances, such as failure recovery, data partitioning or job communication. Apache Hadoop [19, 20] came up as the most popular open-source implementation of MapReduce, maintaining the aforesaid features. Despite its great reputation, MapReduce (and Hadoop) is not designed to scale well when handling with iterative and online processes, typical in machine learning and stream analytics [21].
Apache Spark [22, 23] was intended as a substitute to Hadoop, accomplished of performing quicker distributed computing by using in-memory primitives. Having the capacity of loading data into memory and re-using it over and over again, this tool overcomes the trouble of iterative and online processing presented by MapReduce. Furthermore, Spark is a universal intention framework that it allows to executing several distributed programming models on top of it (e.g., Pregel or Hadoop) [24]. Spark is developed on top of a fresh abstraction model called Resilient Distributed Datasets (RDDs) which model permits controlling the persistence and managing the partitioning of data, among other characteristics.
A few competitors to Apache Spark have come up lastly, especially from the streaming side [25]. Apache Storm [26] is an open-source distributed real-time processing platform, which is proficient of processing millions of tuples per second and node in a fault-tolerant
way. Apache Flink [27] is a hot top-level Apache project designed for distributed stream and batch data processing. The gap left by Spark, which uses a mini-batch streaming processing unlike a pure streaming approach is tried by both alternatives to fill the “online”.
The performance and quality of the knowledge retrieved by a data mining method in any framework do not only depends on the design and performance of the method but is also very reliant on the quality and suitability of such data. Regrettably, negative factors as noise, missing values, inconsistent and superfluous data and huge sizes in instances and characteristics highly persuade the data used to study and pull out knowledge.
Low-quality data will guide to low-quality knowledge [28]. Accordingly, data pre-processing [29] is a most important and vital stage whose main ambition is to gain final data sets which can be considered correct and useful for additional data mining algorithms.
Big Data also undergo of the aforesaid negative factors. Big Data pre-processing involves a challenging task, as the former approaches cannot be straight useful as the scale of the data sets or data streams make them unworkable [29].
2.3. Big Data analytic tools
Data management includes processes and following technologies to obtain and store data and to get ready and get back it for analysis. Analytics, however, means to techniques used to analyze and get intelligence from big data. In consequence, big data analytics can be viewed as a sub-process of the whole process of ‘insight extraction’ from Big Data.
In the following sub-sub-sections, a brief review of Big Data analytical techniques for structured and unstructured data has given [10].
Text analytics
. Text analytics (text mining) are techniques that retrieved information from textual data. Social network feeds, emails, blogs, online forums, survey responses, corporate documents, news, and call centre logs are lot of instances of textual data held by organizations. Text analytics engage statistical analysis, computational linguistics, and machine learning. Text analytics make possible businesses to change huge volumes of human-generated text into important summaries, which hold up evidence-based decision-making [30]. Text analytics methods are: Text summarization techniques without human intervention generate a concise summary of a single or multiple documents. The resultant summary conveys the vital information in the original text(s). Generally, summarization incurs two approaches: the extractive approach and the abstractive approach. In extractive summarization, a summary is formed from the original text units (typically sentences). The consequential summary is a subset of the original document. Depending on the extractive approach, constructing a summary includes measuring the outstanding units of a text and stringing them together. The significance of the text units is evaluated by analyzing their location and frequency in the text. Extractive summarization techniques do not need an ‘interpretation’ of the text. On the other hand, abstractive summarization techniques occupy extracting semantic information from the text. The summaries hold text units that are not necessarily there in the original text. To parse the original text and create the summary, abstractive summarization involves advanced Natural Language Processing (NLP) techniques. Hence, abstractive systems lean to produce extra coherent summaries than the extractive systems do [32)]. But, extractive systems are easier to take on, especially for big data.
Question answering (QA) techniques supply answers to questions posed in natural language. Akin to abstractive summarization, QA systems depend on complex NLP techniques. QA techniques are additionally grouped into three types: the information retrieval (IR)-based approach, the knowledge-based approach, and the hybrid approach. IR-based QA systems frequently have three sub-components. The initial one is the question processing which is used for measuring details, for instance, the question type, question focus, and the answer type, which are used to create a query. Next one is document processing used to extract associated pre-written passages from a set of existing documents incorporating the query formulated in question processing. The third one is answer processing used to find out candidate answers from the output of the previous component, rank them, and return the highest-ranked candidate as the output of the QA system. Knowledge-based QA systems produce a semantic description of the question, which is then utilized to query structured resources. The Knowledge-based QA systems are specifically helpful for restricted domains, such as tourism, medicine, and transportation, where big volumes of pre-written documents do not exist. Such domains lack data redundancy, which is necessary for IR-based QA systems. In hybrid QA systems, similar to IBM’s Watson, while the question is semantically analyzed, candidate answers are produced using the IR methods.
Sentiment analysis (opinion mining) techniques analyze opinionated text consisting people’s opinions toward entities for example products, organizations,
individuals, and events. Businesses are progressively capturing extra data about their customers’ sentiments that has led to the propagation of sentiment analysis [33]. Sentiment analysis techniques are additionally split into three sub-categories: document-level, sentence-level, and aspect-based. Document-level techniques decide whether the whole document describes a negative or a positive sentiment. The hypothesis is that the document consists of sentiments regarding a single entity. Whilst definite techniques group a document into two types, negative and positive, others include further sentiment classes (e.g., the Amazon’s five-star system) [34]. Sentence-level techniques try to settle on the polarity of a single sentiment in relation to a known entity uttered in a single sentence. Sentence-level techniques have to first differentiate subjective sentences from objective ones. Therefore, sentence-level techniques lean to be further complex in comparison to document-level techniques. Aspect-based techniques identify all sentiments inside a document and recognize the aspects of the entity to which each sentiment refers. A good example is customer product reviews usually hold opinions concerning different aspects (or characteristics) of a product. The vendor can acquire precious information about diverse characteristics of the product that would be missed if the sentiment is only grouped in terms of polarity using aspect-based techniques.
Audio analytics
. Audio analytics analyze and pull out information from unstructured audio data. When functional to human spoken language, audio analytics is however referred to as speech analytics. Whilst these techniques have mainly been applied to spoken audio, the terms audio analytics and speech analytics are frequently used interchangeably. Moreover, automated call centres employ the Interactive Voice Response (IVR) platforms to recognize and manage frustrated callers. In healthcare, audio analytics carry diagnosis and treatment of definite medical conditions that influence the patient’s communication patterns (e.g., depression, schizophrenia, and cancer) [35]. Speech analytics has two common technological approaches: the transcript-based approach (widely known as large-vocabulary continuous speech recognition, LVCSR) and the phonetic-based approach.text-based methods are used to discover the search term in the index file.
Phonetic-based systems employ with sounds or phonemes. Phonemes are the perceptually separate units of sound in a specified language that differentiates one word from another. Phonetic-based systems also contain of two phases: phonetic indexing and searching. In the first phase, the system translates the input speech into a series of phonemes. This is in distinction to LVCSR systems where the speech is transformed into a series of words. In the second phase, the system searches the output of the first phase for the phonetic representation of the search terms.
Video analytics
. Video analytics, also known as video content analysis (VCA), includes a range of techniques to monitor, analyze, and extract meaningful information from video streams. The rising occurrence of closed-circuit television (CCTV) cameras and the booming attractiveness of video-sharing websites are the two leading contributors to the expansion of computerized video analysis. A vital challenge, on the other hand, is the absolute size of video data. To place this into perception, one second of a high-definition video, in terms of size, is equivalent to over 2000 pages of text [36]. Big data technologies go round this challenge into an opportunity. The data generated by CCTV cameras in retail outlets can be retrieved for business intelligence. Marketing and operations management are the primary application areas while potential application of video analytics in retail lies in the study of purchasing behaviour of groups. Automatic video indexing and extraction constitutes another area of video analytics applications. The well-known appearance of online and offline videos has highlighted the call for to index multimedia content for simple search and retrieval. In provisions of the system architecture, there exist two approaches to video analytics, namely server-based and edge-based: Server-based architecture. In this approach, the video captured by each camera is trodden back to a centralized and dedicated server that performs the video analytics. For the reason of bandwidth limits, the video created by the source is typically packed in by plummeting the frame rates and/or the image resolution. The resultant loss of information can influence the correctness of the analysis. On the other hand, the server-based approach presents economies of scale and facilitates easier maintenance.
Edge-based architecture. Here, analytics are applied at the ‘edge’ of the system i.e., the video analytics is performed locally and on the raw data captured by the camera. Hence, the whole content of the video stream is accessible for the analysis, providing a more effective content analysis. Edge-based systems, on the other hand, are extra costly to uphold and
have a minor processing power compared to the server-based systems.
Social media analytics
. Social media analytics mean to the analysis of structured and unstructured data from social media channels. The research on social media analytics widens across a number of disciplines, as well as psychology, sociology, anthropology, computer science, mathematics, physics, and economics. Marketing has been the most important application of social media analytics in current years. Depending on this type, the social media analytics can be categorized into two groups:Content-based analytics relates to the data posted by users on social media platforms, for instance, customer feedback, product reviews, images, and videos. Such content on social media is frequently voluminous, unstructured, noisy, and dynamic. Text, audio, and video analytics can be applied to derive insight from such data. Also, big data technologies can be adapted to deal with the data processing challenges.
Structure-based analytics also means to as social network analytics and this analytics is concerned with synthesizing the structural attributes of a social network and retrieving intelligence from the associations among the participating entities. The organization of a social network is modeled through a set of nodes and edges, indicating participants and relationships, respectively. The model can be visualized as a graph collected of the nodes and the edges.
Various techniques have in recent times evolved to retrieve information from the structure of social networks.
Community detection, also mean to as community discovery, retrieves hidden communities within a network. Community uncovering aids to summarize huge networks, which then facilitate exposure current behavioural patterns and predicting developing properties of the network. Hence, community uncovering is similar to clustering [37]; a data mining technique used to partition a data set into disjoint subsets depending on the resemblance of data points. Community uncovering has found several application areas, as well as marketing and the World Wide Web [38].
Link prediction particularly addresses the difficulty of predicting potential linkages among the current nodes in the underlying network. Usually, the organization of social networks is not motionless and endlessly grows through the formation of new nodes and edges. Consequently, a natural goal is to know and guess the dynamics of the network. Link guess techniques forecast the incidence of dealings, collaboration, or influence among entities of a network in a definite time interval. Link forecast techniques do better than pure chance by factors of 40–50, signifying that the present organization of the network certainly contains latent information about prospect links [40].
Predictive analytics
encompasses a mixture of techniques that foresee prospect outcomes depending on historical and present data. In practice, predictive analytics can be applied to approximately all disciplines– from guessing the malfunction of jet engines based on the stream of data from a number of thousand sensors, to predicting customers’ subsequent moves based on what they purchase, when they purchase, and even what they speak on social media. At its centre, predictive analytics look for to unearth patterns and capture relationships in data. Predictive analytics techniques are subcategorized into two categories. A few techniques, for instance, moving averages, try to find out the historical patterns in the outcome variable(s) and extrapolate them to the hope. On the other hand, for instance, linear regression aims to capture the interdependencies between outcome variable(s) and explanatory variables and make use of them to build predictions. Depending on the underlying methodology, techniques can also be grouped into two types: regression techniques (e.g., multinomial logit models) and machine learning techniques (e.g., neural networks). An additional type is based on the kind of outcome variables: techniques like linear regression address continuous outcome variables (e.g., the sale price of houses), whilst others like Random Forests are applied to distinct outcome variables (e.g., credit status).Predictive analytics techniques mainly depend on statistical methods. A number of factors call for developing new statistical methods for big data. At the beginning, traditional statistical methods are rooted in statistical importance: a little sample is gained from the population and the consequence is compared with a possibility to examine the importance of a particular relationship. The termination is then widespread to the entire population. On the other hand, big data samples are huge and correspond to the mainstream of, if not the entire, population. As an outcome, the view of statistical importance is not that related to big data. Next, in case of computational efficiency, a lot of traditional methods for little samples do not scale up to big data. The last feature corresponds to the distinguishing characteristics inherent in big data: heterogeneity, noise accumulation, spurious correlations, and incidental endogeneity [41].
Heterogeneity. Big data are frequently obtained from diverse sources and correspond to information from diverse subpopulations. As a consequence, big data are highly heterogeneous. The sub-population data in little samples are deemed outliers for the reason of their inadequate occurrence. On the other hand, the absolute size of big data sets generates the sole prospect to model the heterogeneity arising from sub-population data, which would necessitate stylish statistical techniques.
Noise accumulation. Estimating predictive models for big data frequently includes the concurrent assessment of numerous parameters. The accumulated assessment fault (or noise) for diverse parameters could dominate the magnitudes of variables that have accurate effects inside the model. Conversely, a number of variables with noteworthy explanatory power might be ignored as a consequence of noise accumulation.
Spurious correlation. For big data, spurious correlation means to unrelated variables being incorrectly found to be correlated due to the gigantic size of the dataset. Fan and Lv [42] showed this occurrence through a simulation instance, where the relationship coefficient between independent random variables is exposed to boost the size of the dataset. As an outcome, a few variables that are scientifically unconnected (due to their independence) are mistakenly confirmed to be linked as a consequence of high dimensionality.
Incidental endogeneity. A common supposition in regression analysis is the exogeneity assumption: the descriptive variables, or predictors, are independent of the residual term. The validity of the majority of statistical methods used in regression analysis based on this assumption. Conversely, the survival of incidental endogeneity (i.e., the reliance of the residual term on some of the predictors) undermines the validity of the statistical methods used for regression analysis. Even though the exogeneity supposition is typically met in small samples, incidental endogeneity is normally there in big data. It is meaningful to talk about that, in distinction to spurious correlation, incidental endogeneity means to an authentic association between variables and the error terms.
2.4. Access Control Mechanisms
but these are almost focused on fixed datasets and not considered in respect of Big Data environment where the variety of data, volume, and velocity of data production are common issues. Some of the privacy protection or access control research works which could be relevant to the Big Data technology are described in brief.
Kabir et al. [43] proposed a privacy-preserving access control model. This model is based on two conditional purposes named allowed purpose and prohibited purpose and thus users can query only some data for a specific objective. Moreover, the subject attributes, context attributes, and authorisation policies are used to verify the access purpose in a dynamic role while the intended purposes are also dynamically associated with the required data to access. In addition, to meet up the compliance computation between the two purposes, an algorithm is developed. Thus, this model assures that more information can be pulled out from data providers subject to the privacy being preserved. Fletcher and Islam [44] proposed a new differentially-private decision forest (a decision forest is an ensemble of decision trees) algorithm to reduce the sensitivity and number of queries. Here, private data is ignored while querying to retrieve the majority of information using the decision forest. Their proposed algorithm makes very efficient utilization of privacy budget to produce a classifier having a highly accurate prediction. A privacy-aware access control model in web service environments has been presented by Li et al. [45] and based on a trust-based decision and recent access control policies, a valid access process has been analyzed to manage it. A new rule-based framework [46] has been introduced to recognize and deal with issues of sharing in virtual university environments through role-based access control (RBAC) management. A role-role-based group delegation granting model, group delegation revocation model, authorization granting, and authorization revocation have been included in this framework. Shen et al. [47] proposed a generic architecture for IoT to support two DIY areas: network DIY (do-it-yourself) for data aggregation and application DIY for service cooperation. A centralized controller has been designed to give uniformed interfaces for data acquisition, organization, and storage, and to aid elastic and supportive computing in order to connect these DIY. A much finer level anonymisation scheme considering the data requester’s trust and specific application-purpose has been provided by Sun et al. [48]. Here, at first, the attributes for anonymisation depending on their value to application objectives have prioritized. Next, to what extent the data should be anonymised projecting the trust value and the degree of data anonymisation is measured. Finally, to find the looked-for anonymous solution and to guarantee the uniqueness and correctness, a decomposition algorithm is developed. Anonymisation methods are capable of protecting private information but valuable information is loosed during the process. To minimize the loss of information, an efficient systematic clustering method for k-anonymisation has been proposed [49]. Several other privacy protection methods have been
introduced by Huang et al. [50], Zhang et al. [51] and Sun et al. [52] which all can be utilized to develop new methods and algorithms to meet up the challenges of privacy protection in Big Data platform.
3. Analysis Pipeline and Challenges with
Big Data
Figure 3 [53, 54] divide the key issues in Big Data into three types depending on the shared aims of the challenge. Information rises hurriedly at a rate of 10x every five years [55].
Figure 3: Challenges in Big Data [54]
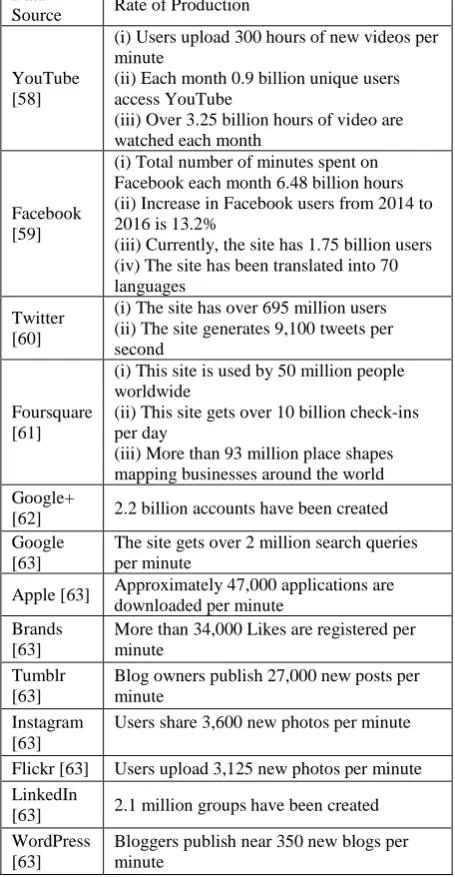
The data type that rises most hurriedly is unstructured data. This data type is regarded as by “human information” like high-definition videos, movies, photos, scientific simulations, financial transactions, phone records, genomic datasets, seismic images, geospatial maps, e-mail, tweets, Facebook data, call-centre conversations, mobile phone calls, website clicks, documents, sensor data, telemetry, medical records and images, climatology and weather records, log files, and text [56]. As per statistics of the Computer World, unstructured information may well account for more than 70% to 80% of all data in organizations [57]. These data, which mainly initiate from social media, comprise 80% of the data worldwide and account for 90% of Big Data.
Table 1: Rapid growth of unstructured data [54]
Data
Source Rate of Production
YouTube [58]
(i) Users upload 300 hours of new videos per minute
(ii) Each month 0.9 billion unique users access YouTube
(iii) Over 3.25 billion hours of video are watched each month
Facebook [59]
(i) Total number of minutes spent on Facebook each month 6.48 billion hours (ii) Increase in Facebook users from 2014 to 2016 is 13.2%
(iii) Currently, the site has 1.75 billion users (iv) The site has been translated into 70 languages
Twitter [60]
(i) The site has over 695 million users (ii) The site generates 9,100 tweets per second
Foursquare [61]
(i) This site is used by 50 million people worldwide
(ii) This site gets over 10 billion check-ins per day
(iii) More than 93 million place shapes mapping businesses around the world Google+
[62] 2.2 billion accounts have been created Google
[63]
The site gets over 2 million search queries per minute
Apple [63] Approximately 47,000 applications are downloaded per minute
Brands [63]
More than 34,000 Likes are registered per minute
Tumblr [63]
Blog owners publish 27,000 new posts per minute
Instagram [63]
Users share 3,600 new photos per minute
Flickr [63] Users upload 3,125 new photos per minute LinkedIn
[63] 2.1 million groups have been created WordPress
[63]
Bloggers publish near 350 new blogs per minute
The analysis of Big Data includes manifold different phases as shown in Figure 4 below, each of which introduces challenges. The analysis phase has received a great deal of concentration but there are inadequately understood complexities in the perspective of multi-tenanted clusters where numerous users’ programs run simultaneously. Countless noteworthy challenges enlarge beyond the analysis phase. For instance, noisy, heterogeneous and not take in an upfront model is to be handled by Big Data in context. Undertaking these increases the need to follow provenance and to manage ambiguity and mistake: topics that are decisive to accomplishment, and yet hardly ever mentioned in the identical inhalation as Big Data. Likewise, the questions to the data analysis channel will naturally not all are laid out in advance. Thus, here good questions based on the data may need to figure out. Undertaking this will
necessitate smarter systems and in addition superior support for user interaction with the analysis channel. Actuality, there is a most important bottleneck in the number of people empowered to raise questions of the data and analyze it [65]. The quantity can be considerably increased by taking sides many levels of meeting with the data, not all requiring profound database know-how. Solutions to these difficulties require to basically rethinking how we manage data analysis [66].
Figure 4: The Big Data analysis pipeline. Major steps in analysis are shown in the flow at top. Below it are Big
Data needs that make these tasks challenging [66]
3.1. Phases in the processing pipeline [66]
(i) Data acquisition and recording: Big Data is recorded from some data generating source. For instance, scientific experiments and simulations straightforwardly produce petabytes of data these days. A large amount of this data is of no significance, and it can be filtered and dense by orders of scale. However, there are a lot of challenges and out of these; the first one is to define these filters in such a manner that they do not throw away valuable information. The second big challenge is to repeatedly produce the correct metadata to explain what data is recorded and how it is recorded and measured. A third significant issue here is data provenance. If the information can be interpreted and carried through the data analysis channel, recording information about the data at its birth will be valuable. Hence, there is a call for research both into producing appropriate metadata and into data systems that bear the provenance of data and its metadata through data analysis channel. (ii) Information extraction and cleaning: Often, the
analysis. But this is a technical challenge to do this correctly and completely. Well‐recognized constraints on valid data or well-understood error models are guessed by current research on data cleaning; for many up-and-coming Big Data domains, these even do not exist.
(iii) Data integration, aggregation, and representation: Data analysis is significantly more challenging than simply locating, identifying, understanding, and citing data. For efficient extensive analysis, all of this has to occur in an entirely automated way which requires differences in data structure and semantics to be expressed in forms that are computer understandable, and then automatically resolvable. To answer these, there is a powerful body of effort in data integration. On the other hand, a substantial supplementary effort is obligatory to attain robotic error-free divergence resolution.
(iv) Query processing, data modeling, and analysis: Methods for querying and mining Big Data are basically dissimilar from conventional statistical analysis on tiny samples. Nonetheless, even noisy Big Data could be more important than small samples as general statistics retrieved from frequent patterns and correlation analysis generally overpowers individual fluctuations and frequently discloses more dependable concealed patterns and knowledge. Moreover, interrelated Big Data forms big heterogeneous information networks, with which information redundancy can be uncovered to balance for missing data, to crosscheck contradictory cases, to legalize reliable associations, to unveil inherent clusters, and to discover unseen relationships and models.
Mining requires integrated, cleaned, reliable, and efficiently easily reached data, declarative query and mining interfaces, scalable mining algorithms, and Big Data computing environments. At the similar timeline, data mining itself can as well be used to help get better the quality and reliability of the data, understand its semantics, and present intelligent querying functions.
A most important open research problem nowadays is scaling complex query processing techniques to terabytes whilst facilitating interactive response times. A difficulty with existing Big Data analysis is the not have of synchronization between database systems, which host the data and provide SQL querying, with analytics packages that carry out a variety of forms of non-SQL processing, such as data mining and statistical analyses. Both expressiveness and performance of the analysis can be benefited from a tight coupling between declarative query languages and the functions of such packages. (v) Interpretation: If users cannot comprehend the
analysis, there will be a limited value of having the capability to analyze Big Data. Eventually, a decision-maker has to interpret these outcomes providing the result of an analysis. It is not common
to provide just the results; in addition, one must supply accompanying information that describes how each result was derived and depending upon in particular what inputs. This complementary information is called the provenance of the (outcome) data. By learning how finest to capture, store, and query provenance, in concurrence with techniques to capture sufficient metadata, an infrastructure can be created to present users with the capability both to understand analytical outcomes retrieved and to go over the analysis with diverse assumptions, parameters, or datasets.
3.2. Challenges in Big data analysis [66]
(i) Heterogeneity and incompleteness: When people get through information, a vast deal of heterogeneity is at ease tolerated. But, machine analysis algorithms look forward to homogeneous data, and cannot recognize nuance. As a result, data must be with awareness structured as the first move in data analysis. An efficient demonstration, access, and analysis of semi-structured data entail additional effort. Some incompleteness and a number of errors in data are likely to remain even after data cleaning and error correction. There is a big challenge to correctly handle this incompleteness and these errors. (ii) Scale: Handling huge and quickly growing volumes of data has been a challenging matter for many decades. In previous years, this challenge was overcome by processors reaching faster following Moore’s law, to present with the resources required to deal with escalating volumes of data. However, there is an elementary transfer in progress now: data volume is scaling faster than compute resources, and CPU speeds are motionless. In the history, large data processing systems had to be anxious regarding parallelism across nodes in a cluster; nowadays, one has to deal with parallelism inside a single node. Unluckily, parallel data processing techniques that were functional in the earlier period for processing data across nodes don’t straight apply for intra-node parallelism, since the architecture looks extremely dissimilar. Additionally, the shift on the way to stuffing multiple sockets (each with 10s of cores) adds another level of difficulty for intra‐node parallelism. Last of all, with predictions of dark silicon that power concern will probably in the upcoming forbid us from using all of the hardware in the system constantly, data processing systems will be expected having actively deal with the power consumption of the processor. Thus there is a rethinking is needed of how to design, build and operate data processing components to overcome these exceptional changes.
of data, a new system is to be designed that also likely to process a given size of data set faster. But, one should also come up with velocity along with speed. It is frequently essential to search elements in a big data set that meet up a particular principle. In terms of data analysis, this type of finding is expected to happen frequently. Scanning the whole data set to locate appropriate elements is noticeably unfeasible. To a certain extent, index structures are formed in proceeding to allow finding qualifying elements promptly. The trouble is that each index structure is intended to carry just a few classes of criteria. By means of fresh analyses looked-for using Big Data, there are new types of criteria précised and necessitate working out new index structures to hold up such criteria.
(iv) Privacy: The privacy of data is a further vast concern and one that rises in the circumstance of Big Data. Controlling privacy is effectively together with a technical and a sociological problem, which has to be addressed in cooperation from both perspectives to recognize the promise of Big Data. To keep away a user location from others is a great deal of more challenging than hiding his/her individuality. This is due to with location-based services; the location of the user is essential for a winning data access or data collection, while the uniqueness of the user is not compulsory. The current concept of the degree of privacy is a very significant step in the accurate direction, but it unhappily reduces information content too distant in order to be realistic in the majority of practical cases. So far another very key direction is to second thoughts security for information sharing in Big Data use cases.
(v) Human Collaboration: Despite the incredible advances made in computational analysis, there stay behind many patterns that humans can simply identify but computer algorithms have a tough time finding. Preferably, analytics for Big Data will not be all computational – somewhat it will be planned explicitly to have an individual in the loop. A Big Data analysis system must allow input from multiple human experts and joint investigation of results. These manifold experts may be unconnected in space and time when it is too costly to bring together a whole team together in one room. The data system has to admit this distributed expert input and hold up their collaboration. When crowd-sourced data is acquired for hire much of the data formed may be a key objective of getting it done rapidly rather than accurately. This is so far another error model, which must be designed for explicitly when it applies.
4. Future Directions
While we are in the era of Big Data, there are numerous research questions to answer.
Some of the research questions to be explored:
Can we efficiently access data from a Big Data platform?
Can we apply the existing data mining techniques to extract knowledge from the Big Data stored in distributed nodes?
Are we missing any valuable data while processing and mining for information retrieval?
Big Data systems have grown-up insignificance, and all types of private and public organizations are progressively more aware of the potential benefits of Big Data as an enabler to make use of their data. The IT industry has reacted by exploring enormous efforts in Big Data systems; but, their limitations are becoming more and more evident. From a technical point of view, the prospect of Big Data will be formed by the new solutions that deal with these limitations [7]:
New systems that permit the analysis of both structured and unstructured data to be joined, i.e., capable to unite multiple data sources (from social media to data warehouses) in an approach that is controllable, not only for the professionals but also more non-professional users and groups.
New embedded analytics that exploits the streams of data in actual time under strict resource restrictions of computing capacity, storage, energy, and communication bandwidth.
New paradigms that super-seed the pure batch and pure real-time method of current Big Data tools.
New application frameworks capable to grasp all distributed computing resources, admitting to run diverse kinds of tasks (batch, stream analysis, interactive) virtualizing all the underlying infrastructure and scheduling usage based on the task needs.
New database systems proficient to manage large datasets whilst holding the transactional semantics of data operations on hand in conventional relational databases.
New Big Data tools that are guiding and controlling ethical, security and privacy issues in Big Data research.
algorithms available, for instance, SysFor [68], Forest PA [69] and ForEx++ [70] and these algorithms perfectly doing the job of classification, future prediction, and knowledge discovery. By modifying these algorithms, parallel processing can be employed to the Big Data as well as these can also be applied for knowledge discovery, classification and future prediction from Big Data.
5. Proposed Methodologies
The primary objectives to find the answers to the research questions mentioned in section 4 could be:
To apply the existing techniques for accessing Big Data
To improve the query processing performance, develop new methods and techniques
To enable new fields of inquiry and new modes of discovery and innovation
To discover knowledge from huge volume and large variety of Big Data
A methodology for the above research; Methods for querying and mining Big Data are basically dissimilar from conventional statistical analysis on tiny samples. Big Data could be more precious than little samples as general statistics obtained from recurrent patterns and correlation analysis generally overwhelm individual fluctuations and frequently reveal more dependable patterns and knowledge. Combinations of computational, mathematical, and statistical techniques, methodologies and theories are essential to make possible these discoveries. Efficient and optimized access methods for Big Data research can be conducted based on the following methodology:
First of all, the requirements should be identified that an optimal method has to satisfy in order to efficiently manage the Big Data. To detect the requirements for efficient and optimal access methods, a Big Data platform will be used consisting of multiple distributed nodes and holding a large volume and variety of data (structured, semi-structured, and unstructured). Next, one of the advance Big Data processing framework will be used to store and manage data. After that, existing query processing methods will be applied to access the data from the distributed environment. Furthermore, query types will be classified and identified that Big Data access methods have to efficiently support. Moreover, improved distributed multi-dimensional index structure will be proposed to satisfy the identified requirements. At the end, a sound and complete algorithm will be developed for query processing. Also in this stage, powerful algorithms to be developed to visualize the required information.
To discover knowledge from Big Data using data mining techniques, at first, data will be collected from available data sources which also involves data load and
data integration. Next, the “gross” and “surface” properties of acquired data will be examined carefully and reported. Then, the data will be explored by tackling the data mining questions which can be addressed using querying, reporting, and visualization. Finally, the data quality will be examined by answering some important questions such as “Is the acquired data complete?”, “Is there any missing values in the acquired data?” In each stage of Big Data mining, performance will be evaluated whether existing techniques are able to perform efficiently with Big Data or not; otherwise, new and improved Big Data mining techniques will be developed.
The performance of the proposed algorithms and techniques in all cases will be evaluated both theoretically and empirically with respect to the state-of-the-art in the literature.
6. Conclusion
Big Data has the perspective to modernize not just research, but also in education and other areas like urban planning (through fusion of high fidelity geographical data), intelligent transportation (through analysis and visualization of live and detailed road network data), environmental modelling (through sensor networks ubiquitously collecting data), energy saving (through unveiling patterns of use), homeland security (through analysis of social networks and financial transactions of possible terrorists), and so on [41]. Thus, research like efficient access to Big Data and data mining on Big Data hold out significant roles in a variety of ways to the global economy.
This paper presents various data processing platforms that are currently available and whether these are capable to handle Big Data or not. In this paper, we also focus on some future research works to be completed for efficient access to the Big Data and in addition, a methodology has been proposed to solve the undiscovered issues for the Big Data.
It is believed that access methods for Big Data research has considerably broadened the scope of data analysis and will have a deep impact on Big Data access methodologies as well as data mining methodologies and applications in the long run. However, there are still some challenging research issues that need to be solved before access methods for Big Data can claim a keystone approach in data mining, text analytics, and related applications.
Acknowledgements
References
[1] Kubick, W.R. (2012) Big data, information and meaning. In Clinical Trial Insights (New Jersey: Applied Clinical Trials), 26–28.
[2] Laney, D. (2001) 3D Data management: controlling data volume, velocity, and variety. META GROUP.
[3] Gantz, J. and Reinsel, D. (2011) Extracting value from chaos. In IDC iView, 1-12.
[4] Gamble, M. and Goble, C. (2011) Quality, trust and utility of scientific data on the web: toward a joint model. In
Proceeding of the ACM WebScill, 1-8.
[5] Mallah, R. The other five V's of big data: an updated paradigm. https://bigdata.cioreview.com/cxoinsight/the- other-five-v-s-of-big-data-an-updated-paradigm-nid-10287-cid-15.html (accessed on 31 August 2017). [6] Russom, P. (2011) Big Data Analytics. TDWI Best
Practices Report, 1–40.
[7] DANET, P.Y. (2013) Big and open data position paper.
Networked and Electronic Media (European Union), VIRAL MEDIA.
[8] Hameed, A. (2016) Applying data mining and visualization techniques on PINGER data. MS (Computer Science) Thesis (Pakistan: University of Agriculture, Faisalabad). [9] Harris (2012) Small and midsize companies look to make
big gains with big data. SAP-Press Room.
[10] Gandomi, A. and Haider, M. (2015) Beyond the hype: big data concepts, methods, and analytics. International Journal of Information Management (Elsevier) 35:137-144.
[11] Elgendy, N. (2013) Big data analytics in support of the decision making process. MSc Thesis (German University in Cairo), 164.
[12] Elgendy, N. and Elragal, A. (2014) Big data analytics: a literature review. ICDM 2014, LNAI 8557 (Switzerland: Springer International Publishing), 214-227.
[13] Stantic B. and Pokorny J. (2014) Opportunities in big data management and processing. Frontiers in Artificial Intelligence and Applications. 270:15-26.
[14] Wu, X., Kumar, V., Quinlan, J. R., Ghosh, J., Yang, Q., Motoda, H., McLachlan, G. J., Ng, A, Liu, B., Yu, P. S., Zhou, Z. H., Steinbach, M., Hand, D. J. and Steinberg, D. (2008) Top 10 algorithms in data mining. Knowledge Information Systems. 14:1–37. DOI: 10.1007/s10115-007-0114-2.
[15] Alam, M. and Shakil, K. A. (2013) Cloud database management system architecture. UACEE International Journal of Computer Science and its Applications. 3(1):27-31.
[16] Khan, S., Shakil, K.A. and Alam, M. (2015) Cloud-based big data analytics – a survey of current research and future directions. Distributed, Parallel, and Cluster Computing
(New York: Cornell University Library).
[17] Fernández, A. Rio, S.D., López, V., Bawakid, A., Jesus, M.J.D, Benítez, J.M. and Herrera, M. (2014) Big data with cloud computing: an insight on the computing environment, mapreduce, and programming frameworks.
Wiley WIREs Data Mining and Knowledge Discovery.
4(5):380–409.
[18] Dean, J. and Ghemawat, S., (2004) MapReduce: simplified data processing on large clusters. In OSDI 2004 (CA: San Francisco), 137–50.
[19] White, T. (2012) Hadoop: the definitive guide. Sebastopol: O’Reilly Media, Inc.
[20] Apache Hadoop Project (2015). Apache Hadoop.
http://hadoop.apache.org/ (accessed on December 2015). [21] Lin, J. (2012) Mapreduce is good enough? if all you have
is a hammer, throw away everything that’s not a nail! Big Data. 1(1):28–37.
[22] Karau, H., Konwinski, A., Wendell, P., and Zaharia, M., (2015) Learning spark: lightning-fast big data analytics.
Sebastopol: O’Reilly Media.
[23] Spark A. Apache Spark: Lightning-fast cluster computing.
https://spark.apache.org/ (accessed on December 2015). [24] Zaharia, M., Chowdhury, M., Das, T., Dave, A., Ma, J.,
McCauley, M. and Franklin, M.J. (2012) Resilient distributed datasets: A fault-tolerant abstraction for in-memory cluster computing. In Proceedings of the 9th USENIX Conference on Networked Systems Design and Implementation (NSDI’12) (CA: San Jose), 15–28. [25] InfoWorld (2015). Apache Flink: New Hadoop contender
squares off against Spark.
http://www.infoworld.com/article/2919602/hadoop/flink-hadoops-new-contender-for-mapreduce-spark.html
(accessed on December 2015).
[26] Storm (2015). Apache Storm. http://storm-project.net/
(accessed on December 2015).
[27] Flink (2015). Apache Flink. https://flink.apache.org/
(accessed on December 2015).
[28] Pyle, D. (1999) Data preparation for data mining. San Francisco: Morgan Kaufmann Publishers Inc.
[29] García, S., Luengo, J. and Herrera, F. (2015) Data pre-processing in data mining. Intelligent Systems Reference Library (Berlin: Springer) 72. DOI: 10.1007/978-3-319-10247-4.
[30] Chung, W. (2014). BizPro: Extracting and categorizing business intelligence factors from textual news articles.
International Journal of Information Management. 34(2): 272–284.
[31] Jiang, J. (2012). Information extraction from text. In C. C. Aggarwal, & C. Zhai (Eds.), Mining text data (United States: Springer), 11–41.
[32] Hahn, U., and Mani, I. (2000) The challenges of automatic summarization. Computer. 33(11):29–36.
[33] Liu, B. (2012) Sentiment analysis and opinion mining.
Synthesis Lectures on Human Language Technologies.
5(1):1–167.
[34] Feldman, R. (2013). Techniques and applications for sentiment analysis. Communications of the ACM. 56(4):82–89.
[35] Hirschberg, J., Hjalmarsson, A., and Elhadad, N. (2010) “You’re as sick as you sound”: Using computational approaches for modeling speaker state to gauge illness and recovery. In A. Neustein (Ed.), Advances in speech recognition (United States: Springer), 305–322.
[36] Manyika, J., Chui, M., Brown, B., Bughin, J., Dobbs, R., Roxburgh, C. and Hung, A. (2011) Big data: The next frontier for innovation, competition, and productivity.
McKinsey Global Institute.
http://www.citeulike.org/group/18242/article/9341321. [37] Aggarwal, C.C. (2011) An introduction to social network
data analytics. In C.C. Aggarwal (Ed.), Social network data analytics (United States: Springer), 1–15.
![Figure 2: Definitions of Big Data based on an online survey of 154 global executives in April 2012 [10]](https://thumb-us.123doks.com/thumbv2/123dok_us/8427554.1696533/3.595.47.277.262.379/figure-definitions-data-online-survey-global-executives-april.webp)
![Figure 3 [53, 54] divide the key issues in Big Data into three types depending on the shared aims of the challenge](https://thumb-us.123doks.com/thumbv2/123dok_us/8427554.1696533/8.595.325.549.245.395/figure-divide-issues-data-types-depending-shared-challenge.webp)