http://www.sciencepublishinggroup.com/j/acis doi: 10.11648/j.acis.20170504.11
ISSN: 2328-5583 (Print); ISSN: 2328-5591 (Online)
The Elevator Fault Diagnosis Method Based on Sequential
Probability Ratio Test (SPRT)
Chang Liu
1, Shu Zhou
1, *, Xindong Liu
1, Can Chen
21Department of Electrical and Information Engineering, Jinan University, Zhuhai, China 2
Guangdong Power Grid Company, Zhuhai Power Supply Bureau, Zhuhai, China
Email address:
[email protected] (Shu Zhou) *Corresponding author
To cite this article:
Chang Liu, Shu Zhou, Xindong Liu, Can Chen. The Elevator Fault Diagnosis Method Based on Sequential Probability Ratio Test (SPRT). Automation, Control and Intelligent Systems. Vol. 5, No. 4, 2017, pp. 50-55. doi: 10.11648/j.acis.20170504.11
Received: June 12, 2017; Accepted: June 26, 2017; Published: July 26, 2017
Abstract:
An elevator fault diagnosis method based on Sequential Probability Ratio Test (SPRT) is proposed in this paper. In order to verify the effectiveness of the method, this paper designed the fault diagnosis experiment for elevator mechanical system. Firstly, the wavelet transformation is used to filter the noise of the vibration signal collected in the experiment. Then the kurtosis value of the filtered signal is extracted as the index to represent the practical status of the elevator. Finally, the SPRT algorithm is used to diagnose the faults of the elevator mechanical system. Experimental results show that this method has high accuracy in practical applications. It is important to improve the performance of the fault diagnosis for the elevator mechanical system.Keywords:
Sequential Probability Ratio Test, Fault Diagnosis, Wavelet Transformation, Kurtosis1. Introduction
With the rapid development of science and technology and the improvement of automation, the security and reliability of mechanical systems are becoming more prominent. It is important to detect the faults accurately and timely and identify and evaluate the fault types. Mechanical fault diagnosis technology has become a valuable research topic.
Elevator plays an extremely important role in the national economy and people's daily life. As a complex electromechanical integration equipment, elevator system possesses various types and configurations, but they all have three major parts, mechanical, electrical and safety devices [1]. The mechanical part is the framework of the elevator, and it is the key component for elevator operation. This paper will study the fault diagnosis of the mechanical system of elevator by using Sequential Probability Ratio Test (SPRT).
SPRT is a hypothesis test method in statistical theory. In comparison with other fault diagnosis algorithm, the SPRT algorithm does not need to preset the number of test samples. It just compares the value after sequential probability ratio
testing with the predefined threshold. According to this compared results, the operational state of the equipment can be detected [2]. Therefore, the inaccurate diagnosis results induced by the data sample selection in other fault diagnosis algorithms is overcome.
In this paper, SPRT is applied to fault detection of elevator mechanical system. Experiments show that the proposed elevator fault diagnosis method based on sequential probability ratio test is effective and reliable.
2. Elevator Fault Analysis
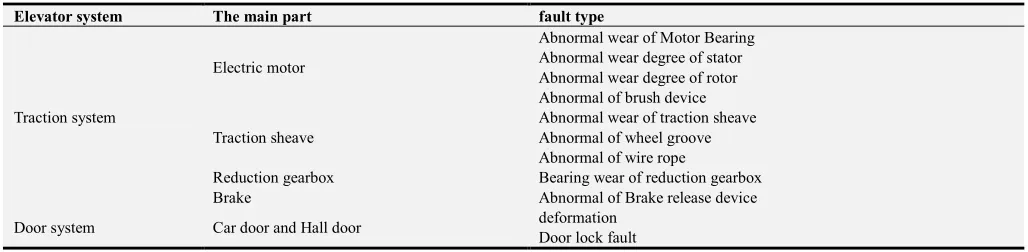
Table 1. Fault components of elevator mechanical system and fault types.
Elevator system The main part fault type
Traction system
Electric motor
Abnormal wear of Motor Bearing Abnormal wear degree of stator Abnormal wear degree of rotor Abnormal of brush device
Traction sheave
Abnormal wear of traction sheave Abnormal of wheel groove Abnormal of wire rope
Reduction gearbox Bearing wear of reduction gearbox Brake Abnormal of Brake release device
Door system Car door and Hall door deformation Door lock fault
3. Elevator Fault Diagnosis Based on
SPRT
3.1. Sequential Probability Ratio Test Theory
In 1947, Wald [6] proposed the sequential probability ratio test algorithm, and it is based on two hypotheses: (1) The sample X should be independent and identically distributed; (2) The prior distribution of the sample should be known [7].
Assume that random variable X is the measurable mapping from a probability space to a measurable space. The probability density function of X under two assumptions of H0
and H1 are , and , . Sampling x1, x2, x3…
successively, the likelihood ratio can be computed after each samples as
λ ,, ∏∏ ⁄⁄ (1)
Where is the index data for each sample, and is the discrete type variable whose conditional probability is /θ .
Defining two constants A and B (0<A<B<∞) and comparing λ with A and B. If λ A, then stop sampling and accept the assumption H0. If λ B, then
accept the assumption H1. If A<λ <B, then continue
sampling , calculate the likelihood ratio again, and compare λ with A and B. Repeating these processes until accepting the assumption H0 [8]. This test can be represented
in a compact form SPRT (A. B). A and B are boundary points of the sequential probability test. The size of A and B are determined by the probability α of error type I and the probability β of error type II.
A ! (2)
B ! (3)
3.2. The Elevator Fault Diagnosis Model Based on SPRT
Based on analysis above, this section, taking traction motor and traction wheel as examples, gives the elevator fault diagnosis model based on SPRT, and depicts the detailed elevator fault diagnosis process.
The establishment of elevator fault diagnosis model:
In the elevator fault diagnosis model based on SPRT, the monitoring nodes are Q1-Q7, as shown in Table 2. We installed two acceleration sensors in the horizontal and vertical directions of each monitoring node. The vibration signals of the monitoring nodes are the inputs of diagnosis model. For convenience, this paper only process and analyze the vibration signals measured from horizontal sensors. In practical situation, the signals measured by sensors often have noise, which affects the stability of the signal. Therefore, the wavelet packet method is used to filter the noise in order to obtain stable vibration signals. Then, extract the representative value of the monitoring signal by time domain analysis. Finally, use the SPRT to obtain the status of all monitoring nodes, and then determine whether the elevator is in fault or normal state. The workflow of the fault diagnosis model is shown in Figure 1.
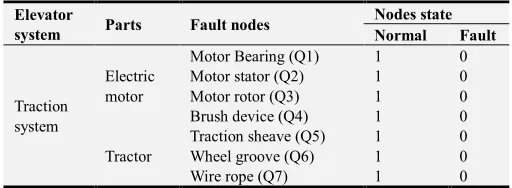
Table 2. The fault nodes which are monitored by the model.
Elevator
system Parts Fault nodes
Nodes state Normal Fault
Traction system
Electric motor
Motor Bearing (Q1) 1 0 Motor stator (Q2) 1 0 Motor rotor (Q3) 1 0 Brush device (Q4) 1 0
Tractor
Traction sheave (Q5) 1 0 Wheel groove (Q6) 1 0 Wire rope (Q7) 1 0
In this model, before each signal acquisition, the system automatically determines whether all monitoring node status are stable. If they are, it is not necessary to acquire the signal for the next time. Otherwise the signal has to be collected. If all monitoring node states are stable, the model output the diagnostic results of the elevator.
3.3. Elevator Fault Diagnosis Algorithm Based on SPRT
3.3.1. Data Processing Algorithm
Wavelet packet de-noising Algorithm:
Wavelet packet algorithm is an ideal tool to realize the separation of complex vibration signal. The algorithm not only decomposes the low frequency part, but also makes twice decompositions for the high frequency part, so it can effectively distinguish the mutation part and the noise in the signal, reduce the noise of the signal, and improve the signal-to-noise ratio. Wavelet packet algorithm not only effectively preserves the peak value and the mutation part of the useful signal in the original signal, but also makes the time domain waveform of the signal smoother. This ensures that the signal does not generate the distortion components during the process of noise reduction.
Wavelet packet algorithm consists of the following steps [9]:
1) Taking the discrete form x (n) of the continuous x (t) as the signal to be analyzed. We determine the N as the hierarchical of wavelet decomposition (usually 3 or 4). Then the signal is decomposed by N layer wavelet packets.
2) The wavelet packet coefficients of each frequency band are sorted.
3) The signal of each frequency band is reconstructed. 4) Analyzing the correlations of signals.
5) At various decomposition scales, select an appropriate threshold to quantize the high-frequency coefficients. Eliminate the wavelet packet coefficients corresponding to no correlation signals.
6) The wavelet packet coefficients of the processed wavelet are reconstructed. Then obtain the denoising signals.
Extract node index:
The node index is the characteristic information that can clearly reflect the status of the monitoring node. Following the results in [10], the vibration signal of each component of elevator has significant difference under the different operational conditions. Therefore, we extract the characteristic parameters that can reflect this difference as the
index of monitoring nodes. This index is also the test parameter of SPRT. The specific characteristic parameters are calculated as follows:
̅ $∑$&' & (4)
y) ×∑ + ̅
,-... + ,
/∑,-...+ , + ̅010
(5)
μ 3∑ 43)' ) (6)
σ 63∑3)' y)− 8 9 (7)
For the signal to be tested, ̅ is the mean, N is the number of data point, and & is the related discrete signal. y) is the Kurtosis of each group of test signal. t 1,2,3, ⋯ , n, n is the sample number for model checking. μ is the mean of Kurtosis and σ is the standard deviation of Kurtosis.
3.3.2. SPRT Algorithm
After extracting and analyzing the large number of node indexes via the elevator simulation experiment, it can be found that the test parameter sequence is consistent with the Gauss distribution. As an example, for the monitoring node Q1 of the model, when the motor bearings are in normal operation, the test parameter sequence satisfies the hypothesis H0: μ = μ . When the motor runs in fault state, the test parameter sequence satisfies the hypothesis H1: μ = μ .
Assume that the probability density function for H0 and H1 are respectively.
@& =A√9Cexp G−9A0(4&− 8 )9H (8)
@& =A√9Cexp G−9A0(4&− 8 )9H (9)
k is the kth sample from the model and I is constant. The likelihood ratio of probability ratio test is:
λ&( ) =∏∏++ JJ++=∏∏++ JJ++(K(K++))∗JJ (10)
@ and @ are the prior probability of H0 and H1 respectively, and @ @⁄ = 1. In practical model, equation (10) is simplified as follow
Δ&= ln/λ&( )1 = ln∏∏++ JJ++= ∑3&' lnJJ ++ (11)
The thresholds are revised as a = ln P, b = ln R.
4. Experimental Results
4.1. Determination of Fault Model Parameters
Before using the fault diagnosis model to detect the state of elevator, the model's diagnosis parameters should be determined. In this paper, each monitoring node gets N=5000 data points in each experiment. Each group takes 1000 data points, then n=4001 groups of sample sequences can be
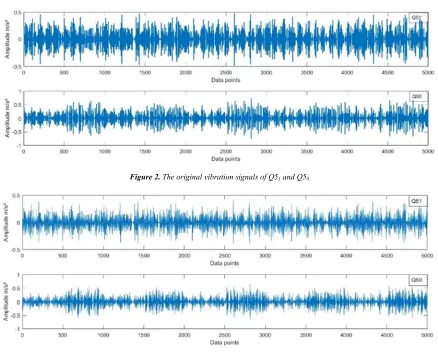
obtained. We collected six kinds of vibration signal for nodes Q5, Q6 and Q7 in normal and fault conditions. Qi1 is the signal
in normal state, and Qi0 is the signal in fault state where i=5, 6,
7. For Q51 and Q50, the vibration signals of the original
vibration signal and the wavelet packet transform are shown in Figure 2 and Figure 3
Figure 2. The original vibration signals of Q51 and Q50.
Figure 3. The signal after wavelet packet de-noising.
The probability for error type I is equal to the one of error type II, i.e.α β, α → 0. According to a large number of experiments, this paper chooses a=1000 and b=-1000 as the test thresholds. The mean of vibration signal under normal condition is taken as 8 , and the mean of vibration signal under fault condition is for 8 .
4.2. Fault Diagnosis Experiment
After setting the diagnostic parameters of the model, we collected the vibration signal groups of normal state and fault state of Q5, Q6 and Q7 nodes from the practical ThyssenKrupp Elevator at Guangzhou subway Chebei station. Table 3 lists the node data and the corresponding state in 500 groups of experiment.
Table 3. The node data and the corresponding state in 500 groups of experiment.
Monitoring node data Monitoring node status
Q5 Q6 Q7 Q5 Q6 Q7
1 Q5 (1) Q6 (1) Q7 (1) 1 1 0
2 Q5 (2) Q6 (2) Q7 (2) 0 0 1
3 Q5 (3) Q6 (3) Q7 (3) 1 0 1
4 Q5 (4) Q6 (4) Q7 (4) 1 1 1
⋮ ⋮ ⋮ ⋮ ⋮ ⋮ ⋮
499 Q5 (499) Q6 (499) Q7 (499) 1 1 1
Qi (k) (i=5,6,7) indicates the vibration signal of the node
under the noise reduction after Kth test, (k=1,2,3…500). 1 indicates that the component of the monitoring node are normal, and 0 indicates that the component of the monitoring node are fault.
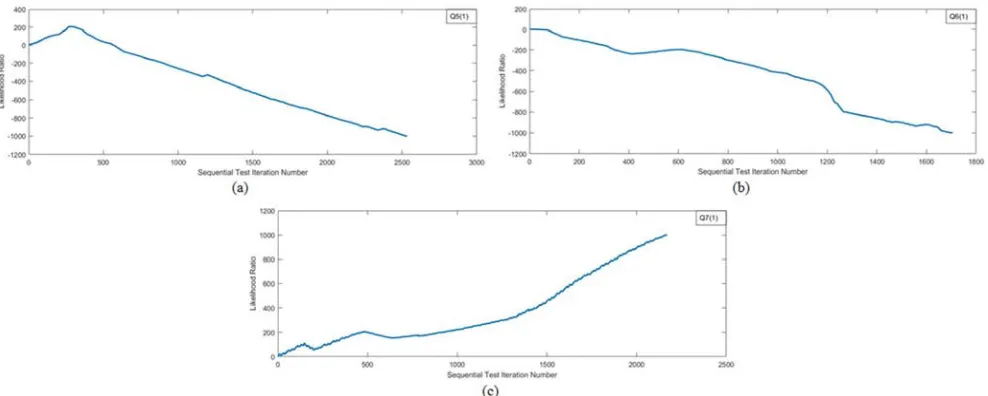
For example, the signals Q5 (1), Q6 (1) and Q7 (1) are tested
in the model respectively. It is easy to get the result in Figure 4. Figure 4 (a) shows that when the input signal is Q5 (1), the
likelihood ratio satisfy Δ V b, and the model determines that
the traction wheel is normal. Figure 4 (b) shows when the input signal is Q6 (1), likelihood ratio satisfy Δ V b, and the
model states that the wheel groove is normal. Figure 4 (c) shows when the input signal is Q7 (1), likelihood ratio satisfy Δ W a, and the model find that there exists a fault at the wire rope. The system shows the result of Tractor failure, and the related component is the wire rope.
Figure 4. The diagnostic results of Q5 (1), Q6 (1) and Q7 (1).
5. Reliability Analysis.
5.1. Accuracy Analysis
Through the 500 sets of experiments mentioned above, it is easy to get the diagnosis result after the fault diagnosis and the actual running state of the elevator system, which is shown in Table 4.
Table 4. the diagnosis result and the actual running state.
The actual state of nodes Diagnostic results of nodes
Q5 Q6 Q7 Q5 Q6 Q7
1 1 1 0 1 1 0
2 0 0 1 0 0 1
3 1 0 1 1 0 1
4 1 1 1 1 1 0
⋮ ⋮ ⋮ ⋮ ⋮ ⋮ ⋮
499 1 1 1 1 1 1
500 0 0 1 0 1 1
The number of correct diagnoses is M, and the number of all the data is N=500, the accuracy of Q5 is PQ5=M/N. In this
way, it is easy to calculate the accuracy of Q6 and Q7. The overall accuracy of the diagnosis model is 76.4%, which is the mean of PQ5, PQ6 and PQ7.
5.2. Error Analysis
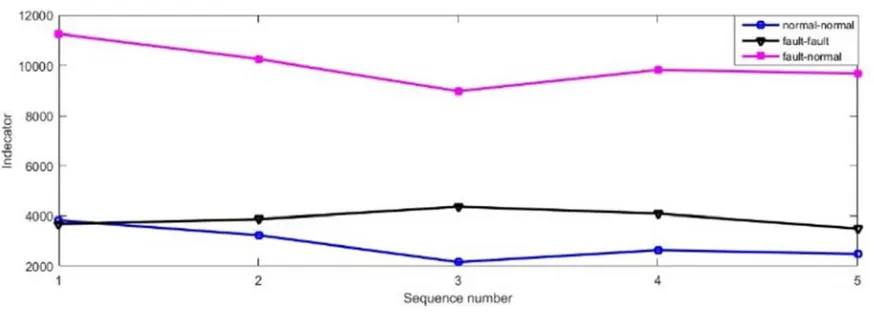
This paper also use the node Q5 as an example. 5 sets of vibration data under normal and fault states were collected respectively. Each set of data consists of N=5000 data points.
The likelihood ratio of the 5 sets of normal data is calculated by diagnostic model asΔ 1 , Δ9 2 , ⋯ , ΔX 1 , and ΔY 1
ΔY& 1 ZΔY 1 , ΔY9 1 , ⋯ ΔY3 1 [, \ 4001, ^
1,2, ⋯ 5. The error between the 5 sets of likelihood ratios is
calculated by means of the root mean square error. The error in fault state is calculated in the same way, Δ 0 , Δ90 , ⋯ , ΔX0 , ΔY 0 ΔY& 0 ZΔY 0 , ΔY9 0 , ⋯ ΔY3 0 [. The formula is as follows:
δ,a b G3∑ /Δ3&' &7 Δa&19H 9 c
(12)
δ,a 0,1 G3∑ /Δ3&' & 0 7 Δa& 1 19H 9 c
(13)
E b ∑ δXa' ,a b (14)
E 0,1 ∑ δXa' ,a 0,1 (15)
s 0or1.i, j 1,2, ⋯ 5. i k j.
δl,m 1 is the root mean square (RMS) errors in group i
shown in Figure 5.
Figure 5. Error Comparison.
From Figure 5, the error in different running states is much larger than the error between the same running states. Therefore, the elevator fault diagnosis model based on SPRT is reliable and effective.
6. Conclusion
This paper mainly studies the elevator fault diagnosis method based on SPRT, and established the elevator fault diagnosis model. Through data preprocessing, representative value extraction and sequential probability test, the model can finally obtain the fault diagnosis results for a typical elevator. By introducing the idea of sequential sampling, the sample required for the diagnosis do not need to preset in the model, which improve the diagnosis efficiency of the model to a certain extent. And the effect of insufficient or redundant samples on the diagnosis results is avoided. Through the existing data samples, it is proved that this method has higher accuracy and reliability. Therefore, the elevator fault diagnosis method based on SPRT is very effective in elevator fault diagnosis, and has wide applications.
Acknowledgements
This work was supported by Guangzhou Science and Technology Plan Project Industry-University-Research Cooperation Collaborative Innovation Major Projects (201604040005)
References
[1] Li HuiSheng. “Elevator control technology”, Machinery Industry Press. pp. 59-63 (1996).
[2] Li Wei, Zhu Yun, Mao Haijie, et al. “Pipeline Leak Detection Based on SPRT and Wavelet Transform”, Computer Measurement & Control. 13 (9), pp.903-904+907 (2005). [3] Yang Yang, Zhao Guojun, Liu Zheng. “Expert Systems for
Elevator Controller Fault Diagnosis”, Techniques of Automation and Applications. 21 (5), pp.40-42 (2002). [4] Li Gang. “Research on safety evaluation technology and
method of long service elevator”, South China University of Technology. (2014).
[5] Zhang Fuen, Wu Naiyou Zhang Jinling, Li Yanggeng. “Principle, design and safety maintenance of AC speed control elevator”, Machinery Industry Press. (30), pp.77-79 (1999). [6] Wald A. “Sequential Analysis”, New York: Wiley. (1947). [7] Yu Chenggang, Su Bingjing. “A non-parametric sequential
rank-sum probability ratio test method for binary hypothesis testing”, Signal Processing. (84), pp.1267-1272 (2004). [8] Chen Xiru. “An Introduction to Mathematical Statistics”,
Beijing: Science Press. (1983).
[9] Fan Xianfeng, Jiang Xingwei. “Signal de-noise based on wavelet packets transform”, Journal of Harbin Institute of technology. 35 (7), pp.809-811 (2003).