Optimizing the Current Ramp-Up Phase for Hybrid ITER
Scenario
∗
)
Dick HOGEWEIJ, Jean-Francois ARTAUD
1), Tom CASPER
2), Jonathan CITRIN,
Frederic IMBEAUX
1), Florian K ¨
OCHL
3), Xavier LITAUDON
1), Irina VOITSEKHOVITCH
4)and the ITM-TF ITER Scenario Modelling Group
FOM Institute DIFFER - Dutch Institute for Fundamental Energy Research Association EURATOM-FOM, Trilateral Euregio Cluster, P.O.Box 1207, Nieuwegein, The Netherlands
1)CEA, IRFM, F-13108 Saint Paul lez Durance, France
2)ITER Organization, F-13115 Saint Paul lez Durance, France
3)Association EURATOM- ¨OAW/ATI, Atominstitut, TU Wien, 1020 Vienna, Austria
4)EURATOM/CCFE Fusion Association, Culham Science Centre, Abingdon OX14 3DB, UK
(Received 24 November 2011/Accepted 8 April 2012)
This paper reports on a systematic effort to optimize the current ramp-up phase for the ITER hybrid scenario, and to assess the sensitivity of the results to the assumptions made.
c
2012 The Japan Society of Plasma Science and Nuclear Fusion Research
Keywords: ITER, hybrid scenario, modelling, current ramp-up DOI: 10.1585/pfr.7.2403063
1. Introduction
The current ramp-up phase of ITER is a critical stage: MHD instabilities have to be avoided, flux consumption has to be minimized, and this has to be achieved within the narrow operational window of ITER. Ramp-up for the hybrid scenario is more critical than for the standard (H-mode) scenario, since the q profile must be shaped care-fully: qminshould stay near or slightly above 1 and, for an
optimized fusion performance, the q profile should have the typical hybrid shape with a wide flat region [1]. This paper reports on a systematic effort within the ITER Sce-narios Modelling working group (ISM), part of the Euro-pean Integrated Tokamak Modelling (ITM) Task Force, to optimize the current ramp-up phase for the ITER hybrid scenario, and to assess the sensitivity of the results to the assumptions made.
Validation on the ramp-up phase of JET, AUG and Tore Supra [2, 3] has shown that both empirical scaling based models and the semi-empirical Bohm/gyro-Bohm model (L-mode version, ITB shear function off, [4]) yield a good reproduction of this phase for considered discharges, in terms of Te and q profile and li. Therefore these two
models have been used in the reported work, which was carried out with the CRONOS integrated suite of codes [5]. For the scaling based model a fixed radial shape of the heat diffusion χe,i(ρ,t) = A(t)(1+6ρ2 +80ρ20) is used,
where A(t) is adjusted at each call of the model such that the plasma thermal energy content Wth follows a known
scaling expression, e.g. the ITER-97L (L-mode) scaling author’s e-mail: g.m.d.hogeweij@differ.nl
∗)This article is based on the presentation at the 21st International Toki
Conference (ITC21).
[6] or the IPB98 (H-mode) scaling [7]. Since confinement during the ramp-up phase is weaker than standard L-mode, a scaling factor smaller than 1 was needed in both cases: the optimal (and similar) agreement between experiment and simulations in the current ramp-up dataset was ob-tained using LITER97L=0.6 and HIPB98=0.4, respectively.
Here we will use the IPB98 scaling with HIPB98=0.4.
2. Assumptions Made
Following assumptions were adopted from the ITER team:
(i) An expanding ITER shape is used, starting on the LFS of the torus, with initial plasma volume50 % of the final plasma volume. X-point formation takes place after 15 s, when Ip=3.5 MA.
(ii) A flat Zeff profile is assumed, decreasing in time with
increasing density, with an asymptotic value of 1.7 [8]. (iii) A rather low density of ne=0.25·nGwe is taken.
The neprofile is assumed to be parabolic with a
mod-erate peaking factor ne(0)/ne = 1.3. This is a
compro-mise between the (unrealistic) flat neprofile often used in
ITER scenario predictions and the peaking factor of1.5 predicted by scaling studies [9].
The total input power should stay below the L-H threshold during the whole ramp-up phase; for the refer-ence case PLHthr29 MW at end of the current ramp-up.
Other assumptions (Te,i(edge), initial Te,iand li) are based
on experimental evidence from e.g. JET, AUG and Tore Supra [2, 3].
The Ip ramp rate is chosen such that Ip =12 MA is
reached after 80 s. The simulations start 1.5 s after
break-c
2012 The Japan Society of Plasma
down, when Ip=0.5 MA.
3. Choice of Heating and Current
Drive Scheme
The ITER design and limitations are used, e.g. the de-signed geometries of the heating systems are used; NBI is only allowed ifne ≥2·1019m−3; NBI can only be applied
at half or full power (i.e. 16.5 or 33 MW).
The logical way to get at the hybrid q profile is as fol-lows: let the discharge evolve without additional heating until q(0) close to 1, and then apply off-axis heating and CD to clamp q(0) and broaden the q profile. For the typ-ical plasma conditions during the ramp-up phase, ECRH from the equatorial launcher deposits very centrally, so is unsuitable for this purpose; ICRF can, due to its wide range of frequencies, deposit on- and off-axis; however, ICRF can only efficiently drive current when deposited on-axis [10], so is also not very useful for this purpose. The remaining heating and CD options are: NBI using the off -axis setting, i.e. with deposition radiusρdep ∼0.3, LHCD
(withρdep∼0.4−0.6 depending on plasma conditions) and
the Upper Port Launcher (UPL) of ECCD. The latter has 2 antennas with different ranges of poloidal angles, with ρdep ≥0.4 and 0.6, respectively. Since ECCD and LHCD
have quite narrow power deposition profiles, excessive use of one of these as only current drive source would yield a very localized net CD profile, leading to locally a strong negative shear, which should be avoided because of the risk
Fig. 1 Driven current density profiles, plotted vs. normalized toroidal flux coordinateρfor the reference case at 80 s. A balanced mix of sources is used: 8 MW of ECCD from one of the UPL antennas (blue), 3 MW of LHCD (red) and 16.5 MW of NBI (green). Also shown is the bootstrap current density (magenta) and the total non-inductive driven current density (black). If the total input power were allowed to exceed PLHthr, some power from
the other UPL ECCD antenna could be added for an even more smooth total driven current density profile; the blue dashed line shows the driven current density for extra 5 MW of ECCD.
of triggering unwanted MHD. Therefore it is better to use a combination of CD sources in such a way that the CD is spread over a wide off-axis zone, thus compensating for the peaked ohmic drive. Figure 1 gives an example of this.
4. Reference Case
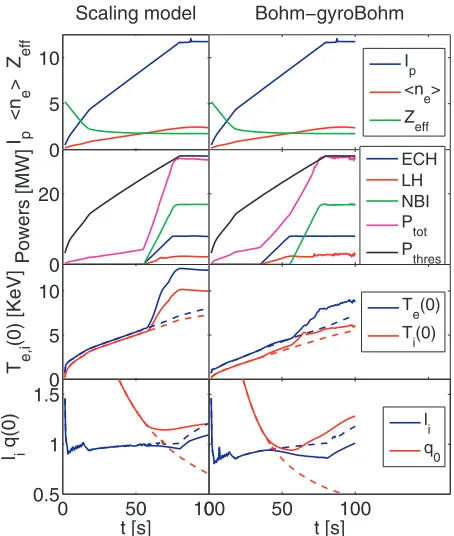
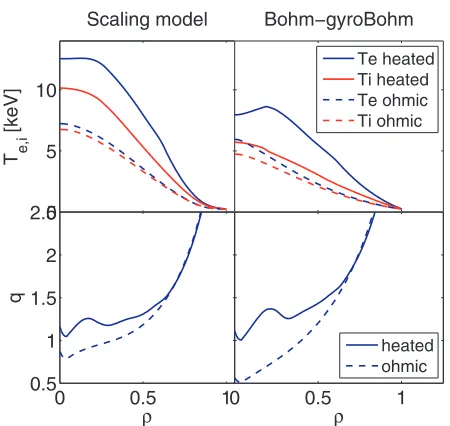
Figure 2 shows the optimized scenario, as sketched in the previous section, for the reference case using the scaling model (full lines). Figure 3 shows the profiles of
Te,iand q at the end of the Ip ramp-up. For reference the
figures also show the result without any additional heating. As seen from Fig. 3 a good hybrid q profile is reached at the end of the ramp-up.
By post processing the simulation results with the free boundary equilibrium code FREEBIE, run in Poynt-ing mode, it has been checked that the reference case, both with and without additional heating, is safely within the boundaries put by ITER coils. Figure 4 shows the currents in the most critical coils.
Since the LHCD system is not foreseen in the ITER baseline, is is important to assess the importance of LHCD for the results. Although LHCD can strongly modify the q profile in the early phase of the ramp-up, its effect on the q profile at the end of the ramp-up is rather modest, i.e. a scenario with LHCD replaced by extra ECCD yields a q profile which is only slightly less flat. However, it
Fig. 2 Time traces of the optimized scenario for the reference case, assuming scaling model (left panels) or Bohm/ gyro-Bohm model (right panels). For comparison the figure also shows the time traces of Te,i(0), liand q(0) without
Fig. 3 Te,i and q profiles for the same cases and with the same
line coding as the previous figure.
Fig. 4 Some of the coil currents as calculated by FREEBIE. Shown are the currents in the two most critical coils: the central solenoid coils CS1ULU+CS1ULL, and the poloidal field coil PF1, for a typical heating scheme (full red lines) and for a case with only ohmic heating (dashed red lines). The maximum and minimum allowed currents are plotted in black.
should be noted that LHCD is the most effective current drive source. Hence LHCD can play a strong role in re-ducing the flux consumption during the ramp-up phase; a reduction of∼15 % can be reached, which would be suffi -cient to extend the flat top phase by hundreds of seconds.
5. Sensitivity Analysis
Of course the optimized scheme is dependent on the chosen transport model. The Bohm/gyro-Bohm model pre-dicts ∼ 30 % lower temperatures than the scaling model, and therefore a faster current penetration; this is accounted for by switching on ECCD and LHCD 20 s earlier (Fig. 2, dashed lines). As seen from Fig. 3 also in this case a good hybrid q profile is reached at the end of the ramp-up.
Regarding sensitivity of the results to the assumptions,
Fig. 5 Effect of flat or extra peaked ne profile. Plotted are ne
and q profiles at 80 s for the 3 cases (see legend), with-out (dashed lines) and with adapted heating scheme (full lines).
following parameters were varied: Te,i(edge) (by 40 %), ne
(by 40 %), neprofile shape (parabolic vs. flat) and Zeff. We
will only consider the scaling model (HIPB98 =0.4) here;
the sensitivity of the simulations to these changes when using the Bohm/gyro-Bohm model is quite similar and can be accounted for in the same way.
(i) varying edge Te gives only a modest change of li (
0.04) and a tiny change of q, so poses no problem. (ii) nepeaking: A more peaked ne profile would cause a
decreased peaking of Te, hence a faster current diffusion.
Indeed in an ITER ramp-up without additional heating, in this case the time that q(0) reaches 1 (t(q0=1)) is shifted
forward by∼10 s. This can be compensated for by a cor-responding earlier start of the additional heating. The op-posite trend applies in case of a flatter neprofile and is
ac-counted for in a similar way by delaying the heating. See Fig. 5.
(iii) Zeff: A 40 % higher/lower value of Zeff causes a
faster/slower current diffusion, and a shift of t(q0=1) of ∼10 s, which can be compensated for like the previous case.
(iv) ne: We only consider the effect of a 40 % higher ne.
Again this causes (due to lower Te) faster current diffusion.
Since now also PLHthris higher by 10 MW, the applied
power can be higher by this amount; moreover higher ne
allows earlier application of NBI. The thus adapted heat-ing scheme, together with the time traces of liand q(0), is
shown in Fig. 6. In this way the the flat q profile is restored, see Fig. 7.
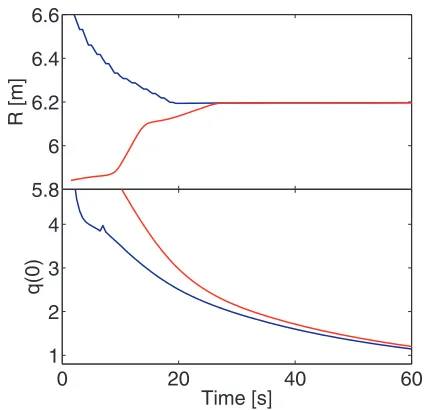
Recently the ITER team is considering breakdown at HFS instead of at LFS. The different geometry in the very early phase of the discharge leads to a modified current dif-fusion. However, the effect on the current density evolution turns out to be negligible after∼40 s, see Fig. 8.
6. Extrapolation to Burn Phase
impor-Fig. 6 Time traces of powers, q(0) and li for the high ne case
with the heating scheme of the reference scenario (left) and with adapted heating scheme (right). For comparison the lower panels also show the time traces of q(0) and liof
the reference scenario (dashed lines). Without modified heating scheme, q(0) drops far below 1 and li rises too
high (i.e. above 1); these unwanted features are avoided with the adapted heating scheme.
Fig. 7 Profiles of Teand q at 80 s for the same cases as Fig.6.
tant: how does the q profile react to the L-H transition, and can q be held stationary during the long flat top.
Regarding the first question: based on the reference case, preliminary simulations were done to assess the evo-lution of the q profile during the L-H transition. To this end, in a time window of 20 s immediately after the end of the current ramp-up, the external (NBI+ECRH) power was raised to 70 MW, i.e. clearly above the L-H
thresh-Fig. 8 Time traces of R0 and q(0) for the normal breakdown at
LFS (blue) and for alternative breakdown at HFS (red).
old, and in the modelling the L-H transition was forced by imposing a pedestal of 4 keV. At the same time the den-sity was raised to the target denden-sity for the hybrid scenario (∼9·1019m−3). It turned out that during this transition the q profile was preserved very well.
The second question has already been addressed in earlier work, which showed that, under reasonable assump-tions for the pedestal, indeed the q be held stationary dur-ing the long flat top [1].
7. Conclusions and Outlook
The heating systems available at ITER allow, within the operational limits, the attainment of a hybrid q pro-file at the end of the current ramp-up. This is reached by a combination of NBI, ECCD (UPL) and LHCD. A heat-ing scheme with only NBI and ECCD is only slightly less effective the target q profile; however, LHCD can play a crucial role in reducing the flux consumption during the ramp-up phase.
The optimum heating scheme depends on the chosen transport model. Moreover, modified assumptions on ne
peaking, edge Te,iand Zeffcan be easily accounted for by a
shift in time of the heating scheme. A higher density dur-ing the ramp-up phase can be accounted for equally well, and might even be profitable because it gives more freedom in the application of the heat sources.
The sensitivity of the current diffusion on parameters that cannot be controlled, shows that development of real time control is important to reach the target q profile. On the positive side, this paper also shows that the effect of a deviation of the assumed plasma parameters, like Zeff or
peaking of ne, can be accounted for in a straightforward
way, i.e. in a way suitable for a controller.
The effect of faster Ipramp will be the subject of
Acknowledgements
This work, supported by the European Commu-nities under the contract of Association between EU-RATOM/FOM, was carried out within the framework of the European Fusion Programme with financial support from NWO. The views and opinions expressed herein do not necessarily reflect those of the European Commis-sion. This work is supported by NWO-RFBR Centre-of-Excellence on Fusion Physics and Technology (Grant nr. 047.018.002).
[1] J. Citrin et al, Nucl. Fusion 50, 115007 (2010).
[2] G.M.D. Hogeweij et al, Proc. 37th Eur. Conf., 2010, CD-ROM file P1.1041.
[3] F. Imbeaux et al, Nucl. Fusion 51, 083026 (2011). [4] M. Erba et al, Nucl. Fusion 38, 1013 (1998). [5] J.-F. Artaud et al, Nucl. Fusion 50, 043001 (2010). [6] S.M. Kaye et al, Nucl. Fusion 37, 1303 (1997).
[7] ITER Physics Basis 1999, Nucl. Fusion 39, 2137 (1999). [8] V. Lukash et al, Plasma Devices and Oper. 15, 283 (2007). [9] H. Weisen et al, Nucl. Fusion 45, L1 (2005).