Implementation of a Novel Real-Time Controller for the Detection
and Tracking of Magneto-Hydrodynamic Instabilities on the JET
Tokamak
Duccio TESTA, Hervé CARFANTAN
1), Alex GOODYEAR
2)and JET-EFDA contributors
∗,3)Ecole Polytechnique Fédérale de Lausanne (EPFL), Centre de Recherches en Physique des Plasmas (CRPP), Association EURATOM – Confédération Suisse, Lausanne, Switzerland
1)Université de Toulouse, Institut de Recherche en Astrophysique et Planétologie, Centre National pour la Recherche
Scientifique, Toulouse, France
2)Culham Centre for Fusion Energy, Culham Science Centre, Abingdon, United Kingdom
3)JET-EFDA, Culham Science Centre, OX14 3DB, Abingdon, UK
(Received 8 October 2012/Accepted 10 September 2013)
In this work we present the technical implementation of a digital VERSA Module Eurocard (VMEbus) system used to detect and track, in real-time, magneto-hydrodynamic instabilities on the JET tokamak. This VMEbus system runs on a 1 ms clock cycle and performs the unsupervised detection and real-time tracking of the individual components in a multi-harmonic spectrum of coherent electro-magnetic instabilities, actively driven by a set of in-vessel antennas. Its main real-time output signals are the frequency, amplitude, toroidal mode number and damping rate of such modes. Moreover, this controller also provides some of the protection and control tools for the antenna system, such as the reference for the voltage and current control waveforms, and a trip signal related to the shorted-turn protection of the antennas. Current applications of this novel controller focus on the measurement of the damping rate of Alfvén Eigenmodes with different toroidal mode numbers. The successful technical implementation and scientific exploitation of this innovative VMEbus system opens possibilities for the real-time detection and the ensuing control of electro-magnetic instabilities in other present and future fusion devices.
c
2014 The Japan Society of Plasma Science and Nuclear Fusion Research
Keywords: MHD modes, real-time detection, real-time control DOI: 10.1585/pfr.9.1405003
1. Introduction
Analysis of electro-magnetic fluctuations is impor-tant for understanding and controlling the magneto-hydrodynamic (MHD) stability of magnetically confined thermonuclear plasmas. Specifically, the problem of unsu-pervised real-time detection of MHD modes has now be-come one of the most important aspects for machine pro-tection and control of plasma discharges in thermonuclear fusion experiments. The method routinely used for this analysis involves sampling a (usually rather) small set of input signals, such as measurements of magnetic, density and temperature fluctuations, which in most cases are un-evenly sampled in the spatial domain. Appropriate pro-cessing of such a set of input data facilitates the detection of the different components in a multi-harmonics spec-trum. Furthermore, when the data contains some spatial periodicities, these can be readily used to enhance or elim-inate the detection of certain components. A retime
al-author’s e-mail: [email protected]
∗Appendix of F. Romanelli, “Overview of JET Results”, Nuclear Fusion 51 (2011), 094008 (Proceedings of the 23rdIAEA Fusion Energy Con-ference 2010, Daejeon, Korea).
gorithm can then generate a global alarm that is sent to the plant. Under certain specified and pre-determined op-erational conditions, this may then trigger a feedback con-trol mechanism. For some examples of these activities, the Readers are referred to Chapter 3 and Chapter 7 and ref-erences therein in [1] and Chapter 2 and refref-erences therein in [2].
One drawback of most of the current MHD detec-tion and control methods is that they can only detect modes when they have become unstable (with a growth rateγGROWTH > 0), i.e. when they may have already had some detrimental effect on the actual plasma operation and performance. On the other hand, an alternative and inno-vative method is in use on the JET tokamak. This diagnos-tic technique combines the active excitation (via a set of in-vessel antennas) of magnetic field perturbations which have a very small amplitude at the plasma edge (maximum intensity |δBDRIVEN| < 100 mG, i.e. typically∼105 times smaller than the value of the toroidal magnetic field in JET, BTOR ∼ 1 T to BTOR ∼ 4 T) with synchronous real-time detection of the resonant plasma response to such antenna-driven perturbations. This method then allows detecting
c
2014 The Japan Society of Plasma
MHD modes when they are still stable (with a damping rateγDAMP > 0), i.e. before they could have affected the discharge, which is evidently a much more satisfying situ-ation for plasma control and machine protection.
This JET diagnostic system is the so-called Alfvén Eigenmodes (AEs) Active Diagnostic (AEAD) [3], as its original (and still currently predominant) aim is to de-tect AEs [4–7]. Its real-time controller, the Alfvén Eigen-modes Local Manager (AELM), constitutes one essential and furthermore worldwide unique component of the JET Real Time Data Network (RTDN). The measurement of the mode characteristics, such as the frequency, the am-plitude, the toroidal mode number and the damping rate, are obtained in real-time through calculations performed on a sub-millisecond time scale by the AELM software. This data is then passed to the Real Time Signal Server (RTSS) [8], which allows implementing a real-time con-trol and feedback system for the modes detected with the AELM by measuring the distance from the marginal sta-bility limitγ/ω=0, and calling for a reaction of the plant when the plasma is approaching the limit during the dis-charge.
This paper presents the technical implementation of the AELM hardware and software infrastructure, with a specific focus on the application to the sub-millisecond de-tection, discrimination and real-time tracking of the in-dividual components in the multi-harmonic, frequency-degenerate spectrum of stable AEs which are excited in the JET tokamak by an array of in-vessel antennas used for MHD diagnostic purposes. This paper is organized as follows. Section 2 gives a short overview of the AEAD system. In Sec. 3 we present a complete technical overview of the AELM system used in JET, with particular attention to its real-time plant control and data analysis hardware and software. Section 4 focuses on the setup of the real-time mode detection and tracking algorithm used in the AELM. Section 5 then shows some illustrative examples of the detection and discrimination between the different toroidal components in a multi-harmonic spectrum of sta-ble AEs. In Sec. 6 we present some statistical analysis of the accuracy of the different algorithms used by the AELM for the real-time mode detection and tracking. Then, in Sec. 7 we summarize our results and give an outlook to-wards future work. Appendix A reviews the mathematical foundation of the Sparse Representation method and of the SparSpec code, which is used to extract, both in real-time and post-pulse, the frequency, amplitude, toroidal mode-number and damping rate of the modes actively driven by the AEAD system, its optimization for implementa-tion within the AELM, and an assessment of its real-time numerical performance. Additionally, some applications of the SparSpec algorithm other than those related to the JET AELM system are also presented, always focussing on the analysis of magnetic fluctuation in JET tokamak plasmas. Finally, the supplemental information contained in Appendix B provides more technical details on the
im-plementation of a number of functionalities of the AELM hardware and software, so as to facilitate practical under-standing of the software and hardware infrastructure re-quired to design, implement and routinely operate such a real-time controller.
2. The Alfvén Eigenmodes Active
Di-agnostic System in use at JET
The MHD spectroscopy technique is a diagnostic tool that uses global waves naturally supported by the plasma with the aim of measuring the parameters that determine their dispersion relation, their absorption and propagation, and the damping and growth of these waves [9, 10]. A sim-ple active method to drive and detect low amplitude modes in the plasma was pioneered and used in many different plasma conditions in the JET tokamak [3]. This is the so-called Alfvén Eigenmodes Active Diagnostic (AEAD) sys-tem, as its main aim was (and currently still is) that of driv-ing and detectdriv-ing plasma Eigenmodes in the Alfvén fre-quency range. Technical details on the AEAD system used at JET can be found in [3, 11–15] and references therein, and here we only present a brief overview.
As schematically shown in Fig. 1, the two main com-ponents of the AEAD system are:
1. the AE exciter, which is built upon a function gener-ator and a single broadband high-power amplifier op-erating in class-AB mode; the amplifier is then con-nected to a set of up to eight in-vessel antennas via distribution and isolation transformers and a∼200 m long transmission line;
2. the AE receiver, which is built upon synchronous de-tection units and real-time data analysis.
The AEAD exciter operates in the 10 kHz to 500 kHz frequency range, with maximum capabilities of 5 kW/1 kV/15 A-peak delivered into a 50Ω load. This exciter produces a very small magnetic perturbation at the plasma edge, with maximum intensity of the order of max(|δBDRIVEN|) ∼ 0.1 G, which is ∼105 times smaller than the typical value of the toroidal magnetic field in JET, BTOR ∼ 1 T to BTOR ∼ 4 T. The AEAD receiver collects signals from a set of in-vessel detectors for electro-magnetic fluctuations, such as magnetic pick-up coils, electron cyclotron emission and reflectometry measurements. This receiver is also connected to the AELM to allow for the real-time detection and tracking of the plasma resonant response to the antenna-driven magnetic field perturbation.
Fig. 1 A schematic overview of the AEAD system in JET. The toroidal field, plasma density and plasma current are retrieved from the RTSS and can be used by the AELM to compute in real-time an initial guess for the antenna excitation frequency freq(t). The AELM then converts this value to a time-dependent voltage V(t) and sends it as a Voltage Controlled Oscillator (VCO) input signal to the function generator which, in turn, converts it back into a frequency freq(t). This signal then drives a 5 kW amplifier connected to up to eight in-vessel antennas via isolation and distribution transformers and a∼200 m long transmission line (not shown). It is also used to provide the pulsed synch-OUT/IN reference for the synchronous detection units. These modules collect a selection of fluctuation and engineering measurements, some of which are also sent back to the AELM for feedback control of the AEAD plant and for mode detection and tracking.
acquisition system and removes the need for computation-ally expensive Fast Fourier Transform (FFT) algorithms to obtain the required frequency component. For the specific case of the AEAD system, we use a 1.25 kHz sampling rate for detecting modes whose frequency can reach 500 kHz, whereas real-time FFT algorithms based on the Nyquist criterion would require a 1 MHz sampling rate, i.e. need-ing an 800 times larger bandwidth and storage capabilities for the data acquisition. Synchronous detection also allows removing all undesired frequency components, hence dra-matically improving the signal-to-noise (S/N) ratio. The AEAD hardware for synchronous detection works concep-tually by applying a frequency mixer with the synchronous in-phase (I) and quadrature (Q) components to the incom-ing differential signal, and then applying a low-pass fil-ter with a<100 Hz bandwidth to generate the output [co-sine (I), [co-sine (Q)] DC components. The final output band-width of the AEAD synchronous detection system is then 500 kHz.
3. The Alfvén Eigenmode Local
Man-ager
One essential and worldwide unique component of the AEAD system is the AELM. The AELM is a VERSA Module Eurocard (VMEbus) plant control system, used to monitor and control both the engineering and the scientific aspects of the AEAD plant operation. The AELM operates in real time using a 1 kHz clock derived from the Com-posite Time and Trigger System (CTTS), which is used to synchronise the JET diagnostic and control systems dur-ing an experiment. This 1 kHz clock, i.e. a 1 ms clock cycle, is specified by the requirement for integrating the AELM within the CTTS system and translates into severe data acquisition and processing constraints for the AELM. Synchronous detection is therefore essential for the AELM real-time application, as only a limited amount of process-ing can be performed within this 1 ms clock limit. Further-more, as the protocols for input/output data communica-tion with the other elements of the JET plant take around 100µs to 150µs to complete, all AELM calculations need to be concluded in less than 850µs for every 1 ms clock cy-cle, otherwise an alarm is raised and the AELM will stop processing and return to a safe state. In this respect, the AELM is a hard real-time embedded system: the results of missing a deadline are classed as a failure. For JET oper-ation this results in, at best, missing data and/or a wasted experiment, i.e. avoiding the worst case, which would be damage to the AEAD or to the JET machine itself. This is contrary to a soft real-time embedded system, which would simply produce a reduced quality of service, such as a Graphical User Interface suffering sluggish mouse re-sponse.
The AELM receives the feedback inputs from the AEAD system via analogue-to-digital converter (ADC) modules called VAJ1. The input data consists of 2×8
sig-nals (labelled AELM-SIG channels, with each signal hav-ing the real and imaginary component acquired separately) used for mode detection and 2×22 engineering signals (labelled AELM-NORM channels, again each signal hav-ing the real and imaginary component acquired separately) used for the AEAD plant control and the normalization of the antenna-driven excitation spectrum. The AELM-SIG channels can be chosen by manually patching to the AELM inputs a suitable selection of measurements from: mag-netic pick-up coils mounted on the low- and high-field side vessel walls (16 signals available in total for selection), density fluctuation measurements obtained from X-mode (8 signals available in total for selection) and O-mode re-flectometry (10 signals available in total for selection), and electron temperature fluctuation measurements (92 signals available in total for selection) obtained from electron cy-clotron emission spectroscopy. The AELM-NORM chan-nels are obtained from current (24 signals available in total for selection) and voltage (23 signals available in total for selection) measurements taken at different points along the transmission line. Two frequency deviation signals from the Ion Cyclotron Resonance Frequency (ICRF) antennas are also supplied as input to the AELM, and can be used for the RF beat-wave control operation [16].
Finally, the RTDN system supplies the AELM with some of the plasma parameters measured in real-time. These are the toroidal magnetic field and the toroidal plasma current, the line-integrated plasma density obtained along a vertical chord passing through the plasma centre, and a flag indicating whether the running plasma configu-ration is a limiter or an X-point one. These signals can be used to compute in real-time the driving frequency for the in-vessel antennas, for instance the AE frequency. Figure 3 shows a schematic diagram of how the AELM fits into the RTDN.
Fig. 3 A schematic diagram of the AELM hardware, illustrating its interfaces with the Real Time Signal Server (RTSS) and the Central Time and Trigger Signal System (CTSS), and the input and output connections to the AEAD plant via the VAJ1 cards and the Ion Cyclotron Resonance Frequency (ICRF) heating system for real-time control of the RF beat-wave operation. The black-dotted line separates the AELM-proper environment, which includes the VAJ1 cards, from the “outside” world.
the AE frequency, which is given by: FREF[kHz]=(multiplier)
× BTOR
4πRRESqRES
mp
i niAi
. (1)
Here BTORis the toroidal magnetic field, niand Aiare the density and atomic mass of all ion species, mpis the proton mass, qRES(rRES)=(2m+1)/2n is the value of the safety factor at the mode resonant position RRES = R0+rRES, where R0is the magnetic axis position, r the minor radius coordinate, and m and n are the AE poloidal and toroidal mode numbers, respectively. The quantity multiplier de-fines which class of AEs is being investigated: multiplier= 1 is used for Toroidal AEs (TAEs) and multiplier =2 for ellipticity-induced AEs.
The AELM also generates two other outputs without feedback, which are sent to the AEAD control electronics. The first one consists of an amplitude waveform used as the reference current (IREF) in an Active Gain Control (AGC) feedback amplifier loop. This waveform defines the target nominal antenna current that needs to be achieved during the discharge, generally set at a constant value (but with a ramp-up and ramp-down at the start and end of the pulse). The IREFsignal is a DC voltage ranging from 0 V to 10 V corresponding to a setting of 0 % to 100 % with respect to the nominal maximum current set in the AEAD hardware. The 100 % IREF setting corresponds approximately to an antenna current IANT=15 A-peak and to an amplifier
cur-rent ITOT =25 A-peak, both values taken at 200 kHz. The second output, also sent to the AGC, defines the maximum permissible voltage (VLIM) allowed on the antennas, be-yond which the AGC gain will be reduced. This is a DC voltage ranging from 0 V to 10 V corresponding to a max-imum antenna voltage VANT =2 kV-peak at 200 kHz.
be-tween the plasma and the vessel potential, which is picked-up by the in-vessel antennas in their earth return circuit, and appears in the synchronous measurements as a very large and rapid variation in ZANT[17]. By setting a suitable alarm threshold (see Appendix-B4 for further details), the occurrence of these S/T trips has protected the in-vessel antennas without causing problems for the scientific oper-ation of the AEAD system.
The AELM crate contains four main components. 1. A VMEbus Crate Service Module: this is a JET
“home-grown” module and acts as the VMEbus sys-tem controller, providing timer/trigger synchroniza-tion with plant systems; it also monitors the VME-bus crate voltages, temperatures and airflow for oper-ational control (plant failure).
2. A Real-Time Processor (RtProc): this is a commer-cial off-the-shelf (COTS) Emerson Network Power MVMEbus5500 card with a 1 GHz PowerPC and 512 MB RAM; this card executes software running under the Wind River VxWorks operating system (i.e. the same software used in the NASA’s Mars rovers, Spirit and Opportunity), but during a JET pulse the main real-time process is “locked”, so that context switching is disabled and most interrupt sources are masked.
3. A Communications Processor (CommsProc): this is a COTS Emerson Network Power MVMEbus5100 card with a 400 MHz PowerPC and 64 MB RAM; it is linked to both the JET real-time Asynchronous Trans-fer Mode (ATM) and Ethernet networks and isolates the RtProc from asynchronous events that might dis-rupt its deterministic 1 kHz calculation cycle time, hence guaranteeing deterministic message delivery; the CommsProc also executes software running un-der the WindRiver VxWorks operating system, and it is used to setup pre-pulse information, synchronize the RtProc with the main time points within the pulse and communicate data recorded during the pulse for archiving.
4. Four COTS Pentland Systems MPV956 analogue and digital input/output cards (VAJ1): these cards are con-figured to use differential analogue inputs and sample 32 input signals (8 for mode detection, 24 for plant control); these cards are also used to send calculated analogue signals to control the power and frequency of the AEAD plant in real time.
The CommsProc basically coordinates external messages during all phases of the JET experiment (i.e. a JET pulse), such as:
• continuous monitoring of both hardware and soft-ware: this ensures that the AEAD is stopped if any asynchronous termination events are generated by the JET protection system;
• continuous monitoring of both hardware and software
to provide a coarse, 2 sec AELM system health and data update for the control room computers: this en-sures that pulses cannot be started if the system is not ready and “slow” graphical displays in the con-trol room are updated with data throughout the pulse; • parameter initialisation: the AELM requires approxi-mately 200 setup parameters per pulse (not all change every pulse and they are managed using a separate GUI); any derived parameters are calculated at this moment to avoid unnecessary work during a pulse; • real-time experiment control communications,
oper-ating as a two way street: the AELM provides real-time values for use by other systems to help manip-ulate their actions during a pulse, and similarly the AELM can receive externally generated instructions for controlling, for instance, the operating frequency for the in-vessel antennas.
• post-pulse data archiving: the AELM records several megabytes of raw ADC and processed data during a pulse, which are archived onto a data warehouse for post-pulse analysis.
The CommsProc can basically be thought of as a synchro-nization module with four available states:
a) waiting for the next experiment to start: the CPU per-forms basic periodic environment and systems checks to ensure that all hardware and software are running correctly and the networks are able to send and re-ceive “keep alive” data packets;
b) initialization for the next experiment: the CPU re-ceives all the parameters for the experiment and con-figures the hardware and software accordingly; c) pulsing/performing the experiment: the CPU
synchro-nizes the sending and receiving of data over the real-time ATM network and triggers the RtProc based upon a 1 kHz clock interrupt from the Crate Ser-vice Module; the CommsProc ensures that the AEAD plant ceases to operate if there is a CPU failure or an external systems failure terminating the experiment prematurely;
d) data collection: the CPU halts the RtProc and returns all the data collected to the JET database archiving system for post-pulse analysis and simulation of plant operation.
Fig. 4 The AELM configuration panel, shown here for operation with the SimpleSum algorithm and using frequency control via the real-time frequency of n=1 Toroidal Alfvén Eigenmodes.
dormant, and operates on the same 1 kHz clock cycle re-quired for compatibility with the CTTS system. The se-quence of this cycle is as follows:
a) read and pre-process the analogue signals from the I/O cards (taking usually∼70µs);
b) perform the calculations required for S/T detection on the 8 antennas, so that if a faster-than-normal change in the antenna impedance is identified, then the AELM will send a trip signal to the amplifier to suspend its output for 20 ms for plant protection (these calculations take usually ∼50µs); the user is able to configure the total number of trips tolerated before one (or more) antenna(s) is (are) permanently excluded from the remainder of the pulse (see Ap-pendix B.4);
c) perform mode detection, discrimination and tracking using one of two user-selectable options, described in Sec. 4 in more detail: the calculations performed in the SimpleSum mode take usually ∼100µs, whereas those required for the SparSpec mode usually take ∼650µs;
d) finally, the VCO frequency is calculated and sent back to the AEAD plant for the next time step, together with the requested IREFvalue (taking usually∼50µs). The selection of the run-time parameters for the
opera-tion of the AEAD system is performed via a configuraopera-tion panel, and Fig. 4 shows its main operating window for the SimpleSum algorithm when the real-time value of the fre-quency of n=1 Toroidal AEs (TAEs) is used for frequency control.
The real-time experiment control works on the follow-ing principles:
• the AELM provides signals to the RTSS systems and can also be controlled by them:
– the experiment server monitors 35 systems
pro-viding>1000 signals and can be used to control diagnostic, gas, heating and plasma shape con-trol systems; the experiment server uses a Mat-lab logic block style language to allow signals from a multitude of systems to be combined in algorithms to control gas, pellet and heating in-jection into the plasma;
– the protection server monitors 13 systems
pro-viding∼450 signals that are used to support ma-chine protection; the protection server uses sim-ple arithmetic and Boolean logic combinations to trigger the machine protection systems. • the real-time control data is routed over an
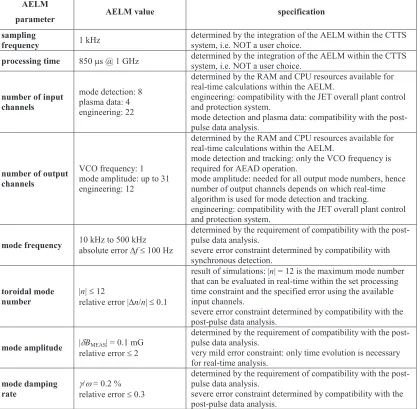
pro-Table 1 Physics and engineering constraints which need to be satisfied with the specific operational settings for the AELM.
vides guaranteed, deterministic message delivery; ATM networks were originally popular with telecoms companies because of their extremely high reliability (according to switch statistics at JET, none of the sys-tems connected to the RTDN have ever lost a packet of data in 10 years of operation); moreover, using a network infrastructure that differs from Ethernet en-sures that time sensitive data is not perturbed by non-urgent, general data.
The physics and engineering constraints that the specific operational settings for the AELM need to satisfy are sum-marised in Table 1, with more technical details given in Appendix B. In terms of the required accuracy in the data analysis, both real-time and post-pulse, we have set our-selves the high standard of trying to match the nominal tol-erances for the ITER measurement requirements for high-frequency instabilities [1, 70, 71], specifically with respect to the accuracy of the toroidal mode number determination.
This is very important as, for instance, a nominal 10 % or a±1 tolerance on the toroidal mode number determina-tion leads to very different requirements for the system de-pending on which “specific” mode number this tolerance is applied to. In terms of physics interpretation and for real-time plasma protection and control applications, wrongly interpreting the n=1 mode as an n=0 or an n =2 mode (i.e. n=n±1) clearly does not have the same implications as wrongly interpreting the n=5 mode as an n=6 or an n=4 mode, i.e. still having a±1 error on n.
and Alfvén Cascades. Conversely, a mode number mea-surement error ranging from±1 to±3 is deemed to be ac-ceptable for MHD instabilities which are only of “physics” interest, for instance core localized Alfvén Eigenmodes with|n|=6→20, for which the amplitude|δBMEAS|only needs to be measured within±30 %. The required post-pulse measurement accuracies on the mode amplitude and toroidal mode number and can then be summarized as fol-lows:
For real-time analysis, we aim at achieving the same post-pulse accuracy on the mode number for low-n modes up to n| ≤12, i.e. a relative error|Δn/n|=0 up to|n| ≤5 and|Δn/n|=1 for 6 ≤ |n| ≤12, whereas we are satisfied with an accuracy of a factor 2 in the measured mode am-plitude as the limitations in the computing resources of the AELM prevent setting a higher requirement.
For the measured damping rate, we require a post-pulse and real-time accuracy of better than a factor 2, and this particularly for small values of the damping rate, i.e. we require the capability of accurately distinguishing in real-time a small damping rateγ/ω=0.1 % from a slightly larger valueγ/ω=0.2 % as the first one is so close to the marginal stability limitγ/ω=0 that an alarm might have to be triggered so as to activate a feedback system, whereas the second one is sufficiently away from the marginal sta-bility limit that no alarm would need to be raised.
For the mode frequency, we set a required accuracy for its real-time determination of better than 100 Hz, so as to take advantage of the capabilities of the synchronous detection system, which gives us a post-pulse accuracy on the measured mode frequency of 100 Hz.
Finally, it is important to note here that many of the AELM parameters have to be set and their requirements have to be met for compatibility with the overall plant control and protection system of JET, i.e. these are not a user-choice. Conversely, the specific values and the error requirements on the mode frequency, amplitude, toroidal mode number and damping rate are essentially a user-choice which is set for compatibility with the post-pulse data analysis but has to be met within the set processing time and using the RAM and CPU processing speed avail-able for the AELM calculations in real-time: in some cases a trade-offexists between real-time RAM+CPU resources, and real-time vs. post-pulse physics requirements. Hence, a system upgrade (increase of RAM, increase of CPU pro-cessing speed, code parallelisation,. . .) will allow a more precise determination of these quantities together with the possibility of extending the measurement range and the scope and flexibility of the AELM and AEAD plant.
4. Setting the parameters for the
real-time detection and tracking of the
resonant plasma response to the
antenna-driven perturbations via
the AELM
When the tracking mode of operation has been se-lected, the AELM linearly sweeps the antenna frequency around the initial pre-defined FREFguess for the frequency of the modes to be detected and attempts to track in real-time the resonant plasma response to the antenna-driven magnetic field perturbation as the background plasma evolves. Using a selection of the eight input signals which are available in real-time for mode detection, the user can then select either the original SimpleSum or the recently developed SparSpec algorithm to derive one single ampli-tude and phase pair that will be used for mode detection and tracking.
Figure 5 shows an example of real-time tracking of TAEs together with a set of schematic diagrams illustrat-ing the basic workillustrat-ing ideas of the trackillustrat-ing algorithm as implemented in the AELM. In the full-frequency spectro-gram for the calibrated data of one magnetic pick-up coil (acquired at 1 MHz, see Fig. 5a) we find a very faint trian-gular waveform with amplitude|δB| ≈ 5 mG, performing a very narrow sweep in the frequency range 190 kHz to 230 kHz over the time window 4.50 sec to 12.50 sec. This trace corresponds to the magnetic field perturbation pro-duced by the AEAD system, which was set to scan around the central frequency of the n = 1 TAE gap: note that indeed a mode appears out of the background in this fre-quency range from time = 11 sec onwards. Apart from
the antenna-driven signal and this background instability, the magnetic fluctuation spectrum shows no other activ-ity in the entire frequency range up to 500 kHz. Fig-ure 5b shows a tracking representation of the signal syn-chronously detected at 1.25 kHz for the same magnetic pick-up coil (δBTAE). This tracking representation, where the quantity “time+|δBTAE|” is plotted as a function of the antenna driving frequency, immediately reveals the reso-nant characteristic of the plasma response to the antenna-driven signal, which is highlighted in the insert for clarity. The resonant plasma response to the antenna drive (the so-called antenna/plasma transfer function) is then analysed in real-time using a Lorentzian-type (i.e. and inverted bell-shape) model [3]:
δBTAE(ω,x)
= α(x)+iβ(x)
ω/
(2πfMEAS)
1−ω/(2πfMEAS)
2
1−2iγDAMP/(2πfMEAS)
.
(2a)
δBTAE(ω,x)= 1 2
N/2
k=1
Rk(x) iω−Pk +
R∗k(x) iω−P∗k
Fig. 5b Tracking representation of the magnetic fluctuation data for the same JET discharge and pick-up coil shown in Fig. 5a. The smaller sweeps of the antenna frequency waveform seen in Fig. 5a around 200 kHz correspond to the time interval when real-time tracking of stable TAEs is obtained, which is indicated by the real-time “tracking” quantity time+|δBTAE|showing an inverted
bell-shape feature. Real-time tracking is then obtained in the time interval 4.50<time [sec]<12.50, whereas for time < 4.50 sec and time > 12.50 sec the AEAD system is in scanning mode, i.e. it is looking for a res-onant plasma response to the antenna drive which fits the Lorentzian-type model given in Eq. (3), and graph-ically illustrated in Fig. 5c, for the mode characteristics (such as frequency, damping rate and amplitude). The central frequency of the n =1 TAE gap ( fTAE) is
eval-uated on the magnetic axis (i.e. at R = 3 m) by the AELM software without the contribution of the plasma toroidal rotation (not directly available in real-time from the RTSS), which produces a Doppler shift of about
∼3 kHz in the post-pulse estimate of fTAE.
= M
m=0
bm(x)(iω)m N
n=0 an(iω)n
= BM(ω,x) AN(ω)
+D(ω,x). (2b)
In Eq. (2a) the label “x” indicates the different sensors that can be used to evaluateδBTAE in real-time, and α(x) and
β(x) are fitting parameters. As shown in Fig. 5b, the central value of the frequency sweep provides the mode frequency ( fMEAS), the normalized half-width at half-maximum pro-vides the quality factor (i.e. the mode dampingγDAMP), and the peak value (≡ |δBTAE|atω = 2πfMEAS) provides the mode amplitude (|δBMEAS|) in real-time. In the tracking representation of Fig. 5b, note that the antenna frequency ( fANT) does not always closely follow the real-time value of the n =1 TAE frequency (FREF = fTAE in this partic-ular case). In fact, the narrow sweeps of fANT occur only in tracking mode. The much larger sweeps indicate that tracking has been lost as the plasma background evolves and the AELM has now begun scanning its operational fre-quency range from FREF-ScanWidth to FREF+ScanWidth to look for new resonances.
Narrow sweeps of the antenna frequency, i.e. mode tracking, occur only when the measured plasma response
δBTAE to the antenna driven perturbation is sufficiently close to the pre-set resonant shape corresponding to the model of the resonance given in Eq. (2a), which is shown in graphical form in Fig. 5c and Fig. 5d as a function of the antenna frequency. Remembering now thatδBTAE is in fact a complex-valued quantity as it is a synchronously acquired measurement (i.e. it has both the in-phase (I: real) and the quadrature (Q: imaginary) components), we
Fig. 5c A diagram illustrating the basic working ideas of the real-time tracking algorithm. When the plasma response
δBTAEto the antenna driven perturbation describes a
cir-cle in the complex-plane representation imag(δBTAE) vs.
real(δBTAE), we determine that a mode resonance has
Fig. 5d A second diagram illustrating the basic working ideas of the real-time tracking algorithm. At the beginning of each frequency sweep, the AELM starts integrating the twist variable, i.e. the angle between imag(δBTAE)
and real(δBTAE) if the signal amplitude|δBTAE|and its
speed d(|δBTAE/IANT|)/dt are above the user-set
thresh-olds, AmpThresh=0.6 mG/sec (shown by the magenta line) and SpeedThreshStart =0.5 mG/A (shown by the green line). We estimate that the antenna-driven plasma resonance has been fully identified when the integrated twist exceeds the user-set threshold= 2 rad and if the speed at the supposed end of the frequency sweep is be-low the user-set threshold SpeedThreshEnd=0.7 mG/A (again, shown by the green line). Hence, at this moment the direction of the frequency sweep is reversed in an attempt to follow the evolution of the same mode as the background plasma evolves.
easily see that the solution of Eq. (2a) describes a cir-cle in the complex-plane representation imag(δBTAE) vs. real(δBTAE), as shown in Fig. 5c. The model antenna-plasma transfer function shown in Fig. 5c and Fig. 5d was computed (post-pulse but with exactly the same algorithm as that used for the real-time analysis) for a TAE mode with |δBMEAS|=1 mG, fMEAS =200 kHz andγDAMP=37 kHz. As seen in Fig. 5c, the actual real-time δBTAE data (ac-quired for #79237 in the time interval 9.980<time[sec]< 10.020) is shifted with respect to the real-time model: this occurs because of a non-resonant contribution due to a di-rect coupling term between the antenna and the magnetic sensor(s) that exists already in vacuum, and which is then mediated, thus almost always augmented, by the plasma for an actual plasma discharge.
The post-pulse fit of the complete antenna/plasma transfer function is given in Eq. (2b). This formula then separates the resonant plasma response BM(ω,x)/AN(ω) from the non-resonant coupling term D(ω,x), when N(=1) in this case is the number of poles Pk(corresponding to the number of modes in the synchronously measured spectrum
for any given angular frequencyω), Rk is the residue for each one of these poles, and M>2N+1 is the degree of the polynomial in Laplace (iω) which best fits the plasma response to the antenna drive.
The simple real time estimate of the mode amplitude, frequency and damping from the centre and width of the plasma resonant response to the antenna drive (as shown in the insert of Fig. 5b) very closely follows the value ob-tained from a post-pulse analysis [18], which uses the com-plex plane representation ofδBTAEto also extract the non-resonant contribution to the measured fluctuation signals (i.e. the direct antenna/plasma coupling term). Despite this non-resonant term, both real-time and post-pulse analyses give results very close to those of the model [18], as shown here:
When a plasma resonance has been correctly identi-fied, the antenna frequency is swept back and forth around it, as shown in the insert in Fig. 5c. This approach allows the detection and tracking of hundreds of individual reso-nances during one single tokamak discharge, and to follow the evolution of the mode characteristics in real time as the background plasma evolves. Moreover, these modes have the same toroidal mode number if the SparSpec algorithm has been selected for AELM use.
User input is needed for a number of parameters which the AELM requires for the mode detection al-gorithm; more technical details are presented in Ap-pendix B.5. As shown in Fig. 4, these parameters are se-lected via the tab DetectorSignal, and Fig. 5d illustrates their use in the basic common ideas behind both the Sim-pleSum and the SparSpec real-time tracking algorithms. Note that in Fig. 5d the AELM real-time separate unit sys-tem is used, which does not always correspond to the phys-ical units of the post-pulse data. This is due to a frequency normalization that is different in the AELM software when calibrating the TAE-NORM and TAE-SIG channels with respect to the Laplace-space (s = iω = 2πi f ) frequency domain where the calibration is performed for the post-pulse data.
At the beginning of each frequency sweep, if a mode has been detected, the AELM software checks that the signal amplitude |δBTAE(ω)| and its speed d(|δBTAE(ω)/IANT(ω)|/dt at the angular frequency
computing the time-integral of the twist variable, i.e. the angle between imag(δBTAE(ω)) and real(δBTAE(ω)) us-ing the complex plane representation of δBTAE(ω). We estimate that the antenna-driven plasma resonance has been fully identified when the integrated twist value exceeds the (user-set, frequency-independent) threshold MinimumTwist=2 rad and the speed at the end of the fre-quency sweep is below the threshold SpeedThreshEnd = 0.7 mG/A (frequency-independent, user-set). At this mo-ment the direction of the frequency sweep is reversed in an attempt to follow the evolution of the same mode as the background plasma evolves.
4.1
The SimpleSum algorithm for mode
de-tection and tracking
The SimpleSum algorithm combines up to eight real and imaginary pairs from the total eight input AELM-SIG channels available to obtain one single output pair of real and imaginary components. This combination is per-formed using only un-weighted sums and differences, i.e. each I/Q pair has the same importance in determining the single amplitude and phase pair used for mode detection and tracking. The output pair used by the SimpleSum algo-rithm is then constructed as follows:
output (φ)= 8
k=1≡NUMBER
(Polarity)k
×Real (input (φk))+Imag (input (φk))
×(Multiplier)k. (3a)
With this algorithm, and assuming that all utilized sen-sors have the same frequency response over the frequency range selected for operation, a simple discrimination be-tween|n| = odd and |n| = even modes can in principle be obtained when the signals from a single pair of sen-sors located at toroidal opposite positions are subtracted (multipliers= +1/−1) or summed (multipliers= +1/+1), respectively. This can be readily seen by noting that if the sensors “k” and “k+4” (for k=1→4: remember that the AELM can accept up to eight input signals from magnetic pick-up coils) are pairs located at opposite toroidal posi-tionsφkandφk+π, respectively, then the combination of this two signals can be reformulated using Eq. (3a) as:
output (φ) =A0einφ
1+(Polarity)k+4×(Multiplier)k+4 (Polarity)k×(Multiplier)k
(−1)|n| , (3b) where A0is the mode amplitude and n is the toroidal mode number. A more complex mode number discrimination can be obtained when more than one pair is selected, as shown in Eq. (3c):
output (φ)
=A0einφ 4
k=1
1+(Polarity)k+4×(Multiplier)k+4 (Polarity)k×(Multiplier)k
(−1)|n| . (3c)
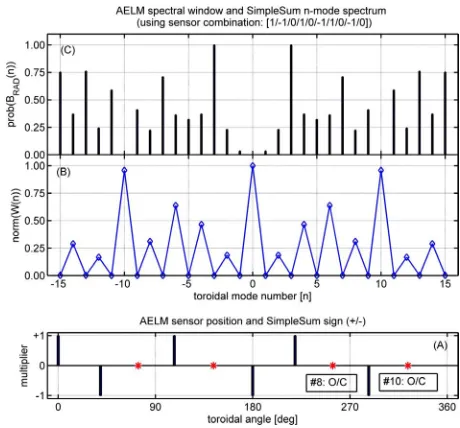
Utilization of the SimpleSum algorithm suffers mainly from three specific limitations. First, JET is equipped with ten sensors equi-spaced along the toroidal angle, but only up to eight input signals from magnetic pick-up coils can be connected to the AELM, hence the intrinsic periodic-ities of the whole complement of such “toroidal” sensors cannot actually be fully exploited with the AELM. Sec-ond, two of these sensors (sensor #8 and #10, hence be-longing to different pairs) are now open-circuit (O/C) in-vessel, hence only three pairs can be used with the Simple-Sum algorithm, further reducing the real-time capabilities for exploiting the intrinsic periodicities of the full comple-ment of toroidal sensors. Third, the sensors in the three surviving pairs are not exactly located at toroidally oppo-site positions (with a difference of around 0.1 to 0.5 de-grees with respect to the optimalπseparation, due to in-stallation constraints), and this makes the sum and sub-traction less effective in removing and/or selecting specific n-components. Finally, and although neither specifically nor solely related to the SimpleSum algorithm, as mainly due to the fact that in real-time the calibration is taken as a fixed value at the single frequency=200 kHz, the assump-tion that the frequency response of the individual sensors is the same is not always true, and significant errors can be introduced when performing the SimpleSum calculations, particularly when utilizing more than one pair of sensors, and when the mode frequency differs by more than 30 kHz to 50 kHz from the value of 200 kHz at which the calibra-tion is performed in real-time. Due to these limitacalibra-tions, the SimpleSum algorithm is commonly used in its most ba-sic form for mode detection and tracking, i.e. selecting just one sensor (simplest form of mode detection and tracking without mode number selection), or a specific pair of sen-sors (with multipliers= +/−1, multipliers=0 for all other sensors), but this use does not allow for a sufficiently se-lective real-time discrimination of the toroidal mode num-bers of the detected modes. More technical details on the real-time implementation of the SimpleSum algorithm are presented in Appendix B.5.
4.2
The SparSpec algorithm for mode
detec-tion and tracking
solution using the L1-norm criterion, i.e. the sum of the absolute values of the mode amplitudes, so that the solu-tion invoking the smallest number of modes is retained. This can be expressed as the L1-norm minimization of the quantity J, which can be defined as follows:
J1(x)=y−W x2+λx1 =y−W x2+λ
K
k=−K
(|xk|). (4) In Eq. (4)y is the vector of data, x is the vector of the complex mode amplitudes, W is the spectral window of the measurement system, andλ is the L1-norm penalization parameter, which is related to the noise level in the input data. Note that the valueλmust also be set to be consistent with the required accuracy on the measurement.
In its real-time implementation within the AELM, SparSpec accepts up to eight real and imaginary input pairs but in principle can detect multiple modes, hence it can produce several amplitude and phase pairs as output sig-nals. Two methods (highest and any) can be used for se-lecting the output modes identified with SparSpec upon which mode detection and tracking is then performed by the AELM. With the highest method the AELM software chooses, at any time point, the detected mode which has the highest amplitude, independently of which modes have been previously selected. The any method implements a “running memory” scheme: the AELM chooses the mode whose amplitude is above a given threshold, starting from the minimum mode number selected by the user. If a res-onance is then detected, this mode will continue to be se-lected until tracking is lost when the search for a new mode will re-start. This method has the disadvantage that the highest amplitude solution is not always chosen and then tracked in real-time, but the first one that is found when searching for a mode. A new “running memory” scheme is currently being tested off-line for future real-time imple-mentation, so that at the time point tj the mode obtained through a time-history-weighted analysis of the modes de-tected at all previous time points tj−k(with k =1,2, . . . ,) will be considered as the first guess for mode detection and tracking. This will avoid possible (but not often observed) spurious jumps in the mode tracking algorithm that can occur with the any and more commonly with the highest tracking methods. More technical details on the real-time implementation of the SparSpec algorithm are presented in Appendix B.5.
With respect to the implementation of the SparSpec al-gorithm within a real-time environment such as the AELM, it is important to note that certain mathematical functions (such as square root, sine, cosine and tangent) are very CPU intensive. This problem is solved using two diff er-ent methods:
• use maths coprocessors, some of which have array and simple matrix functionality – standard for desk-top PC systems but not always available within
em-bedded systems using exotic CPUs;
• use simplified lookup tables or approximations – but this can lead to inaccuracies and tables can be a prob-lem in systems with small amounts of memory. Similarly, algorithm optimisations are most effective at the mathematical formula definition stage. When the formula is interpreted into a computer language, compilers are be-coming more adept at translating it into optimised, efficient execution code. Hence, optimisations of the SparSpec al-gorithm used in real-time by the AELM involves:
• pre-computed constants or common calculations that can be stored for later re-use – but compilers are get-ting better at doing this automatically;
• removing or limiting dynamic calculations, as these are a major problem within a real-time environment; algorithms that require various amounts of memory for arrays or matrices need to be forced into a fixed size – this may mean reserving memory for the worst case or truncating a calculation; memory allocation is a time costly operation and should be avoided within time sensitive systems, and this was indeed one of the major development headaches for the SparSpec im-plementation.
– memory requirements – arrays or recursion:
re-cursion is a special form of memory allocation and it is used to refer to an algorithm that calls itself; each successive invocation requires more memory so the system can trace where it came from and can unravel itself once the calculation has completed; limits can be placed on the depth of recursion allowed but this may lead to an in-accurate value.
– loop termination conditions – add a time limit:
loop terminations based on achieving a target accuracy or error tolerance are open-ended with regards to time, which was tackled whilst im-plementing the SparSpec algorithm; we used an upper time limit that would force the calculation to terminate at 800µs even if it hadn’t reached the required accuracy; the forced termination is recorded and can be plotted next to the results for post-pulse analysis.
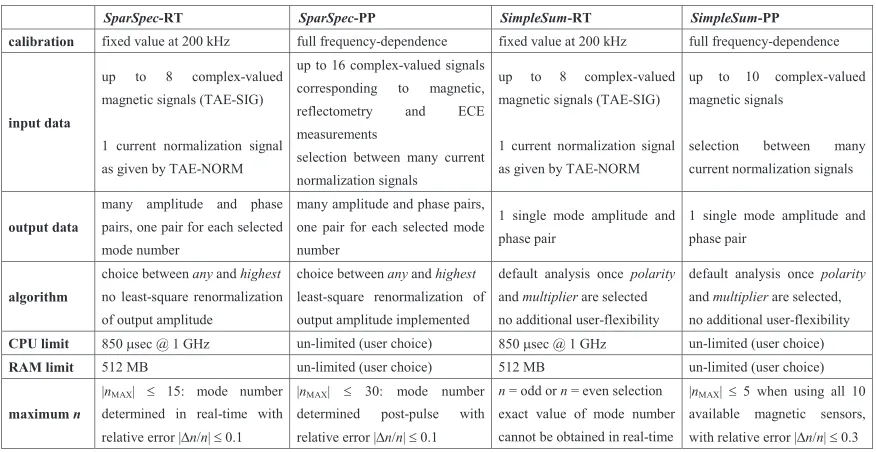
Table 2 Comparison between the real-time and post-pulse implementations of the SimpleSum and SparSpec algorithms.
4.3
Comparison between real-time and
post-pulse implementation of the SimpleSum
and SparSpec algorithms
Having described in the two previous sub-sections the main aspects of the SimpleSum and SparSpec algorithms, it is now important to highlight the differences between their real-time and post-pulse implementations. Table 2 summa-rizes these differences, where we use the labels “RT” and “PP” to indicate the real-time and post-pulse implementa-tions of both algorithms. It is important to note that the differences between real-time and post-pulse implementa-tion of these algorithms are due to the very demanding con-straints of the real-time implementation, namely the need to complete all real-time calculations within a clock time of<850µsec using a 1 GHz PowerPC with only 512 MB of available RAM. Post-pulse processing does not suffer of these limitations in computing power, hence allows for a much greater flexibility and scope in the analysis.
5. Real-Time Detection of
Frequency-Degenerated
Toroidal
Alfvén
Eigenmodes via the AELM
Alfvén Eigenmodes (AEs) are a particularly important example of real-time mode detection and tracking in ther-monuclear fusion experiments for two essential reasons. First, these waves are a natural Eigenmode of any magnet-ically confined plasma: their frequency is simply propor-tional to the ratio between the magnetic field and the square root of the plasma mass, thus representing the balance be-tween the tension force of the ambient magnetic field lines and the plasma inertia. The analysis of the dispersion re-lation of AEs can thus provide unique information on the
plasma isotopic composition, the safety factor profile and the toroidal rotation frequency via the Doppler shift in the AE mode frequency for different toroidal mode numbers [9, 10, 19]. Second, the fusion-born alpha particles (αs) have a supra-thermal speed at birth that is typically well above the Alfvén speed in the usual thermonuclear toka-mak plasma conditions. Resonant interaction with AEs is the first wave-particle interaction encountered by the αs during their thermalization process: hence, this mechanism for phase-space and spatial diffusion needs to be appropri-ately monitored and controlled to guarantee good confine-ment of theαs themselves [20, 21].
A particularly challenging task for any real-time mode detection and tracking method is the capability of distin-guishing MHD instabilities that have a very similar fre-quency but a different mode number, i.e. instabilities that belong to a frequency-degenerate spectrum where the half-width at full-maximum of two modes (which, as shown in Fig. 5, is closely related to their damping and growth rateγ/ω=imag(ω)/ω) is much smaller than their separa-tion in frequency. Stable AEs (i.e. with a positive damping
AEs with very low damping rate and mode numbers in the range of interest for burning plasma experiments that has prompted the development and implementation within the AELM of the more sophisticated algorithm for real-time mode detection and tracking based on the method of the Sparse Representation of Signals [26–28] and the Spar-Spec code, which has now almost entirely replaced the pre-vious, and much simpler, SimpleSum algorithm.
5.1
Real-time detection of Toroidal Alfvén
Eigenmodes using the SparSpec
algo-rithm
One example of real-time detection and tracking of multiple, stable, frequency-degenerate AEs in JET is ob-served during the discharge #79237. For this discharge the AEAD system was configured to drive|n| = odd modes, with maximum amplitude for|n|<5, and the AELM real-time mode detection and tracking algorithm was setup us-ing the SparSpec-any mode to look for co-current (pos-itive toroidal mode numbers) and counter-current (nega-tive toroidal mode numbers) propagating AEs with 3 ≤ |n| ≤ 10, using seven out of the eight magnetic sensors available in real-time and setting the run-time parame-ters (see Appendix B.5 for further details on the use of these parameters): SS-Lambda = 0.85, SS-NMAX = 20, SS-T’hold=5×10⁻¹⁰, Thresholds/Amp =3×10⁻⁹[T/s], Thresholds/Start = 1 ×10⁻¹²[T/A] = Thresholds/End, MinimumTwist=2 [rad].
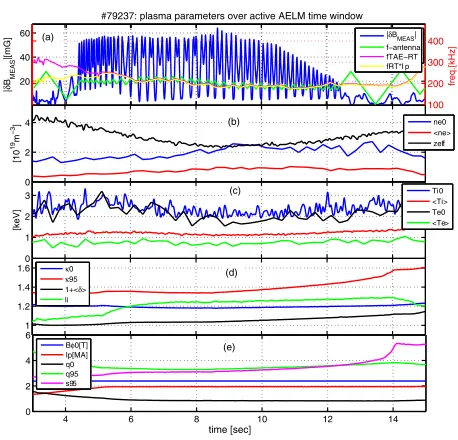
Figure 6 shows an overview of the main plasma pa-rameters for this discharge #79237. Here Bφ0is the toroidal magnetic field on the magnetic axis, Ipis the plasma cur-rent, q is the safety factor profile obtained by combining EFIT [29] reconstruction with Motional Stark Effect and polarimetry measurements when available, s is the mag-netic shear profile,κis the elongation profile,δis the aver-age top/bottom triangularity profile, Teand Tiare the elec-tron and ion temperature profiles, neis the electron density profile and ZEFF is the plasma effective charge. In Fig. 6, and in the reminder of this work, the suffixes “0” and “95” indicate a value on the magnetic axis and at 95 % of the normalised poloidal flux, and the symbol “A” indicates volume averaging of the quantity “A”. The electron den-sity and temperature were measured with a high-resolution Thomson Scattering (when available) or a LIDAR diagnos-tic system, with typical uncertainties of the order of±10 % in both cases. The ion temperature and effective charge were measured using charge-exchange (CX) spectroscopy (when available, with typical uncertainties around 15 %) or derived from equilibrium reconstruction using ion-electron energy equi-partition and bremsstrahlung measurements, with typical uncertainties up to 25 % in this latter case. In addition to the background plasma parameters indicated above, the top frame of Fig. 6 also shows: the value of the magnitude (absolutely calibrated) of the antenna-driven ra-dial component of the magnetic field (|δBMEAS|) measured
Fig. 6 Overview of the main plasma parameters over the active AELM time window for #79237. Frame-a: antenna fre-quency waveforms and driven magnetic field amplitude measured at the plasma edge; frame-b: electron den-sity from LIDAR and ZEFFfrom CX measurements,
re-spectively; frame-c: electron temperature from LIDAR measurements and ion temperature from energy equi-partition, respectively; frame-d: elongation, triangularity and internal inductance (li) from EFIT equilibrium
recon-struction; frame-e: magnetic field, plasma current, safety factor and magnetic shear from EFIT equilibrium recon-struction.
with a pick-up coil (BTOR001) mounted on the low-field side vessel wall; the value of the antenna frequency ( fANT); and the value ( fRT ∝Bφ0-RT/RGAP/qGAP/
√
AEFF/√ne0-RT) of the central frequency of the n = 1 TAE gap computed in real-time using the values RGAP =3 m and qGAP =1.5 and a user defined AEFF, without and with normalization ( fRTIp = fRT ∗ Ip(t)/max(Ip)) with respect to the time evolution of the total plasma current. Finally, note that the discharge #79237 enters into the X-point phase at t=13.5 sec. This is indicated by the large increase at that time point in the edge magnetic shear s95and edge elonga-tionκ95, which then remain both approximately constant, as shown in the bottom two frames in Fig. 6.
er-Fig. 7 Comparison between the AELM (real-time) and post-pulse values for the antenna driving frequency and the reference TAE frequency, with and without the normal-ization to the time evolution of the plasma current. There is an almost constant ∼700 Hz difference in the real-time/post-pulse antenna driving frequency, caused by a signal offset in the post-pulse data acquisition that cannot be compensated exactly for all discharges as it is due to bit-noise and electrical pick-up. Additionally, the norm of the spectral windowW(n)for all the magnetics sen-sors used in real-time is shown is the bottom frame, to illustrate the toroidal periodicities (here, mostly due to an n = ±4 component) that we have to account for in the mode number decomposition.
ences between the real-time and post-pulse n = 1 refer-ence TAE frequency, due to the different data input and processing options between real-time and post-pulse cal-culations. Again, our frequency sweep capabilities (up to±200 kHz with a maximum 400 kHz sweeping speed) are such that these differences are in most instances of no practical consequence for the subsequent data analy-sis. Finally, the norm of the so-called spectral window W(n) for all the magnetics sensors used in real-time by the AELM is shown is the bottom frame of Fig. 7. This illustrates secondary lobes related to the toroidal pseudo-periodicities that we have to account for in the mode num-ber decomposition. For the diagnostic setup chosen for the AELM real-time analysis for #79237, the spectral win-dow has high secondary lobes for |nLOBE| = 4. This in principle implies that if a mode number n is detected, it may actually correspond to a mode n0 =n± |nLOBE|. The probability PFALSE(n = n0) for such a false detection of the “true” mode number n0as a “false” mode number n is PFALSE(n0) ∝σ2(n0)×Σ(W(n)+W(|n| =nLOBE)/W(n0), whereσ(n0) is the uncertainty on the determination of the true n-component (=n0in this example) in the absence of
Fig. 8 Magnetic signal channels used in the AELM tracking algorithm for #79237, as processed using the different real-time and post-pulse options. Real-time analysis: us-ing fixed values for the offset and calibration, taken at 200 kHz. Post-pulse analysis: using the full end-to-end frequency-dependent transfer function values for the off -set and calibration.
pseudo-periodicities in the spectral window, and the sum is intended on all possible combination of n and nLOBEsuch that n =n0± |nLOBE|. Then, the noise in data may make it difficult to distinguish between the modes with toroidal mode numbers n and n0 (see Appendix A for more de-tails), particularly for secondary lobes at low mode num-bers|nLOBE| ≤5 such thatW(nLOBE)>0.7, i.e. for low-|n| modes for which the norm of the spectral window is rather large.
Figure 8 shows the comparison between the seven magnetic signal channels used in real-time by the AELM tracking algorithm, and the corresponding channels as pro-cessed in the post-pulse analysis. Note that in real-time the magnetic channels are processed and calibrated using fixed values taken at 200 kHz, and are normalized using only the amplitude of the single antenna-current selected as the normalization channel. For the post-pulse analy-sis we use the full-frequency dependent offset and calibra-tion and normalize the magnetic data with the total current (complex value: amplitude and phase) in all the active an-tennas. It is therefore clear, as shown in Fig. 8, that these different processing options produce quantitatively diff er-ent magnetic data for the real-time and post-pulse analysis, although one can see that, qualitatively, the two sets of data points are very similar.
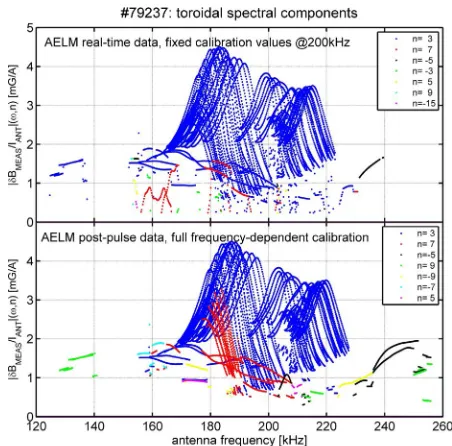
op-Fig. 9a Decomposition in toroidal mode number of the mag-netic spectrum obtained for #79237 using the signal channels selected for the AELM tracking algorithm, as processed using the different real-time and post-pulse options. The seven components with the highest (post-pulse) amplitudes are shown, in decreasing order of am-plitude. The SparSpec-any method was used for the real-time analysis, hence effectively “forcing” the detec-tion at time tj+1of the component that had already been
detected at time tj, even if the amplitude of that mode
was not the highest at the time point time tj+1.
There-fore, we have almost continuous detection of an n=3 mode, even if for time>11 sec an n=7 mode with sim-ilar amplitude also appear in the spectrum (note however that as|δB(n=7)|is always slightly below|δB(n=3)|, also the SparSpec-highest algorithm would have contin-ued locking onto the n=3 mode). Conversely, for the post-pulse analysis all components above the noise level were obtained, included such n=7 mode.
tions. Since the SparSpec-any method was used for the real-time analysis, we were effectively “forcing” the de-tection at time tj+1of the component that had already been detected at time tj, even if the amplitude of that mode was not the highest at the time point time tj+1. Conversely, for the post-pulse analysis all components above the noise level are obtained. We note that both in real-time and post-pulse the n = 3 components is the dominant mode, with very similar amplitudes. The main advantage of the post-pulse analysis resides in the fact that it allows detecting the n=7 mode which appears around the same frequency of the n=3 mode in the time interval 11<time[sec]<12. This mode was not detected in real-time, and would have not been even if we had used the SparSpec-highest algo-rithm as its amplitude is slightly below that of the n = 3 mode. Despite the|n|=4 toroidal pseudo-periodicity, we can be confident in the correctness of the real-time detec-tion of this n=7 mode for two reasons. Different sensors can be used in the post-pulse analysis: this|n|=4 toroidal pseudo-periodicity is removed, and the n = 3 and n = 7
Fig. 9b Decomposition in toroidal mode number of the mag-netic spectrum obtained for #79237, plotted as a func-tion of the antenna frequency. With this representafunc-tion we can see that the different processing options used for offset and calibration in the real-time and post-pulse analysis do not affect the results in the frequency range 150<freq [kHz]<240 and for medium toroidal mode number|n|<7, but can cause rather different results for higher mode numbers, particularly at lower frequencies
<130 kHz and at higher frequencies>250 kHz.
modes are again found with almost exactly the same fre-quency and damping rate (the difference being<0.1 % for the frequency and around 5 % for the damping rate, well below the uncertainty on the measurements). The noise varianceσ2 is relatively small for the n = 7 component, hence the probability of false detection of such mode re-mains small.
Additionally, post-pulse analysis allows a more pre-cise determination of the n-components when real-time tracking was not successful, for instance for time<4.3 sec and time > 12.5 sec. Comparing the time (Fig. 9a) and frequency (Fig. 9b) representations of the toroidal mode number spectrum, we can confirm that the different pro-cessing options for the offset and calibration used for the real-time and post-pulse analysis do not affect the results in the frequency range 150 < freq[kHz] < 250 and for medium toroidal mode numbers |n| < 7, but can cause rather different results for higher mode numbers, partic-ularly at lower frequencies< 130 kHz. Future upgrades of the AELM real-time software will have to take into ac-count a frequency look-up table to use more precise offset and calibration values, so as to improve the real-time anal-ysis in such cases.
Fig. 10 The real-time and post-pulse measurements of the mode frequency fMEAS for #79237. Three different
calcula-tions are compared: the value obtained directly in real-time with the AELM data and the processing options included in the AELM real-time software, the value ob-tained with the same AELM data but the post-pulse pro-cessing options, and finally the values obtained with the full magnetic data set (ten sensors, of which only seven were acquired in real-time) and the post-pulse process-ing options. As in real-time we can only track one sprocess-ingle mode (predominantly the n=3 for #79237), the bottom frame shows the comparison between the fMEASdata for
this mode, and the top frame show the fMEASdata for the
seven largest-amplitude modes as evaluated post-pulse.
Fig. 11 The real-time and post-pulse measurements of the mode damping rate (γ/ω) for #79237, using the same format and data analysis methods as in Fig. 10.
calculations are compared: the value obtained directly in real-time with the AELM data and the processing options included in the AELM real-time software; the value
ob-tained with the same AELM data but the post-pulse pro-cessing options; and finally the values obtained with the full magnetic data set (ten sensors, of which only seven were acquired in real-time) and the post-pulse process-ing options. It is important to remember that as in real-time we can only track one single mode (predominantly the n = 3 for #79237), the bottom frame in both Figs. 10 and 11 shows the comparison between the fMEASandγ/ω data only for this mode, whereas the top frame show the fMEASandγ/ωdata for the seven largest-amplitude modes as evaluated post-pulse.
From Fig. 10, we note that the measured n =3 mode frequency is indeed very similar when evaluated post-pulse and real-time, independently of the specific algorithm and input dataset used for this calculation. We also note that the frequency of the other modes with a different toroidal mode number are very close to that of the n = 3 mode, i.e. we do indeed measure a frequency-degenerate spec-trum. This is also partially due to the fact that in this ohmi-cally heated discharge the toroidal rotation frequency of the plasma is rather small, of the order of fTOR ∼ 1 kHz, hence producing only a minimal frequency Doppler shift between the various n-modes,ΔfMEAS,n=n fTOR.
From Fig. 11, we note that the measured n=3 damp-ing rate shows a very similar quantitative trend usdamp-ing both real-time and post-pulse calculations, i.e. it increases from time = 4 sec to time = 8 sec, then it remains relatively constant, then it decreases from time = 10.5 sec until time = 12.5 sec. In terms of absolute values, there is at most a∼30 % difference between the AELM real-time data (blue circles in the bottom frame of Fig. 11) and the post-pulse data obtained using the full magnetic data set and the post-pulse processing options (green squares in the bottom frame of Fig. 11). This difference is due to a non-optimal choice for the factor Cdamp that needs to be set pre-pulse in the AELM to convert the real-time calculation of the damping rate as estimated from the frequency width of the detected resonance into physical units. For #79237 a value Cdamp=0.16 was selected, as previously determined for n=1 TAEs [18]. Our recent analysis has determined that the optimal value for Cdamp depends on the actual mode number that has been measured in real-time, with a range Cdamp = 0.16 for |n| = 1 TAEs to Cdamp = 0.30 for |n| >7 TAEs. Again, future upgrades of the AELM real-time software may need to take into account a mode num-ber look-up table to use a more precise real-time/post-pulse conversion factor for the mode damping rate.
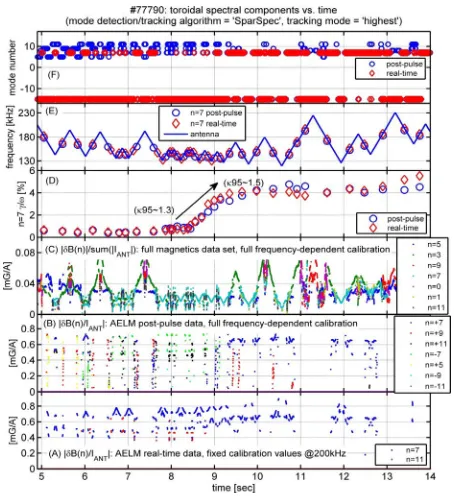
Fig. 12 The toroidal spectral components, and the measured mode frequency and damping rate for the n=7 mode for #77790. Note the sharp increase inγ/ωbetween time= 8 sec and time =10 sec, due to a correspond-ing increase in the edge elongation fromκ95 ≈ 1.3 to κ95 >1.5 over the same time window. This feature is
observed in both the real-time and post-pulse data, and demonstrates the capabilities of the SparSpec algorithm in detecting and following a mode even when its damp-ing rate varies considerably over a relatively short time window.
on these studies). The SparSpec-highest algorithm was setup to look for co-current (positive toroidal mode num-bers) propagating AEs with 3 ≤ n ≤ 11 and counter-current (negative toroidal mode numbers) propagating AEs with n = [−5,−7,−9]. Five out of the eight mag-netic sensors available in real-time were selected for the analysis, and the following run-time parameters were used (see Appendix B.5 for further details on the use of these parameters): SS-NMAX = 20, SS-Lambda = 0.85, SS-T’hold=5×10⁻¹⁰, Thresholds/Amp=1×10−10[T/s], Thresholds/Start = Thresholds/End = 1 ×10⁻¹³[T/A], MinimumTwist=2 [rad].
In Fig. 12 we show the normalized amplitude of the seven largest toroidal spectral component that could have been selected for tracking in real-time (frame-A: only the n=7 and n=11 modes satisfy the detection criteria), and post-pulse applying the full-frequency dependent calibra-tion, using only the five AELM magnetics selected for real-time analysis (frame-B) and the full complement of ten magnetic sensors available for post-pulse analysis (frame-C); frame-D and frame-E shows the damping rate and the mode frequency for the n=7 mode evaluated in real-time and computed post-pulse using the data from frame-A and frame-C, respectively; finally, frame-F shows the toroidal
mode number that was actually selected for tracking in real-time and post-pulse.
Comparing the data in frame-A to frame-C, we first note that when using only the magnetic sensors selected for real-time analysis but with the post-pulse processing options, we sometimes mistake the n = +7 mode for the n=−7 mode, notably in the time window 8<time[sec]< 9. Again, this points to the need for a more accurate real-time implementation of the full frequency-dependent calibration. Moreover, whereas in real-time the n = 7 mode has almost always the largest amplitude, using the full complement of magnetic sensors and post-pulse anal-ysis we find that this only occurs for frequencies around 150 kHz, and other modes appear at higher amplitudes in different frequency ranges. This translates into the fact that in real-time the n=7 mode is the one that was almost al-ways selected for tracking, whereas using post-pulse pro-cessing other, higher-|n| modes could have been chosen, most notably the n = 11 mode during the time interval 7<time[sec]<10.5. Finally, when comparing the mode frequency and damping rate obtained in real-time and post-pulse, we find a very good agreement between these two sets of data, specifically for the sharp increase inγ/ω be-tween time = 8 sec and time = 10 sec, due to a corre-sponding increase in the edge elongation fromκ95 ≈1.3 to
κ95 >1.5 over the same time window. This demonstrates the capabilities of the SparSpec algorithm in detecting and following a mode even when its damping rate varies con-siderably over a relatively short time window.