MANAGER SATISFACTION IN USING THE ENTERPRISE RESOURCE PLANNING (ERP) SYSTEM AND THE MANAGERIAL PERFORMANCE
Weli Faculty of Economics
Atma Jaya Catholic University of Indonesia, Jakarta [email protected]
ABSTRACT
This study is aimed to test the manager’s satisfaction of the managers using the ERP and to test the influence of job satisfaction towards the performance in the decision process by the manager. The measurement of the satisfaction towards the ERP system will be conducted using the end user’s satisfaction computing model (EUCS), using the content, accuracy, formal ease of use, and timelines attributes (Doll and Torkzadeh, 1988). Whereas, the performance is measured using the instrument which was developed by Nicolaou (2000) consisting of 2 (two) question items about the reporting and continuing control, 7 (seven) items of questions adopted from the study results of Spathis and Constantinides (2004). The data were collected through a survey using questionnaires distributed to companies that have used the ERP system. The data analysis used the Partial Least Square method with SmartPLS program. The results show that the concept of EUCS has a conformation and there is a significant effect between the ERP system user satisfaction with the manager’s performance, especially in the decision making process. This result contributes to the concept of EUCS and supports previous research related to end user satisfaction.
Keywords: Enterprise Resource Planning, ERP, Information System, End User Computing Satisfaction, EUCS, manager performance.
INTRODUCTION
Nowadays the use of the Enterprise Resource Planning (ERP) system has experienced a rapid growth, also in Indonesia. SAP Indonesia as one of ERP vendor has succeeded for the IV 2009’s quarter, to have a significant growth rate of 30%, compared with 2008, that is, 47 companies have become new customers. Other information that has been reported in Kompas of 11 July 2009 is, that large companies in Indonesia have used the ERP system with the SAP vendors having reached more than 250 SAP companies and according the SAP Indonesia report, until 2012, the SAP users have reached more than 800 companies.
The growth of the ERP system users is not free from the wishes of the company to integrate all business functions so that streamlining data processing will occur via a centralized database. Besides, the hope, being the basis of the use of the ERP is to create an efficient and an effective business organization process, increasing the ability in making managerial decisions, and monitoring company’s performance. Similarly, according to Sajadi et al. (2008) that the use of the ERP systems may affect the effectiveness of information systems through improved managers decision-making processes, internal controls, and improving the quality of financial reporting and facilitates transaction processing companies. Furthermore, an effective information system is expected to improve the quality of decisions, and improving the company’s performance.
issues, the lack in planning and project management, as well as consultant’s quality. However, previous study in using system has shown the importance of the system user’s satisfaction. The user satisfaction was determined by the user system satisfaction towards factors of the success of the system implementation. The interaction between user and implemented system will result in the perception of the user alone. The user’s perception is directed towards the satisfaction or on the contrary, towards the no satisfaction of the system.
Considering the aim of the use of the ERP is create the integrated flow of the information, it is expected that the information produced by the system will be more qualified. The information quality becomes an important weapon for decision makers in solving business problems. Therefore, this study will examine the satisfaction of manager of the ERP system user and whether the satisfaction towards the use of the ERP system has an influence towards the company’s performance, especially in the decision making process by the manager. The satisfaction measurement towards the ERP system is conducted through the end user’s computing satisfaction (EUCS) model, using the content, accuracy, format, ease of use, and timelines attributes (Doll and Torkzadeh, 1988).
The EUCS model to measure the satisfaction of the user of the ERP has already been conducted by Hees and Hightower (2002), Rose (2006), Deng et al. (2008), and Mitakos et al. (2010). In general, the EUCS analytical report for the ERP system shows that the EUCS concept can also be used for the ERP system, as well as to other systems at the previous studies.
Although the study using the EUCS have already been conducted many times before, however, all those studies have only confirmed the measurement model for the system user’s satisfaction and have not yet seen the system user’s influence towards the organization, especially in the decision making process by the management. Therefore, this study will analyze the satisfaction measurement of the ERP system user and to test this satisfaction influence towards the organization, especially, at the decision making process by the manager. Therefore, the aim of this study is as follows:
1. Conducting an analysis on the Content, Accuracy, Format, Ease of Use and Timeliness as the makers of the satisfaction factors for the ERP users.
2. To analyze the influence of the manager’s satisfaction of the use of the ERP system towards the manager performance in the decision making.
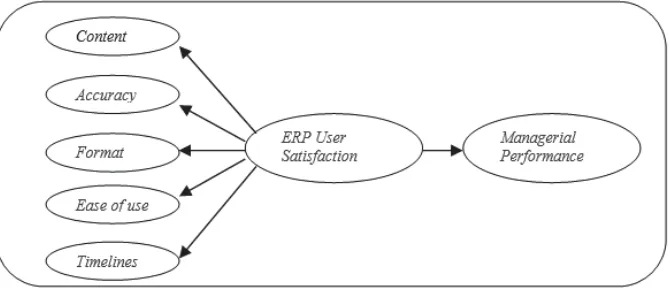
Whereas the theoretical framework, regarding the relationship between the variables, is reflected in Figure 1.
LITERATURE REVIEW AND THE HYPOTHETICAL FORMULATION The Satisfaction Measurement of The Information System User.
The model to measure the system user’s performance has been developed long time ago by the researchers in the field of the information system. One of the models that are frequently used is the End User Competing Satisfaction (EUCS). The EUCS was developed in 1988 by Doll and Torkzadeh to measure the computer’s end user satisfaction. Doll and Torkzadeh have found five factors (content, accuracy, format, ease of use and timeliness) strongly measured the satisfaction of the end-user, so that this instrument became the right instrument to measure the end-user’s satisfaction.
Another model to measure the system user’s satisfaction is the successful information system, which has developed since the beginning of 1990 (DeLone, and Mclean, 1992). This model has further developed, parallel with the many studies conducted in testing the success of the system (Delone, 2003). The satisfaction model of the system user as developed by Delone (2003) values that the satisfaction in using the information by relating the satisfaction of the system user with the usage and the organization’s performance. The higher the satisfaction rate towards the new implemented system, the higher the intention to use it and at the end will make the individual’s and organization’s performance better and more efficient.
User satisfaction can be defined as the level of user confidence over an information system use that is available to meet their needs for information. When users use the system they will evaluate the various aspects of the use based on their experience compared to the expectations over the system. Although the study about the satisfaction of the end user has already been developed since the last decade, however this study has still drawn the researcher’s as well as practitioner’s interest (Khalifa and Liu, 2003). Since the Delone and Mclean (1992, 2003) model was developed, many researchers have continued investigating the information system, extra construct, and the different points of view.
The test of the user’s satisfaction at the of the ERP system has also been carried out, among others by Hees and Hightower (2002), Roses (2006), Deng et al. (2008) and Mitakos et al (2010). Hees and Hightower (2002) have proposed a framework to test the ERP system users using the equity theory. The aim of their study is to look into the attitudes of the users to complete the framework of the satisfaction of the system user model. Roses (2006) has tested the antecedent factor of the ERP system users satisfaction, using the information system’s success and the EUCS model. The result of the study has confirmed that the application of the EUCS model can be used in the application of the ERP system.
Deng et al. (2008) have analyzed the multi-group variance towards the EUCS instrument for the use of the Enterprise system in five countries (US, Western Europe, Saudi Arabia, India and Taiwan). The analysis report has indicated that the EUCS instrument has provided a measurement result that is equal among the five countries. Hence, conclusion can be derived that the EUCS instrument can be globally used. Mitakos et al. (2010) has connected the success of the implementation and operation of ERP with the user. They have tested the demographic of the individuals (the department in which the user works, the user position in the organization, the education level, age, computer experience, gender) who influence the satisfaction of the ERP system user by adding the self-efficacy factor. However, not a single individual demographic factor proposed, have proofed that it can satisfy the ERP system user.
integrated system. The integration of the system is hoped to produce better information as seen from the perspective of the content, accuracy, format, ease of use and timeliness. Therefore, the hypothesis formula in this study is as follows:
H1: There is a direct influence between Content from the output of the ERP system and the manager’s satisfaction using the ERP system.
H2: There is a direct influence between accuracy of the output of the ERP system and the manager’s satisfaction using the ERP system.
H3: There is a direct influence between the form of the output system of the ERP and the manager’s satisfaction using the ERP system.
H4: There is a direct influence between the ease of use of the ERP system and the manager’s decision using the ERP system.
H5: There is a direct influence between the Timeliness of the output of the ERP system the manager’s satisfaction.
The Enterprise Resource Planning (ERP) system user’s satisfaction and the Managerial Performance.
The user’s satisfaction at the previous studies was identical with the valuation of the effectiveness of an information system (DeLone and McLean, 1992). The system user’s satisfaction in interacting with the system can be seen from their experience with the information output as produced by the system. The produced physical output by the system can be valued through the content, accuracy, format, ease of use and timeliness. Further, is the user’s satisfaction towards the output quality in accordance with what is in need, whether the output system can increase the work productivity, increase the work performance, and increase the control towards the decision, related with the resulting information. Therefore, it is hoped that the information result can make the decision making process more effective, the information reach easier to interpret, and better understood and the distribution of information to the sections or to the related functions can be upgraded (Ugboma, 2004).
Further, according to Kim (1988), an effective system depends on the user’s perception regarding the information quality result, whereas the quality of the information is dependent on the reliability, the reporting form, the timeliness, and relevance for the decision making. Further, Nicolaou (2000) has defined the perception about the effectiveness of a system as seen from the perspective of the decision maker regarding the information output, which is originated from the transaction process which is adapted to their needs in the coordination and the management controlling activities.
According to Sajady et al. (2008), the information system effectiveness is also dependent on the decision maker’s perception towards the usefulness of the information, resulted from the system, to fulfill the information needs in the operational process, the managerial report, the budget, and the organizational control. The result of Sajadi et al. (2008) study has indicated that the implementation of the information system will result in betterment of the decision making process by the manager, the internal control and the financial reporting quality, and the facility of the company’s transaction process. Further, in this study the evaluation of the managerial performance influence towards the information system user’s satisfaction is focused towards the information usefulness for the users. The measurement is derived from the value of the user’s satisfaction towards the information quality, consisting of the form, content, and the presentation presented in the ERP system.
can hope that that it will increase the information to those using it as well as that it will also improve the dispatch of the information to those using it besides, it will also improve the consistence of the data and the information resulted from the system. Hence, the measurement of the user’s satisfaction will become relevant in value the managerial performance effectiveness. Therefore, the measurement of the user’s satisfaction will become more relevant to value the managerial performance effectiveness. Further, the hope, as the basis for the performance increase is the believe that the information technology equipment can catch information and spread it more rapidly to the whole organization to help the individual to do work and to make better decision (Arnold, 2006). Since one of the goals for using the ERP system is the data integration, the system will provide data that can be used collectively by all individuals in the organization. Besides, it is expected that the system will create an up to date data (Nah et al., 2001). Therefore, there are 6 hypothesis formulations, as follows:
H6: There is direct influence between the manager’s satisfaction using the ERP system and the manager’s performance, especially in the decision making activities.
RESEARCH METHOD
The research population is the ERP system users at the manager level from all companies in Jakarta that have already used the ERP system. However, because the list of companies that have been using the ERP system is not available, so that it is not possible to have a sampling framework and therefore the sampling can not be conducted randomly. The collection of information about the company is done by searching the search engine (Google). After the information about the company is collected, the next stage is to ask the willingness of the company to collaborate in the survey and who can be contacted to fill the questioners.
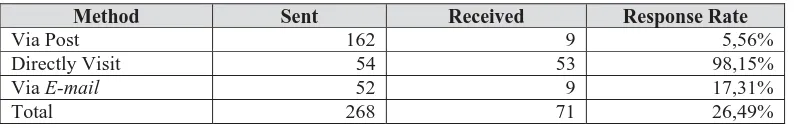
The data collection process was done during 4 (four) month, that is, from beginning October 2010 until February 2011. The data collection was conducted by sending the questioners via the post office service, e-mail and visiting the related company directly. Until the time limit, the rate of return via the post office, and e-mail have only reached 12 copies, while directly sent only 38 copies. This is far from the expectation. Therefore, the researcher has extended the time limit for collecting the data until April 2011. The last result of the collection process, only 18 copies were collected via the post office and e-mail, and 53 copies were sent directly, hence, the total was 71 copies.
Method Sent Received Response Rate
Via Post 162 9 5,56%
Directly Visit 54 53 98,15%
Via E-mail 52 9 17,31%
Total 268 71 26,49%
Table 1. Response Rate
The validity instrument
system of the company. From the review of these experts a small revision has been done relating to the use of the sentences.
Apart from the importance of the validation and reliability of the EUCS instrument, this study will examine all five variables of the EUCS instrument with the factor analysis, using the SPSS 16 program, where the result will be presented at the next section.
Operational Variable and Measurement
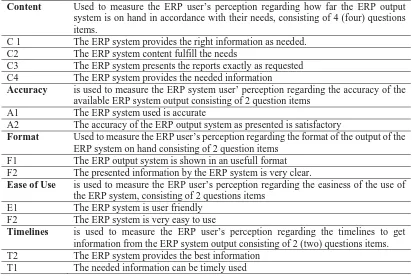
The variable that forms the ERP system user’s satisfaction is adopted from the End User Computing Satisfaction (EUCS) concept as proposed by Doll & Torkzadeh (1988), in which the ERP system user’s satisfaction is influenced by 5 variables, that are Content, Accuracy, Format, Ease of Use and Timelines. The measurement of the the five constructs is using the seven points Likert scale, from not very agreed up to very agreed. The questions items of every construct are presented in the following Table 2.
Code Explanation
Content Used to measure the ERP user’s perception regarding how far the ERP output system is on hand in accordance with their needs, consisting of 4 (four) questions items.
C 1 The ERP system provides the right information as needed. C2 The ERP system content fulfill the needs
C3 The ERP system presents the reports exactly as requested C4 The ERP system provides the needed information
Accuracy is used to measure the ERP system user’ perception regarding the accuracy of the available ERP system output consisting of 2 question items
A1 The ERP system used is accurate
A2 The accuracy of the ERP output system as presented is satisfactory
Format Used to measure the ERP user’s perception regarding the format of the output of the ERP system on hand consisting of 2 question items
F1 The ERP output system is shown in an usefull format F2 The presented information by the ERP system is very clear.
Ease of Use is used to measure the ERP user’s perception regarding the easiness of the use of the ERP system, consisting of 2 questions items
E1 The ERP system is user friendly F2 The ERP system is very easy to use
Timelines is used to measure the ERP user’s perception regarding the timelines to get information from the ERP system output consisting of 2 (two) questions items. T2 The ERP system provides the best information
T1 The needed information can be timely used
Source: Doll & Torkzadeh (1988)
Table 2. EUCS Construct
Managerial Performance
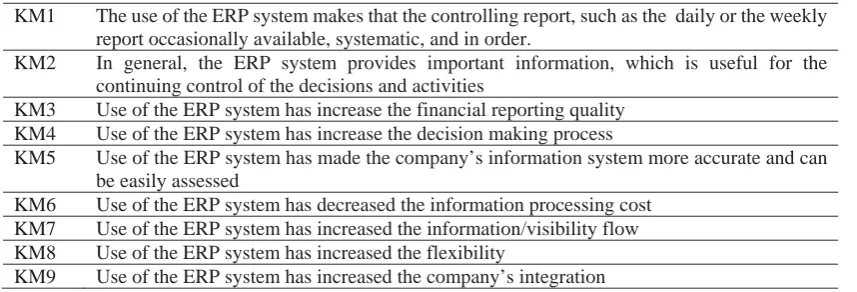
Besides, it is also measured through 7 (seven) question items, adopted from the Spathis and Constantinides (2004) study result. The question items for managerial performance is presented in Table 3:
KM1 The use of the ERP system makes that the controlling report, such as the daily or the weekly report occasionally available, systematic, and in order.
KM2 In general, the ERP system provides important information, which is useful for the continuing control of the decisions and activities
KM3 Use of the ERP system has increase the financial reporting quality KM4 Use of the ERP system has increase the decision making process
KM5 Use of the ERP system has made the company’s information system more accurate and can be easily assessed
KM6 Use of the ERP system has decreased the information processing cost KM7 Use of the ERP system has increased the information/visibility flow KM8 Use of the ERP system has increased the flexibility
KM9 Use of the ERP system has increased the company’s integration
Source: Nicolaou (2000), Spathis and Constantinides (2004)
Table 3. Managerial Performance Construct
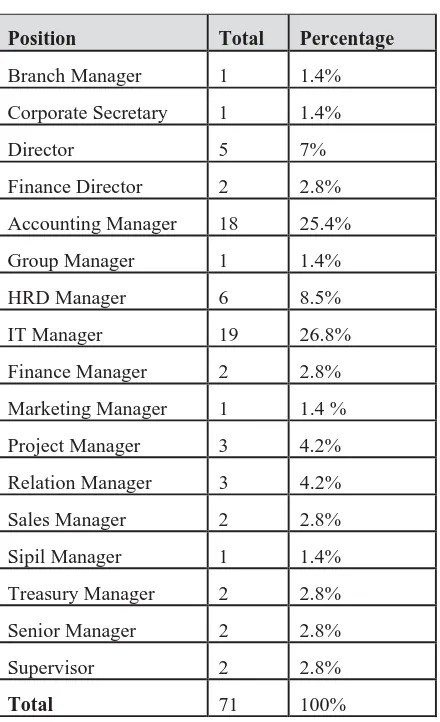
RESULT Respondent profile
Position Total Percentage
Branch Manager 1 1.4%
Corporate Secretary 1 1.4%
Director 5 7%
Finance Director 2 2.8%
Accounting Manager 18 25.4%
Group Manager 1 1.4%
HRD Manager 6 8.5%
IT Manager 19 26.8%
Finance Manager 2 2.8%
Marketing Manager 1 1.4 %
Project Manager 3 4.2%
Relation Manager 3 4.2%
Sales Manager 2 2.8%
Sipil Manager 1 1.4%
Treasury Manager 2 2.8%
Senior Manager 2 2.8%
Supervisor 2 2.8%
Total 71 100%
Table 4. Respondent Profile Position
Tenure Total Percentage
< 3 year 34 47.9%
3 - 5 year 14 19.7%
5 - 10 year 13 18.3%
10 - 15 year 6 8.5%
> 15 year 4 5.6%
Total 71 100%
Industry Total Percentage
Agriculture 3 4%
Mining 4 6%
Basic Industry and Chemicals 7 10%
Miscellaneous Industry (automotive, cable, electronic) 15 21%
Consumer Goods Industry 8 11%
Property, Real Estate and Building Construction 9 13% Infrastructure, Utilities & Transportation 8 11%
Finance 8 11%
Trade, Service&Investment 9 13%
Total 71 100%
Table 6. Industries
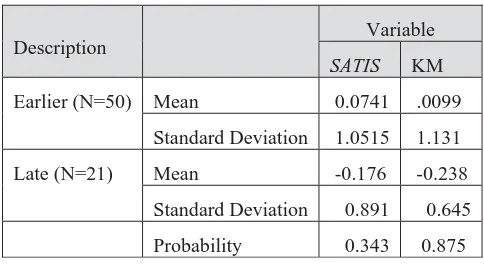
Non-Response Bias Test
As presented at table 7, the result of the non-response bias test between the group of 50 respondents that have responded earlier, (October 2010 – February 2011) and the group who have responded at the end of 21 respondents (March 2011 – April 2011), the p-value > 0,05. Therefore, the conclusion is that there are no differences between the groups for the testing the group that has responded earlier and the group that has responded at the end. Therefore, this data is applicable for further tests.
Description Variable
SATIS KM Earlier (N=50) Mean 0.0741 .0099
Standard Deviation 1.0515 1.131
Late (N=21) Mean -0.176 -0.238
Standard Deviation 0.891 0.645
Probability 0.343 0.875
Table 7. Non-Response Bias-Test
Factor Analysis
three stages. At the next part a hypothetical test will be conducted, using the PLS. The test will be carry out in three phases, that is:
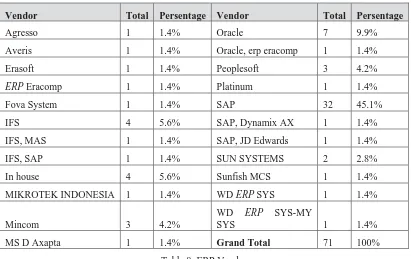
Vendor Total Persentage Vendor Total Persentage
Agresso 1 1.4% Oracle 7 9.9%
Averis 1 1.4% Oracle, erp eracomp 1 1.4%
Erasoft 1 1.4% Peoplesoft 3 4.2%
ERP Eracomp 1 1.4% Platinum 1 1.4%
Fova System 1 1.4% SAP 32 45.1%
IFS 4 5.6% SAP, Dynamix AX 1 1.4%
IFS, MAS 1 1.4% SAP, JD Edwards 1 1.4%
IFS, SAP 1 1.4% SUN SYSTEMS 2 2.8%
In house 4 5.6% Sunfish MCS 1 1.4%
MIKROTEK INDONESIA 1 1.4% WD ERP SYS 1 1.4%
Mincom 3 4.2%
WD ERP SYS-MY
SYS 1 1.4%
MS D Axapta 1 1.4% Grand Total 71 100%
Table 8. ERP Vendor
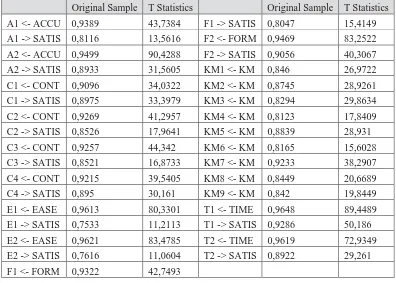
Phase 1: The Test of the Measurement Model (outer model) The Convergent Validity Test
Source: Output Smart PLS 2.0 M3
Figure 2. The Convergent Validity Research Model
Original Sample T Statistics Original Sample T Statistics
A1 <- ACCU 0,9389 43,7384 F1 -> SATIS 0,8047 15,4149 A1 -> SATIS 0,8116 13,5616 F2 <- FORM 0,9469 83,2522 A2 <- ACCU 0,9499 90,4288 F2 -> SATIS 0,9056 40,3067 A2 -> SATIS 0,8933 31,5605 KM1 <- KM 0,846 26,9722
C1 <- CONT 0,9096 34,0322 KM2 <- KM 0,8745 28,9261 C1 -> SATIS 0,8975 33,3979 KM3 <- KM 0,8294 29,8634 C2 <- CONT 0,9269 41,2957 KM4 <- KM 0,8123 17,8409 C2 -> SATIS 0,8526 17,9641 KM5 <- KM 0,8839 28,931
C3 <- CONT 0,9257 44,342 KM6 <- KM 0,8165 15,6028 C3 -> SATIS 0,8521 16,8733 KM7 <- KM 0,9233 38,2907 C4 <- CONT 0,9215 39,5405 KM8 <- KM 0,8449 20,6689 C4 -> SATIS 0,895 30,161 KM9 <- KM 0,842 19,8449
E1 <- EASE 0,9613 80,3301 T1 <- TIME 0,9648 89,4489 E1 -> SATIS 0,7533 11,2113 T1 -> SATIS 0,9286 50,186 E2 <- EASE 0,9621 83,4785 T2 <- TIME 0,9619 72,9349 E2 -> SATIS 0,7616 11,0604 T2 -> SATIS 0,8922 29,261
F1 <- FORM 0,9322 42,7493
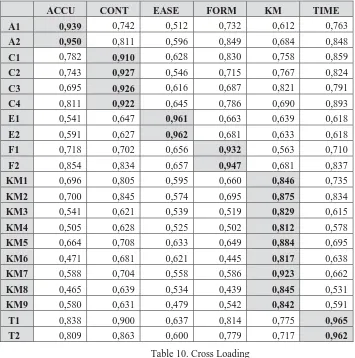
The Discriminant Validity Test
The valuation of the discriminant validity at this study was conducted using 2 (two) methods. First, the valuation was carry out based on the cross loading measurement with the construct, if the construct correlation using the item is greater than the other construct. This means that the latent construct will predict better the measurement at their block than the measurement in other blocks. The result of the cross loading test shows that all the loading factor value of each indicator is larger than the measurement at other constructs. The conclusion of this analysis is that each latent construct will be able to predict the measurement of their block better so that this research model has a good discriminant validity value.
ACCU CONT EASE FORM KM TIME A1 0,939 0,742 0,512 0,732 0,612 0,763 A2 0,950 0,811 0,596 0,849 0,684 0,848 C1 0,782 0,910 0,628 0,830 0,758 0,859 C2 0,743 0,927 0,546 0,715 0,767 0,824 C3 0,695 0,926 0,616 0,687 0,821 0,791 C4 0,811 0,922 0,645 0,786 0,690 0,893 E1 0,541 0,647 0,961 0,663 0,639 0,618 E2 0,591 0,627 0,962 0,681 0,633 0,618 F1 0,718 0,702 0,656 0,932 0,563 0,710 F2 0,854 0,834 0,657 0,947 0,681 0,837 KM1 0,696 0,805 0,595 0,660 0,846 0,735 KM2 0,700 0,845 0,574 0,695 0,875 0,834 KM3 0,541 0,621 0,539 0,519 0,829 0,615 KM4 0,505 0,628 0,525 0,502 0,812 0,578 KM5 0,664 0,708 0,633 0,649 0,884 0,695 KM6 0,471 0,681 0,621 0,445 0,817 0,638 KM7 0,588 0,704 0,558 0,586 0,923 0,662 KM8 0,465 0,639 0,534 0,439 0,845 0,531 KM9 0,580 0,631 0,479 0,542 0,842 0,591 T1 0,838 0,900 0,637 0,814 0,775 0,965 T2 0,809 0,863 0,600 0,779 0,717 0,962
Table 10. Cross Loading
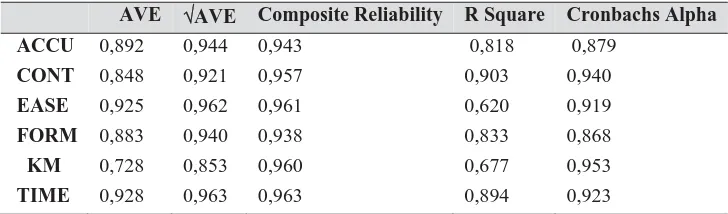
AVE AVE Composite Reliability R Square Cronbachs Alpha ACCU 0,892 0,944 0,943 0,818 0,879
CONT 0,848 0,921 0,957 0,903 0,940 EASE 0,925 0,962 0,961 0,620 0,919 FORM 0,883 0,940 0,938 0,833 0,868 KM 0,728 0,853 0,960 0,677 0,953 TIME 0,928 0,963 0,963 0,894 0,923
Table 11. Validity Measurement
Composite Reliability Value
Composite reliability is a block indicator that measures a construct reflexively. The Composite reliability with a value of more than 0.7 shows that the internal consistency is good. The result of the Smart PLS of 2.0M3, as seen at Table 11, shows that the composite reliability value of the whole construct is above 0.7. Therefore, we can conclude that all constructs have a good internal consistency.
All measurements of above measurement model show that a value that fulfill the measurement criteria. Therefore, we can conclude that all indicators that have already been revised, can be used to test the hypothesis. All items that explain the construct of this study have a relatively high reliability.
Phase 2: Structural Model Test (Inner Model)
After testing the research model (Outer Model), we further conduct a test towards the structural model. This test is meant to evaluate the relationship between the constructs that have been proposed at this study’s hypothesis. Information that shows how good the structural model predicted can be observed from the R square value, which is the goodness-fit test model, to explain the percentage of the construct variation towards the whole model.
The result of the test using the SmartPLS for the whole level 1 construct (Accuracy, Content, Format, Timelines) has shown that a fairly strong explanation power, that is larger that 67% , except for Ease of Use construct which is only 62%, however, this value is quite substantial (Chin,1998). Also, for the R square value, the managerial performance (KM) shows a fairly high explanation power, which is 67.7%. This means that the EUCS construct is applicable to measure the user’s satisfaction of the ERP system. Besides, the construct of the user’s satisfaction together explain as much as 67.7% of the variation towards the managerial satisfaction.
Phase 3: Hypothetical test
performance is accepted. This means that the ERP user’s satisfaction influences directly the managerial performance.
Original Sample T Statistics
SATIS -> ACCU 0,905 29,702
SATIS -> CONT 0,950 55,219
SATIS -> EASE 0,788 12,363
SATIS -> FORM 0,913 40,101
SATIS -> KM 0,823 17,471
SATIS -> TIME 0,945 71,183
Table 12. Coefficient Path
DISCUSSION AND CONCLUSION
This study is conducted with two aims, e.g. to analyze whether the Content, Accuracy, Format, Ease of Use, and Timeliness are measurements to measure the manager’s satisfaction in using the ERP system, and whether there is a satisfaction influence of the manager in using the ERP system towards the manager’s performance in the process of making decisions. The result of the data from 71 respondents shows that the construct of Content, Accuracy, Format, Ease of Use, and Timeliness influence significantly the construct of the manager’s satisfaction using the ERP system. Based on this analytical result, and the test using the factor analysis, we can conclude that the concept as proposed by Doll & Torkzadeh (1988) regarding the End User Computing Satisfaction (EUCS) can be used to measure the manager’s satisfaction using the ERP system in this study.
The second analysis is to test the manager’s satisfaction, using the ERP system, as measured by the Content, Accuracy, Format, Ease of Use and Timeliness towards the managerial performance, in which the managerial performance is explained through the questions items regarding the frequency and the reporting quality, the effectiveness of the monitoring activities, and the coordination by the management, the decision making process, the easiness to the information’s availability, the reduction of information management, increase in the information flow, increasing the flexibility and the company’s integration. Hence, from the result of the analysis, it can be concluded that in general, this study has supported the End User Computing Satisfaction (EUCS) concept as proposed by Doll & Torkzadeh (1988), and other studies using the same concept and other information systems as well as the ERP system such as Hees and Hightower (2002), Roses (2006), Deng et al. (2008) and Mitakos et al. (2010). Therefore, this study has confirmed the EUCS concept for the ERP system, besides for other information systems, such as for previous studies. Besides, this study confirms the model as proposed in this study that the manager’s satisfaction using the ERP system can influence the manager’s performance in the decision making process.
LIMITATION AND FUTURE AGENDA
limitedness of this study, the advice for the coming study is to use the case study method in order to delve more the viewpoint of the ultimate user of the organization as a whole, thus a satisfaction measured not only quantitatively but also qualitatively.
REFERENCES
Arnold, V. (2006) Behavioral research opportunities: Understanding the impact of enterprise systems. International Journal of Accounting Information Systems, 7(1), 7-17.
Chin, W. W. (1998) Commentary: Issues and opinion on structural equation modeling. MIS Quarterly, vii-xvi.
DeLone, W. H., & McLean, E. R. (1992) Information systems success: the quest for the dependent variable. Information Systems Research, 3(1), 60-95.
Delone, W. H. (2003) The DeLone and McLean model of information systems success: a ten-year update. Journal of Management Information Systems,19(4), 9-30.
Deng, X., Doll, W. J., Al-Gahtani, S. S., Larsen, T. J., Pearson, J. M., & Raghunathan, T. S. (2008) A cross-cultural analysis of the end-user computing satisfaction instrument: a multi-group invariance analysis. Information & Management, 45(4), 211-220.
Doll, W. J., & Torkzadeh, G. (1988) The measurement of end-user computing satisfaction. MIS Quarterly, 259-274.
Fornell, C., & Larcker, D. F. (1981) Evaluating structural equation models with unobservable variables and measurement error. Journal of Marketing Research, 39-50.
Ghozali I. (2011) “Structural Equation Modeling: Metode Alternatif dengan Partial Least Square (PLS)”. Edisi 3, Semarang: Badan Penerbit Universitas Diponegoro.
Hess, T. J., & Hightower, R. (2002) Using Equity Theory to Understand User Satisfaction with ERP Systems: Extending and Advancing the Equity-Implementation Model. In Twenty-Third International Conference on Information Systems (ICIS) December.
Khalifa, Mohamed and Liu, Vanessa. (2003) The State of Research on Information System Satisfaction, Journal of Information Technology Theory and Application 5(4), Article 4.
Kim K. (1988) Organizational Coordination and Performance in Hospital Accounting Information Systems: An Empirical Investigation.” The Accounting Review, 6: 85-99.
Mitakos, T., Almaliotis, I., & Demerouti, A. (2010) An Auditing Approach for ERP Systems Examining Human Factors that Influence ERP User Satisfaction. Informatica Economica, 14, 78-92. Nah, F.F.H., Lau J.L.S., dan Kuang, J. (2001) Critical Factors for Successful Implementation of
Enterprise Systems, Business Process Management Journal, 7(3): 285--296.
Nicolaou A.I. (2000) A Contingency Model of Perceived Effectiveness in Accounting Information Systems: Organizational Coordination and Control Effects, International Journal of Accounting Information Systems, 1: 91--105.
Ringle C.M., Wende S., dan Will S. (2005) SmartPLS 2/0 (M3) Beta, Hamburg, http://ww.smartPLS.de. Accessed 29 September 2011.
Roses, L. K. (2006) Information System Success: Antecedents of End-User Satisfaction with ERP. EnANPAD-Encontro Nacional de Programas de Pós-Graduação em Administração.
Sajady H., Dastgir M., dan Nejad H.H. July (2008) Evaluation of The Effectiveness of Accounting Information Systems, International Journal of Information Science and Technology, 6 (2). Spathis C. dan Constantinides S. (2004) Enterprise Resource Planning Systems’ Impact on Accounting
APPENDIX CFA Result for EUCS Variable
Component Matrixa Component Matrixa Component Matrixa
Component Component1 Component
1 1 1
T1 .963 E1 .962 A1 .945
T2 .963 E2 .962 A2 .945
Extraction Method: Principal
Component Analysis.
a. 1 components extracted.
Extraction Method: Principal
Component Analysis.
a. 1 components extracted.
Extraction Method: Principal
Component Analysis.
a. 1 components extracted. Component Matrixa Component Matrixa Component Matrixa
Component Component1 Component
1 1 1
F1 .940 C1 .907 KM1 .839
F2 .940 C2 .929 KM2 .873
Extraction Method: Principal
Component Analysis.
a. 1 components extracted.
C3 .928 KM3 .836
C4 .920 KM4 .810
Extraction Method: Principal
Component Analysis.
a. 1 components extracted. KM5 .887 KM6 .801 KM7 .939 KM9 .845 Extraction Method: Principal Component Analysis.