UDC 339.92:338.46
International Trade in Services
Developments in Light of Dynamic Developments in
Competitive Environment
*ANNA OLEFIR, VLADYSLAV TIPANOV**
ABSTRACT. The paper analyses theoretical grounds for determining «services», key peculiarities of international trade in services and its discrepancies from trade in goods, and determines the modern trends of development of this form of international trade according to the main types of services.
KEY WORDS. international trade in services, World trade organization, General Agreement on Trade in Services (GATS), liberalization, transportation, tourism, commercial services, modes of services supply, cross-border trade, consumption abroad, commercial presence, movement of persons.
Introduction
Active development of services sector in the majority of countries is taking place due to the processes of liberalization, integration and globalization of the world economy. The practice reveals that it is one of the most important and rapidly developing sectors of the world economy. Thus, in developed countries the services sector accounts for more than 70 % of GDP, and over 65 % of labor force (in the US — around 75 %).
During the last three decades the volumes of world export of services increased more than 20 times and continue to grow. According to the UNCTAD statistics commercial services in the world trade account for 16,2 % in 1980, 18,4% in 2006, and experts foresee that it can reach 25— 30 % by the year 2015.
* This article is translated from its original in Ukrainian. **
Anna Olefir — PhD, Economic Sciences, Associate Professor of the Chair of International Trade within the Kyiv National Economic Univeristy named after Vadym Hetman. Her focus of research interests includes trade policy and commercial diplomacy of the countries of the world, global trade system. She is the graduate of a range of certificate programs, in particular of the Centre for Trade Policy and Law (Canada, in 2001 and 2005), Virtual Academy of the World Intellectual Property Organization (2006), Program of econometric analysis of EcoMod Network of the Free University of Brussels, (2006).
Vladyslav Tipanov — PhD, Economic Sciences, Senior Lecturer of the Chair of International Trade within the Kyiv National Economic Univeristy named after Vadym Hetman. His primary areas of research include international trade and international investments, regulation of the world services market. He is the author of 12 scientific publications. He took part in a wide range of international conferences, round tables and international projects.
INTERNATIONAL TRADE IN SERVICES DEVELOPMENTS IN LIGHT OF DYNAMIC DEVELOPMENTS IN COMPETITIVE ENVIRONMENT 156
In conditions of competitive environment services sector dynamically develops and becomes one of the most influential factors as regards economic growth, increase of country’s competitiveness on the world markets and improvement of people’s welfare.
Survey of these issues is particularly important for Ukraine, as currently the services sector of the country is not yet adequately developed: its share in the GDP and in employment constitutes around 50 %. The similar situation is with relatively limited participation of Ukraine in international trade in services, and the key goods for export encompass production with low or average level of technological processing. At the same time the country has potential for development of the services sector. Scientific and technological development and highly-qualified labor force are the necessary prerequisites for dynamic development of informational and communicational technologies, software, tourism, e-commerce and mobile trade, which can play the role of the driving force for the whole economy, provide strong competitive advantages on the international markets. Favorable geo-economic layout of the country for the development of the transport infrastructure and tourism should also be used.
With this in mind the survey of world services market developments and its constant diversification, as well as mechanisms of its regulation and functioning in the conditions of globalization has both significant theoretical and practical meanings. In this paper the trends of development of the world trade in services are identified, since the mechanisms and rules of its regulation constitute the separate issue of research.
Key sources of information on trade in services and services market access encompass services schedules of the WTO member-states, legal WTO documents (General Agreement on Trade in Services and agreements in particular sectors, for example, in financial sector and in telecommunications), as well as publications of the international organizations, among which it is necessary to mention practical guides of International Trade Centre of UNCTAD/WTO (e.g., Business Guide to the General Agreement on Trade in Services, Successful Services Exporting: A Handbook for Firms, Associations and Governments, Information Technology Services»: A Handbook for Exporters from developing Countries), WTO surveys (e.g., Special study #6 Market Access: Unfinished Business. Post-Uruguay Inventory and Issues), data of World Bank publications on the development of the various countries (World Development Indicators).
ANNA OLEFIR, VLADYSLAV TIPANOV 157
S. Sutyrin, N. Tarasenko, A. Tedeeva, I. Uspenska, V. Fomicheva, J. Bell, E. VanDuzer, J. Gelbreit, D. Jobber, P. Drucker, М. Kastels, К. Clark, S. Cоen, F. Kotler, J. Kuinn, J. Lankaster etc.
In the Ukrainian economic literature particular aspects of world trade in services are studied, among which it is necessary to pay attention to the following: ‘Global Trade System: development of the WTO institutes, rules and instruments’ edited by Т.Tsygankova, ‘Strategies for economic development in conditions of globalization’ edited by D. Lukyanenko, as well as publications of other Ukrainian economists: О. Bilorus, І. Burakovsky, А. Galchynsky, V. Golovynska, V. Danilchuk, М. Dyadkov, О. Zernezka, А. Mazarakki, V. Novytsky, S. Osyka, Y. Pakhomov, O. Plotnikov, А. Poruchnik, V. Pyatnitsky, О. Rogacha, А. Rumyanzeva, V. Sidenko, S. Sidenko, О.Skalenko, V. Stepanenko, А. Filipenko etc.
The article aims to study peculiarities and trends of development of world trade in services in conditions of further strengthening of economic globalization.
Essence of international trade in services
Services are different in nature and encompass wide area of activities — from trade and transport to financing, insurance and retail. Further development of air companies and banks, hotels and restaurants, training and sports institutions, tourist camps, radio and TV-stations, consultancy and legal firms corresponds to up-to-date development of people, economic systems and scientific and technical progress.
Term ‘services’ is known since times of Antique Greece, but until now there are different approaches towards its definition. In the ‘Big Economic Dictionary’ the services sector is known as ‘system of branches of economy; products, consumption value of which is expressed in rendering the conveniences’1. It has the following peculiarities: high dynamism, territorial segmentation and local character, rapid capital turnover, higher norms of profit and relatively shorter periods of return of investments compared to many sectors of production of goods, and the key categories here encompass term «services» and «trade in services».
Contrary to Adam Smith who considered the work of producer of services to be non-productive, non-creating wealth, but just reallocating it, K.Marks in his work ‘Capital’ showed that labor can be productive, i.e. can create and increase national wealth. Characterizing the services Marks clarified it as the particular consumption value created by this labor as by any other work; however this consumption value has specific title of service since the labor
1 Large economic dictionary. Edit. by Azriliyan, Moscow: Institute of new economy, 1999. —
INTERNATIONAL TRADE IN SERVICES DEVELOPMENTS IN LIGHT OF DYNAMIC DEVELOPMENTS IN COMPETITIVE ENVIRONMENT 158
provides services not in the material form but in a form of activity2... Marks noted that special consumption value provided by this work is expressed in the subjects of consumption of specific kind, since during every moment of time there are goods and services among the subjects of consumption. Thereafter, total sum of consumption always remains larger than it would be without availability of services for consumption3.
The other approach to determining the service is used by the famous economist T.Hill that service can be determined as the change in the state of person or of good that belongs to any economic unit, which is the result of activities of certain economic unit from the previous consent of the first person or economic unit4.
The term ‘service’ of other prominent economists, in particular economists Makkonel and Brue in their book provided the definition of service as something that is not seen but for exchange for that firm or government are ready to provide something valuable5. American scientist P.Kotler determines service as any measure or benefit which one party can propose to other and which are in general intangible and do not lead to owning something. And here provision of service can be tied or not with the good in its material form6.
Surveys of the character and role of services in the economic system are also present in Ukrainian economic literature. In particular, economists
A.Rumyantsev and Y.Kovalenko provide the following definition of services: ‘Service is the type of work during implementation of which the new material product that did not exist before is not created however the qualities of existing one are changing. Moreover, the service can be defined as the activity that satisfies human need, can have or not material form, is closely tied to the production of goods or totally made on its own’7.
Definitions of service in works of Russian scientists include the following. According to the economist O. Kireev ‘services’ represent the change in the state of the institutional unit resulted from actions and on the basis of mutual agreement with other institutional unit8. Scientist V. Kotilko defines services as useful action, beneficial effect of consumption value of good or work,
2 Marks K., Engels F.; 2 edition, V. 26, p. 413. 3 Marks K., Engels F.; 2 edition, V. 26, p. 413.
4 Hill T.P, On goods and services // Review of Income and Wealth. V.23 (December 1977), с. 315—
338.
5 Makkonnell Kempbell, Bryu Stenli L. Economics: principles, problems and politics. in 2 volumes:
М.: Respublika, 1998. — p. 398.
6 Kotler P. Marketing/ translation from English of V. Beaver, М.: publishing house «Progress»,
1990. — p.638.
7
Rumyantsev А., Коваленко Y. International trade in services: 2nd edition — К.: Center of educational literature, 2003 — p. 13.
ANNA OLEFIR, VLADYSLAV TIPANOV 159
which is created in the process of activities satisfying particular needs of people9.
Thereafter, there are many definitions of the term ‘services’ that complicated researches in the field (no single overall recognized definition). At the same time, general qualitative peculiarities of services for practical purposes e.g. for concrete social and economics decisions can be defined. Thus, services have the following features as intangibility, perishability, inseparability and simultaneity in majority of cases.
Intangibility — contrary to material goods, services can not be tasted, touched, seen or felt before the moment of its delivery. This makes impossible comparison and evaluation of services before those are provided. It is possible to compare only benefits expected and obtained.
Inseparability from the source of delivery of service is obvious, whenever the good in material form exists whether its source is available or not. Contrary to goods, services can not be produced in advance and stored. From this point of view delivery and consumption of services are closely interlinked and can not be made independently.
Variability: the quality of services varies in wide range depending on its providers, as well as time and location of delivery. Several reasons for such changeability exist, including the following: services, as a rule, are consumed in time of its delivery which limits possibility for control of its quality; services can not be produced in advance to meet possible higher demand; in case of low quality services can not be always repeated.
Simultaneity. Contrary to the regular good service can not be stored. Thereafter, the problem of equilibrium between the demand and supply appears. Characteristics of services are shown on the graph 1.
9 Kotilko V., Morozova L., Orlova D., Shemeneva O. Services sector and issues of employment. —
INTERNATIONAL TRADE IN SERVICES DEVELOPMENTS IN LIGHT OF DYNAMIC DEVELOPMENTS IN COMPETITIVE ENVIRONMENT 160
Intangibility
is action or effort
complicated evaluation of quality
Inseparability
simultaneous delivery and consumption
importance of role of services provider
importance of selection, preparation and encouragement of personal
CHARACTERISTICS OF SERVICES
Variability
complexity of standardization
need for development of the system of quality control
need for usage of reliable equipment
Simultaneity
consumption can not be postponed
need for ensuring correspondence between demand and supply
attraction of clients to the process of provision of services
Graph 1. Characteristics of services10
In spite of the above-mentioned characteristics exceptions exist. Thus, some services gain materialized form (e.g., computer program on CD), those can be seen (haircut), can be stored (services of phone receiver), and do not always require interaction between the seller and buyer (receipt of cash through the debit card).
In general the services market is too diverse, and the area of application of services enlarges every year. One of the trends that characterize the trade in services is that new technologies complement and substitute other modes of its delivery.
Economic globalization and the development of regional integration processes in larger extent eliminate borders between ‘internal’ and ‘foreign’ services, the same applies to trade in such services.
During the Uruguay round conceptual grounds of international trade in services were defined. Survey of International Trade Centre of UNCTAD/WTO of 1999 clarifies that service becomes the subject of international trade in case if services provider and its buyer (physical or legal entities) represent the residents of different countries whenever the location of operation is situated11. It is necessary to note that GATS does not provide
10
Tkachenko L. Marketing of services: Textbook. — К.: Center of educational literature, 2003. — p. 20.
ANNA OLEFIR, VLADYSLAV TIPANOV 161
definition of the service as the category since too different types of economic activities are covered by this term. It only stipulates that services can be delivered through four modes of supply (cross-border trade, consumption abroad, commercial presence and movement of physical persons).
Term ‘international trade in services’ covers international exchange of various types of services, each having its own features. According to the Agreement on Trade in Services (GATS) services encompass: commercial services (professional, managerial, computer and related), research and development, sales and rent of real estate, leasing and rent of cars and equipment, consultancy, communications (mail, courier, telecommunications etc.), construction and related engineering services, services of distributors, education, healthcare, financial services, organization of leisure, cultural and sports events, tourism, transportation etc.
Currently world services market is under development towards united system. This is witnessed by such processes and facts as substantial changes in tariffs for similar types of services, absence of universal instruments and principles and single mutually accepted services classification which exists for the trade in goods (Harmonized system for description and coding of goods).
International trade in services is characterized by specific features compared to traditional trade in good, namely:
— contrary to goods the services are delivered (produced) and consumed in general simultaneously and are not stored, and thereafter provision of the majority of services is based on the direct contacts between the providers and consumers (this requires larger presence of the direct services providers abroad or presence of foreign consumers in the country of production of service);
— international trade in services is closely interlinked with the trade in goods; these sectors stimulate development of one another (markets analysis, marketing consulting, transportation, advertising etc.);
— services sector, as a rule, is more protected by the state from the international competition than the sector of material production, moreover, transportation and communications, financial and insurance services in many countries traditionally in partially or in whole belong to the state and are strictly controlled by it. Thereafter, there are more protectionist barriers in international trade in services than in trade in goods (though lately significant progress in liberalization of trade in services was achieved thanks to GATS);
— contrary to trade in goods, not all types of services can be widely involved in international trade (in particular, household and communal services).
INTERNATIONAL TRADE IN SERVICES DEVELOPMENTS IN LIGHT OF DYNAMIC DEVELOPMENTS IN COMPETITIVE ENVIRONMENT 162
the whole amount of trade in services between foreign and national legal entities and physical persons in the borders of national territories. Currently more up-to-date methodology for accounting of services trade is being developed covering all four modes of supply.
Volumes of world trade in goods and services in 2006 accounted for more than US $14 billion, of which over 80 % is trade in goods, and almost 20 % — trade in services. Export of services constantly grows and reached US $2,7 billion in the year 2006. Dynamics of exports and imports growth can be seen in table 1. World trade in services is one of the most rapidly growing sectors of the world economy. According to the estimates international trade in services doubles every 7-8 years, compared to 15 years necessary for similar growth of volume of exports of goods.
Table 1
World trade in services in1970-2006 (US $ billion)
Years 1970 1980 1990 2000 2001 2002 2003 2004 2005 2006 2010
Export 67,0 387,9 802 1491 1492,9 1600,5 1828,2 2185,8 2414,3 2710,1 4100,0
Import 62,9 362,8 858,2 1474,6 1491,2 1577,6 1795,5 2130,5 2374,4 2620,2 -
* forecast calculated on the basis of the WTO data (www.wto.org)
Table 2
World Trade in Service by Regions of the World in 1990—2005
Volumes of export, US $ billion
Share of the region in the world exports
Volumes of import, US $ billion
Share of the region in the world imports
1990 2000 2005 1990 2000 2005
Region
1990 2000 2005 1990 2000 2005
444,2 721,9 1244,8 53,51 48,42 51,56 Europe 408,4 674,1 1120,1 47,49 45,71 47,72
411,9 646,2 1120,8 49,62 43,34 46,42 EC-2512 384,2 628,8 1038,2 44,68 42,64 44,23
146,5 309,5 525,3 17,65 20,75 21,76 Asia 205,5 367,9 573,5 23,90 24,95 24,43
165,7 330,9 422,3 19,96 22,19 17,49 North America 145,3 268,2 366,3 16,90 18,19 15,6
30,98 47,1 68,2 3,73 3,16 2,82 South America Central and 36,4 54,6 70,5 4,23 3,7 3,0
21,5 31,3 56,9 2,59 2,09 2,36 Africa 29,9 37,4 69,3 3,48 2,54 2,95
— 17,2 42,1 — 1,15 1,74 CIS — 23,6 62,4 — 1,6 2,66
830,1 1491 2414,3 100,00 100,00 100,00 World total 859,9 1474,6 2347,4 100,00 100,00 100,00
Source: www.wto.org
___________
12 EU in 2005 encompassed 25 member-states and on January 1, 2007 it enlarged due to accession of 2 new members — Romania and Bulgaria. In the text EU with
25 members will be identified as EU-25.
AN
N
A
O
L
EFI
R
, VL
AD
Y
S
L
AV
T
IPAN
O
V
16
INTERNATIONAL TRADE IN SERVICES DEVELOPMENTS IN LIGHT OF DYNAMIC DEVELOPMENTS IN COMPETITIVE ENVIRONMENT 170
Table 3
World leading services exporters and importers in 2006
Rate Exporter
Volumes, US $ billion Share, % Annual
changes, % Rate Importers
Volumes,
US $ billion Share, %
Annual changes, %
1 US 388,8 14,1 10 1 US 307,8 11,6 9
2 United Kingdom 227,5 8,3 11 2 Germany 219,1 8,3 7
3 Germany 168,8 6,1 12 3 United Kingdom 172,0 6,5 8
4 Japan 122,5 4,4 14 4 Japan 144,0 5,4 9
5 France 114,5 4,2 0 5 France 108,8 4,1 4
6 Spain 105,5 3,8 12 6 China 100,3 3,8 21
7 Italy 97,5 3,5 10 7 Italy 98,4 3,7 11
8 China 91,4 3,3 24 8 Ireland 78,4 3,0 12
9 Netherlands 82,5 3,0 5 9 Netherlands 78,1 2,9 8
10 India 73,8 2,7 36 10 Spain 77,9 2,9 17
Total for 10 countries 1472,8 53,4 - Total for 10 countries 1384,8 52,2 —
25 Russian Federation 30,1 1,1 24 18 Russian Federation 44,3 1,7 15
42 Ukraine 10,7 0,5 20 47 Ukraine 8,5 0,4 22
World, total 2755,0 100,0 12 World, total 2650,0 100,0 11
ANNA OLEFIR, VLADYSLAV TIPANOV 165
Europe is the leading region in the world trade in services with around a half of the world services exports and imports. The second and the third places are taken by Asia and North America accordingly. Shares of these regions constitute around 10 %. Countries of Europe, Asia, CIS and Africa demonstrated growth on trade in services during 2000—2005. At the same time, countries of Central and South America were loosing their positions on world services markets, both in exports and in imports.
The following conclusions can be made on the basis of analysis of the data presented in table 3. Ten countries account for over a half of world exports and imports of commercial services. Developed countries take the lead (in particular, the US, United Kingdom, Germany, Japan and France) but developing countries are also represented among those ten (China and India). The share and the role of these countries in the exports of services into the world markets annually increase. Positions of the Russian Federation and Ukraine in the services exports are 25th and 42nd accordingly, and in imports — 18th and 47th.
Specialization of countries in the services sectors is directly tied to the level of their development. In developed countries share of services is increasing as a result of productivity growth and decrease of employment in industry, agriculture and construction sectors, and due to new services development. These countries export financial, information and business services. For developing countries key export services encompass transport, travel and financial (offshore) services. Share of developing countries in the world trade is less than 6 % with leading role of Asian countries. Key services exporters from the developing countries encompass China — 3,3 %, India — 2,7 %; Hong Kong (China) — 2,6 %; Singapore — 2,1 %; Korea — 1,8 %; Taipei (China) — 1,0 % and Turkey — 0,9 %.
Many developing countries have negative balance of trade in services but some of them are larger exporters of services. For example, Korea specializes in engineering, consultancy and construction services, Mexico — in tourism, Singapore is the large financial center. A number of small island countries gain main portion of export revenues from tourism.
Potential of countries of Central and Eastern Europe and CIS for development of services sector, in particular, tourism, transport and others, is high however exports is constrained by the insufficient material and technical base and need for renovations in these areas. Services sector in the countries of CIS is under development. This requires balanced approach to the development strategy, regulation and liberalization of the services sector, in particular. In these countries, the full ‘openness’ of the economy can be destroying (if not complemented by system of selective protectionisms with coordinated trade relations and economic policy)13.
13 Bilorus O., Lukyanenko D. etc. Globalization and safety of development. Monograph / К.: KNEU,
INTERNATIONAL TRADE IN SERVICES DEVELOPMENTS IN LIGHT OF DYNAMIC DEVELOPMENTS IN COMPETITIVE ENVIRONMENT 166
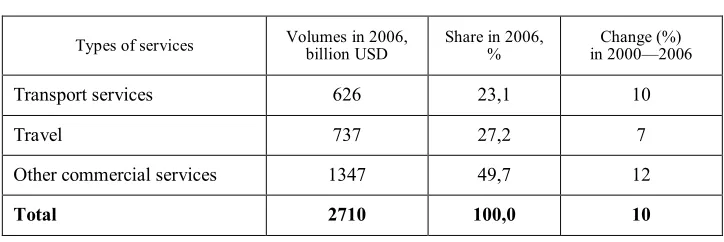
Key three services sectors encompass: transport, travel and other commercial services. In 2006 the structure of exports of commercial services was as follows: other commercial services accounted for 49,7%; transport — 23,1% and travel services — 27,2% (table 4).
Table 4
Services exports in 2006
Types of services Volumes in 2006, billion USD Share in 2006, % in 2000—2006 Change (%)
Transport services 626 23,1 10
Travel 737 27,2 7
Other commercial services 1347 49,7 12
Total 2710 100,0 10
Source: www.wto.org
As can be see from table 4, transport services account for around quarter of world trade in services, a bit more — tourism. The share of other commercial services currently grows, in particular as for informational and telecommunication services, e-commerce etc.
During the last 20 years the share of transport services doubled, volumes of international tourism increased four times, and other services — over 4,5 times as a result of rationalization of transportation and location of production in countries of consumption and development of new services in the world market. Today’s stable trend is towards the increase of travel services, but most dynamically international trade in business services is developing, including managerial, professional, banking, insurance and auditor services accounting for around a quarter of services trade.
ANNA OLEFIR, VLADYSLAV TIPANOV 167
49,7
44,6
37,5
27,2
32,1
33,9
23,1
23,3
28,6
0,0 10,0 20,0 30,0 40,0 50,0 60,0
1990 2000 2006
Other commercial services
Tourism
Transport services
Graph 2. World services exports development (in %)
Source: on the basis of WTO data (www.wto.org)
Analysis of indictors developments in 1990—2006 reveals the trend towards an increase in the overall services trade structure of other commercial services (from 37,5 % in 1990 to 49,7 % in 2006), i.e. during this period those increase to over 12 %. The other trend is towards decrease of the share of travel services: in 1990 those accounted for third of all trade in services, in 2000 — 32 % and in 2006 — 27,2 %. Transport services represent the lowest part but in 2000—2006 this sector showed stable trend towards development (in particular, in 2004, 2005 and 2006 volumes of exports in transportation increased by 25 %, 13 % and 10 % accordingly, which except of the year 2006 was higher than in other key sectors of commercial services). It can be explained by increase in volumes of transportation of cargos and passengers caused by accelerated integration into the world economy of dynamically developing countries, in particular China and India. Developments in transport, travel and other commercial services are analyzed below.
Sector of transport services in international trade
INTERNATIONAL TRADE IN SERVICES DEVELOPMENTS IN LIGHT OF DYNAMIC DEVELOPMENTS IN COMPETITIVE ENVIRONMENT 168
of transportation services during last ten years was 2,5 % i.e. increased 9 times, whereas the global production increased on average by 1—2 %. Economic integration in today’s world, increase of international trade and significant development of tourism contribute to further progress in transportation development.
Role of transport for today’s world economy is hard to overestimate. It represents the necessary element of production processes and is rightfully considered to be the blood system of the economy.
Term ‘transportation system’ or ‘transport services’ covers all types of transportation of cargos, transportation of people, and related operations.
In each country transportation system has its own national peculiarities, but taken together those represent the world transportation system which is characterized by the following parameters: inequality of sectors development; large investments into its objects and long terms of return on investments in the majority of cases; sensitivity to financial effectiveness indictors in overall economy; high entrepreneurial risk; large dependence on other services (e.g. tourism, leasing, informational services and communications) etc.
International transportation can be made through different types of transport: maritime, river, railway, automobile, pipeline and air transport, each with its own peculiarities.
Today large part of cargo and passenger’s flows is made in the following directions: Europe-Asia, Asia-America and Europe-Africa. And the priority is given to the first direction which has the largest distance. Maritime transportation has the leading role in the market, accounting for 80% of the total transportation of cargos in international trade. And volumes of international maritime transportation annually grow.
Overall volumes of transport services exports annually increase (from 2003 to 2006 transport services grew by 53%: from US $409 to US $630 billion), but their share in the volume of commercial services during the last 15 years decreased approximately by 15 %. Developments in world transportation services exports are illustrated on the graph 3. With such pace by 2010 world exports of transportation services can reach US $1,1 trillion.14
ANNA OLEFIR, VLADYSLAV TIPANOV 169
23,3 23,1 23,3 23,1 22,5 22,4 23,2 23,6 23,1
314 325 348 345
361 409
508 569
626
20,0 30,0 40,0 50,0
1998 1999 2000 2001 2002 2003 2004 2005 2006
0 100 200 300 400 500 600 700
— shares, % — volumes, U S $ billion
Graph 3. World exports of transport services in 1998-2006.
Source: on the basis of WTO data (www.wto.org)
Leading region in the world trade of transport services is Europe. Countries of European Union (25) in 2006 accounted for 44,4% of world exports and 35,4% of world imports of such services. Developed countries prevail in exports of transport services. Among leading exporters of transport services many countries represent sea states (Netherlands, Denmark, Greece, Singapore etc.), which can de explained by the importance of maritime transportation in the world trade in particular of raw materials (share of which in the world trade was growing since 2005). In 2006 Ukraine took 15th place among the leading exporters of transport services with the level of exports equal to US $5,4 billion or 0,8% of the world market (25 countries of EU in this rating occupy the first place). This level for Ukraine was reached due to the pipeline system used to transit natural gas to the European countries. Leading exporters and importers by volumes of transportation are presented in the table 5.
Leading importers of transport services encompass countries of EU, US and Japan with 53,5 % of world imports. The role of China and India gradually grows in imports since these economies are dynamically developing
Table 5
Leading exporters and importers of transport services in 2006
Volumes,
billion USD Share, % Change, %
Volumes,
billion USD Share, % Change, % Exporters
2006 2000 2006 2000—06
Importers
2006 2000 2006 2000—06
1 EU-25 280,5 42,2 44,4 11 1 EU-25 266,2 35,2 35,4 10
2 US 70,3 14,5 11,1 6 2 US 92,9 15,7 12,4 6
3 Japan 37,6 7,3 6,0 7 3 Japan 42,8 8,0 5,7 4
4 Korea 25,9 3,9 4,1 11 4 China 34,4 2,5 4,6 22
5
Hong Kong,
China 22,3 3,7 3,5 10 5 India 25,1 2,1 3,3 19
6 China 21,0 1,1 3,3 34 6 Korea 23,4 2,6 3,1 13
7 Singapore 19,4 3,4 3,1 9 7 Singapore 22,1 3,1 2,9 10
8 Norway 15,2 2,8 2,4 8 8 Canada 16,9 2,2 2,3 10
9 Canada 10,7 2,2 1,7 6 9 Thailand 15,9 1,6 2,1 15
10
Russian
Federation 10,1 1,0 1,6 19 10 UAE 11,6 1,1 1,5 —
Total for 10
countries 513,0 82,1 81,2 —
Total for 10
countries 551,3 74,1 73,3 —
Source: on the basis of WTO data (www.wto.org)
ANNA OLEFIR, VLADYSLAV TIPANOV 171
During last years key indictors of the world transportation system show the positive trend for growth. E.g., share of the world cargos turnover per ton of produced goods increased almost by one third and cargos turnover per capita and kilometric movement of population increased in 3,5—4 times.
Analysis of changes happening and forecasted on the international markets of transport services allows to make the conclusion that in the nearest future increase of transportation of cargos and passengers together with growth of their efficiencies should be expected. Improvement of material and technical base and usage of new informational and communicational technologies, in its turn, will largely influence on its economic indicators, increase quality of services and security of transportation. It’s clear that character and pace of changes will be different in different regions and countries taking into account difference of economic development there.
World transport market itself will be mainly determined by the counteraction and further development of three main centers: North America headed by the US; EC and Asia-Pacific region with Japan, South Korea, China and range of other countries. E.g., in the US cargos turnover by all types of transport will most likely grew by 2015 approximately in 1,4 times compared to 1995, and in Germany and Japan — in 1,16 and 1,4 times accordingly (see table 6).
Table 6
Changes of cargos turnover in transportation systems (bln. tkm)15
Data Forecast
Country
1980 1990 1995 2000 2015
US 8568,0 11090,0 12400,0 13700,0 17360,0
Japan 1124,2 1438,4 1635,0 1850,0 2300,0
Germany 891,3 1208,0 1279,0 1250,0 1485,0
Development of international transport system is characterized by the following trends: decrease of tariffs for all types of transportation; increase of volumes of cargos and passengers turnover; strengthening of mutual exchangeability of different types of transport; development of mixed transportation; appearance and usage of container transportation; increase of effectiveness of logistical systems using new IT technologies; stable role of government interventions into the trade in transport services. World transport infrastructure which is the system of global scale largely influences the growth in world trade volumes and supports the further internationalization and globalization of the world economic relations.
World trade in travel services
Tourism is not only the most important economic, political, social and ecological issues in 21 century but is also one of the most dynamic sectors of
15 Stepanov О. World trade, transport and developments of ports economy: Monograph. Odessa:
INTERNATIONAL TRADE IN SERVICES DEVELOPMENTS IN LIGHT OF DYNAMIC DEVELOPMENTS IN COMPETITIVE ENVIRONMENT 172
the economy. During last several decades the world travel industry had the growth rates twice time higher than growth rates of GDP. Share of tourism in 2006 accounts for 27,2 % of total volumes of world trade in services. Development of the travel industry is estimated by the economists quite optimistically as the dynamic one. It is expected that travel sector will be growing in the future due to the increase of population and growth of living standards, improvement and enlargement of transportation systems, increase of people’s spare time, development of e-commerce and telecommunication technologies, as well as other reasons.
This area is characterized by the high levels of development. Thus, if in 1950 travels were made by 25 million people, for the last 50 years their number increased approximately 30 times.
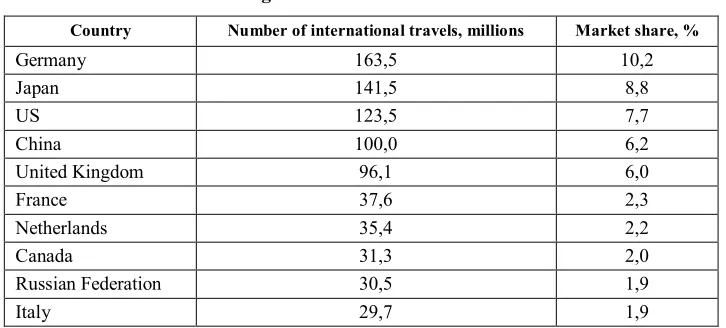
In future even in conditions of political, economic and ecological crisis, further dynamic development of the world tourism is expected. According to the forecasts by 2010 foreign countries will be visited by around 1 billion tourists and by 2020 their number will reach 1,5 billion people16. According to the forecasts of the specialists the top ten countries of tourism in 2020 will look as follows (see table 7).
Table 7
Leading countries of tourism in 202017
Country Number of international travels, millions Market share, %
Germany 163,5 10,2
Japan 141,5 8,8
US 123,5 7,7
China 100,0 6,2
United Kingdom 96,1 6,0
France 37,6 2,3
Netherlands 35,4 2,2
Canada 31,3 2,0
Russian Federation 30,5 1,9
Italy 29,7 1,9
Together with the number of visits by tourists data on revenues from international tourism are widely used. Revenues according to the World Tourism Organization include ‘revenues of countries from the consumer expenses of tourists (i.e. payment for goods and services) made by them at the territory of any country’.
16
Chudnovsky А., Gukov M. Management of tourism: text-book. — М.: Finances and statistics, 2003 — p. 10—11.
17Chudnovsky А., Gukov M. Management of tourism: text-book. — М.: Finances and statistics, 2003
ANNA OLEFIR, VLADYSLAV TIPANOV 173
According to the World Tourism Organization total volume of revenues from international tourism in 2010 will account for US $1325 billion, and global demand for travel will constitute around US $8972 billion18.
It is necessary to take into account that international tourism is an important source of foreign currency transfers into any country. Thus, for 83% of the world countries tourism is one of the five most important sources of revenues, and for 38 % of countries it is the key revenue. It also has an impact on the overall level of employment. Currently tourism industry provided jobs to around 10% of all people employed in the world.
Current trend is also quick but unequal development of the world tourism. In general world travel flows are formed and made among developed countries. On average around 2/3 of international travels belongs to developed countries and around 1/3 — to developing counties.
According to the statistical methodic of the World Tourism Organization member-states of this organization are divided by geographical criteria into six regions: Asian-Pacific, America, Africa, Middle East, South Asia and Europe. By the terminology of this organization countries-providers of tourists encompass the US, Canada, Germany, Swiss, United Kingdom and Japan. Countries-recipients of the tourists encompass Italy, Spain, France, Switzerland, Australia and Mexico. Top ten exporters and importers of travel services in the world are shown in the table 8.
For many countries international tourism became very profitable sector of economy and revenues from it — important component of national budgets. Travels and tourism stimulate development of investment projects on transportation, hotel and tourism infrastructure building (in particular, airports, roads, maritime ports, restoring of historical monuments, museums and development of areas preserving nature) which increase both the quality of life of local population and service of tourists.
__________
18 UNCTAD ‘E-commerce and Tourism’ 2000, TD/B/COM.3/EM.9/2, Annual Report of World
ANNA OLEFIR, VLADYSLAV TIPANOV 177
Table 8
Leading exporters and importers of travel services in 2006
Volumes, billion
USD
Share, % Change, %
Volumes,
billion USD Share, % Change, % Exporters
2006 2000 2006 2000—06
Importers
2006 2000 2006 2000—06
1 EU-25 312,5 41,1 41,8 8 1 EU-25 311,0 43,7 44,9 8
2 US 106,7 20,5 14,3 1 2 US 78,3 15,1 11,3 3
3 China 33,9 3,4 4,5 13 3 Japan 37,0 7,2 5,3 2
4 Australia 17,9 1,9 2,4 12 4 China 24,3 3,0 3,5 11
5 Turkey 16,9 1,6 2,3 14 5 Canada 20,5 2,8 3,0 9
6 Japan 15,9 1,8 2,1 11 6 Russian Federation 18,8 2,0 2,7 13
7 Canada 14,7 2,3 2,0 5 7 Korea 18,2 1,6 2,6 17
8 Thailand 12,4 1,6 1,7 9 8 Hong Kong, China 14,0 2,8 2,0 2
9 Mexico 12,2 1,7 1,6 7 9 Australia 11,8 1,4 1,7 11
10 Switzerland 11,9 1,6 1,6 7 10 Norway 11,4 1,0 1,6 16
Total for 10
countries 555,0 77,5 74,3 — Total for 10 countries 545,3 80,6 78,6 —
Source: on the basis of WTO data (www.wto.org)
ANNA OLEFIR, VLADYSLAV TIPANOV 175
Tourism is one of the few branches of the world economy with the constant increase of working places which in 1,5 times exceeds this average indicator for other sectors of economic activities. According to the World Travel and Tourism Council19, in 2004 around 73,7 million people or 2,8 % of employed in the world economy worked directly in the area of travels and tourism, and in related areas — around 215 million people more (8,1 % of the population of planet capable to work). By the number of employed China, India, the US, Indonesia, Japan, Brazil, Russia, Germany, Spain and France dominate. It is expected that employment in the above-mentioned areas of the world economy by 2014 will reach 8,6 % of the population of the earth capable to work20. By 2020 number of travels according to the estimates of the specialists of the World Tourism Organization might triple compared to current data21.
During the last decade international trade in travel services was steadily growing and in 2006 reached around US $740 billion, i.e. higher by 68 % of that in 2000. Developments in travel sector are illustrated on graph 4.
32,9 32,7 32,1
31,3 30,6
29,4 29,1 28,4
27,2
444 460 478 468 489
537
635 685
737
20,0 30,0 40,0 50,0
1998 1999 2000 2001 2002 2003 2004 2005 2006
0 100 200 300 400 500 600 700 800
— shares, % — volumes, U S $ billion
Graph 4. Volumes and share of travel services in the structure of commercial services in 1998—2006.
Source: on the basis of WTO data (www.wto.org)
It is necessary to highlight certain aspects and trends of international trade in travel services. Tourism representing the sector which covers wide range of economic activities is one of the largest industries in the world. Enlargement of tourism is influenced by a number of economic, political, ecological, social, demographic and other factors. Lately structure and direction of world tourist
19
Annual Report of World Travel and Tourism Council, 2005.
INTERNATIONAL TRADE IN SERVICES DEVELOPMENTS IN LIGHT OF DYNAMIC DEVELOPMENTS IN COMPETITIVE ENVIRONMENT 176
flows are largely influenced by multinational corporations. It is expected that during next 20 years scales of international tourism will triple.
Natural balance worsening adversely affects tourism. Sustainable economic development supports tourism development. Rates of transport tariffs, tax and price policies, financial instability, customs formalities, political instability and terrorism also influence significantly the sector.
Particular attention should be paid to the statistics both on international and national level. It is obvious that uncontrolled increase of tourism aimed only at rapid receipt of revenues has negative consequences, as it damages the environment and ruins the basis on which this sector functions and successfully grows.
Currently it is necessary to forecast, and if possible when planning to take into account developments in tourism sector for a decade ahead. And that is why it is necessary to conduct further work on improvement of existing methods and methodologies for determination of statistical information and indexes in tourism industry.
In the report on tourism developments for the next 5 years published by European Commission, the following key trends of tourism in the world were identified. The European countries will face hard competition for profits in this sector due to redirection of touristic flows. This will require of European tourist industry the subsequent upgrading and creation of new attractive types of tourist services. Trips will likely be shorter, less costly but people will travel more often. Gradually the trend towards consumption of more high-quality tourist products will evolve. Share of intercontinental trips from Europe to Asia, America, Australia and others will grow.
Further integration of European tourism into world tourism and effective marketing will be instrumental for the decline of the negative influences caused by the seasonal factors. Trips using the most rapid kinds of transport (aviation, rapid trains etc.) will demonstrate the highest growth rates in the general structure of travels.
The trend towards decrease of number of tourists in organized groups and increase of family travels will stay. And demand for flexible individual family programs will grow. Developments in informational technologies will provide better and quicker ways for making necessary reservations. The most mobile groups will include aged people and youth. Tourism with learning purposes and active tourism will likely demonstrate the most high growth rates. Ecological issues will become one of the key concerns after the safety of trip.
ANNA OLEFIR, VLADYSLAV TIPANOV 177
reaching the usual comfort as at home; continued population of travels to ‘sunny’ countries with good weather and high level of service; reduction of vacations duration and increased use of weekends; travels with rapid change of places, impressions and surrounders; growth of travels by cars, club travels; increase of last minute tours etc.
If tourism in the end of the last century reflected changes in transport technologies, now it will be mainly determined by the developments in telecommunication technologies and e-commerce. And this, in its turn, will result in inclusion of new countries and regions of the world into international tourism, contributing to increase of scales and diversification of tourist services.
Other commercial services
According to the WTO classification the other commercial services encompass communications services, construction and engineering services, insurance services, financial services, computer and informational services, royalties and licensing payments, individual cultural and recreation services, other business services. And other business services consist of professional services (legal, accounting, engineering, medical and others), research and development, real estate, entrepreneurial services (consultancy, advertising etc.).
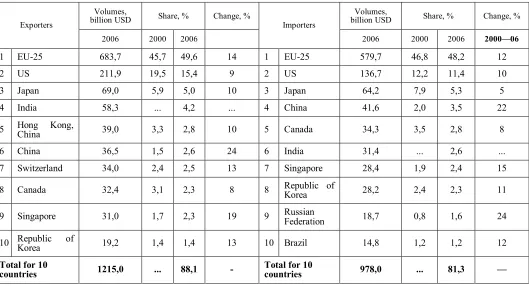
The export of other commercial services grew with extremely high levels and reached the value of US $1,3 trillion by 2006 i.e. doubled compared to the value of 2000 (graph. 5). Exports of EU-25 accounted for US $684 billions in 2006 (1 place, with around half of volumes), value of export of the United States was around US $212 billion (2 places, around 15 %). Other countries strengthen the positions as exporters of other commercial services, gradually increasing their role in world exports of services. I.e., in 2006 exports of India grew almost by 40 %, and of Russian Federation — over 30 %.
INTERNATIONAL TRADE IN SERVICES DEVELOPMENTS IN LIGHT OF DYNAMIC DEVELOPMENTS IN COMPETITIVE ENVIRONMENT 178
44 44 45 46
47 48 48 48
50
592 620
664 680
751 882
1042 1161
1347
20 25 30 35 40 45 50 55
1998 1999 2000 2001 2002 2003 2004 2005 2006
0 200 400 600 800 1000 1200 1400
— shares, % — volumes, U S $ bill ion
Graph 5. Volume and share of other commercial services in the overall structure of commercial services in 1998—2006.
Source: on the basis of WTO data (www.wto.org)
Analyzing volumes of other commercial services exports by leading exporters one can note the large share of the US — around 15,4 % of the world exports (although in 2000 this share was almost 20 %). Shares of such countries, as Great Britain, Japan, France, Hong Kong (China) are also decreasing. Growth of other commercial services exports demonstrated such countries, as India, China, Germany, Italy, Spain and Ireland.
ANNA OLEFIR, VLADYSLAV TIPANOV 185
Table 9
Leading exporters and importers of other commercial services in 2006
Volumes,
billion USD Share, % Change, %
Volumes,
billion USD Share, % Change, % Exporters
2006 2000 2006
Importers
2006 2000 2006 2000—06
1 EU-25 683,7 45,7 49,6 14 1 EU-25 579,7 46,8 48,2 12
2 US 211,9 19,5 15,4 9 2 US 136,7 12,2 11,4 10
3 Japan 69,0 5,9 5,0 10 3 Japan 64,2 7,9 5,3 5
4 India 58,3 ... 4,2 ... 4 China 41,6 2,0 3,5 22
5 Hong Kong,
China 39,0 3,3 2,8 10 5 Canada 34,3 3,5 2,8 8
6 China 36,5 1,5 2,6 24 6 India 31,4 ... 2,6 ...
7 Switzerland 34,0 2,4 2,5 13 7 Singapore 28,4 1,9 2,4 15
8 Canada 32,4 3,1 2,3 8 8 Republic of
Korea 28,2 2,4 2,3 11
9 Singapore 31,0 1,7 2,3 19 9 Russian
Federation 18,7 0,8 1,6 24
10 Republic Korea of 19,2 1,4 1,4 13 10 Brazil 14,8 1,2 1,2 12
Total for 10
countries 1215,0 ... 88,1 -
Total for 10
countries 978,0 ... 81,3 —
Source: on the basis of WTO data (www.wto.org)
AN
N
A
O
L
EFI
R
, VL
AD
Y
S
L
AV
T
IPAN
O
V
1
7
INTERNATIONAL TRADE IN SERVICES DEVELOPMENTS IN LIGHT OF DYNAMIC DEVELOPMENTS IN COMPETITIVE ENVIRONMENT 180
Let’s determine what services prevail in the structure of other commercial services, both in the world and in separate regions. Such approach will allow to identify key services in exports of separate regions and to understand relevance of regions’ export specialization to the world trend. In 2005 other business services accounted for the half of world exports of other commercial services, while financial represented 14%, royalty and licenses — 11%, computer and information services — 9%. The structure of world exports of other commercial services is shown in the table 10.
Table 10
World exports of other commercial services in 2005
Types of other commercial services Share, %
Other business services (professional services, for example, legal, accounting, engineering, medical and etc., research and development, real estate, entrepreneurial services, consultancy, advertisements and so on)
50
Financial services 14
Royalty and licensing payments 11
Computer and informational services 9
Communications 5
Construction and engineering services 4
Insurance services 4
Personal cultural and recreation services 3
Source: on the basis of WTO data (www.wto.org)
ANNA OLEFIR, VLADYSLAV TIPANOV 181
services keep this position thanks to functioning regional and global financial markets, it is especially true for markets of securities.
Groups of services with approximately similar shares in the overall structure of exports of other commercial services follow. Around 5 % belongs to insurance services, since insurance is important for modern business: developed insurance sector assists the development of entrepreneurship and solution of social issues. Construction and engineering services, as well as communication services account for 4 % each, while personal, cultural and recreation services — around 3 %.
4% 4% 5% 12% 8% 14% 3%
50%
Communications
Construction and engineering services
Insurance services
Financial services
Computer and informational services
Royalty and license payments
Personal, cultural and recreation services
Other business services
Graph 6. Structure of other commercial services in world exports in 2004 (%)
Source: on the basis of WTO data (www.wto.org)
INTERNATIONAL TRADE IN SERVICES DEVELOPMENTS IN LIGHT OF DYNAMIC DEVELOPMENTS IN COMPETITIVE ENVIRONMENT 182
4%
5% 7% 15% 9%
9% 3%
48%
Communications
Construction and engineering services
Insurance services
Financial services
Computer and informational services
Royalty and license payments
Personal, cultural and recreation services
Other business services
Graph 7. Structure of other commercial services exports in Europe (%)
Source: on the basis of WTO data (www.wto.org)
Structure of export of other commercial services in Asia is demonstrated on graph 8. Other business services represent the significant share in the general structure of export (around 60 %), the second largest sector consists of computer services (10 %) and those are the 2 key industries the Asian region specializes on. Smaller share (if to compare with the average world indicators) belongs to financial services (10 % against 15 %), insurance services (3 % against 5 %) and royalties and licensing payments (9 % against 14 %). In relation to the last group (royalties and licensing payments), the disputes between the USA and China frequently arise as regards protection of the intellectual property rights (for example, infringement of copyrights, problem of piracy and industrial espionage).
4%
5% 3% 8% 10% 9%
2%
59% Communications
Construction and engineering services
Insurance services
Financial services
Computer and informational services
Royalty and license payments
Personal, cultural and recreation services
Other business services
Graph 8. Structure of other commercial services exports of Asia in 2004 (%)
Source: on the basis of WTO data (www.wto.org)
ANNA OLEFIR, VLADYSLAV TIPANOV 183
largest share belongs to royalties and licensing payments (27 %) due to the well-developed trade in intellectual property rights. Computer services represent only 5 %, but if to take into account circumstance that part of computer services is connected to royalties, in fact those do also make substantial revenues from exports. Somewhat lower share belongs to other business services, and bigger — to personal, cultural and recreation services (5 % against 3 % for the world on average).
4%
2%
5% 13%
5% 27%
5%
39%
Communications
Construction and engineering services
Insurance services
Financial services
Computer and informational services
Royalty and license payments
Personal, cultural and recreation services
Other business services
Graph 9. Structure of other commercial services exports of North America in 2004 (%)
Source: on the basis of WTO data (www.wto.org)
Structure of other commercial services exports in the countries of the CIS does not correspond to that of the world (graph 10). The share of other business services is 55 %. However, unjustifiably large share belongs to construction and communication services. Shares of all other sectors constitute only from 2 to 4 %. A region has substantial potential for development of services sector (and their export), which can be reached only in case of improvements of the business environment in these countries.
INTERNATIONAL TRADE IN SERVICES DEVELOPMENTS IN LIGHT OF DYNAMIC DEVELOPMENTS IN COMPETITIVE ENVIRONMENT 184
10% 19%
3% 4% 4% 3%
2%
55%
Communications
Construction and engineering services
Insurance services
Financial services
Computer and informational services
Royalty and license payments
Personal, cultural and recreation services
Other business services
Graph 10. Structure of other commercial services exports of the CIS in 2004 (%).
Source: on the basis of WTO data (www.wto.org)
Characteristic feature of the world trade in services development is an increase of the foreign direct investments (FDIs) volumes made by MNCs into this sector. In the beginning of 1970th services accounted only for 1/4 of the total volume of in the world, while in 1990 this share was lower than a half, and for now it reached over US $5 trillion and represent around 60 % of FDIs. Leaders by volumes of FDIs into the services sector encompass developed countries of the world: the US, Japan and EU countries. However share of FDIs from developing countries also increases.
Increase of volumes of FDIs made by MNCs into the services sector results in upgrade of quality of services, decrease of its cost, development of new services not provided by local suppliers and so on. Global growth of the world market in services imposes new requirements for improvements in its regulation on all levels: global, regional, international, national and sectoral.
Conclusions
In last three decades the volumes of world exports of services increased more than 20 times and continue to grow. In conditions of globalization of the world economy the services sector dynamically grows and becomes one of the influential factors of economy growth, increase of competitiveness of country in the world markets and improvement of people’s welfare.
ANNA OLEFIR, VLADYSLAV TIPANOV 185
united sectoral market as the commodity market, it only develops towards integrity.
International trade in services has specific features compared to traditional merchandise trade. It is closely tied with merchandize trade. And these sectors influence each other’s development (e.g. markets analysis, marketing and consulting, transportation, advertising, pre-selling and after-sale service).
As a rule the services sector is more protected by the state from the foreign competition than material production. Moreover, transport and connections, financial and insurance services in many countries traditionally are in complete or partial state ownership, and strictly controlled by it. Thereafter, there are more barriers in international trade in services than for merchandise trade (although lately due to GATS there is considerable liberalization of trade in services). Contrary to merchandise, not all types of services can participate in an international exchange (for example, household or public utilities).
Balance of payments statistics accounts mostly foreign trade in commercial services rendered by two of four methods of services delivery, namely cross-border and consumption abroad. However, the real volumes of world trade in services are much higher. International statistics do not show trade in services between foreign and national legal and physical persons within the borders of national territory.
Volumes of the world trade in goods and services in 2006 constituted around US $14 trillion of which over 80 % was merchandise trade and around 20 % — trade in services. The export of services constantly grows and reached US $2,7 trillion in 2006. The international trade in services doubled each 7—8 years, as compared to 15 years required for the similar increase in volumes of merchandise exports.
In the beginning of the new millennium the services sector develops in all regions of the world. This is also true for developing countries and least developed countries. Role of these countries grows both in exports and in imports. However, Triad countries continue to dominate in this sector of world economy.
Ten countries of the world make over the half of volumes of world exports (and imports) of commercial services. Top trading nations in rating encompass highly developed countries (in particular, the US, Great Britain, Germany, Japan, France), but developing countries also present among top ten (China and India). Share and role of these countries in exports of services into the international markets annually grow. Russian Federation and Ukraine occupy accordingly 25 and 42 places in export of services, and in import — 18 and 47 places. Both countries have large potential for the development of the sector (in particular, of transport, tourist, professional, computer services, outsourcing and others).
INTERNATIONAL TRADE IN SERVICES DEVELOPMENTS IN LIGHT OF DYNAMIC DEVELOPMENTS IN COMPETITIVE ENVIRONMENT 186
particular services is related to the level of its economic development and geographical location. In highly developed countries the share of services increases as a result of productivity growth and reduction of employment in industrial, agricultural, construction sectors, and the development of new services. For these countries export of financial, informational and business services prevails. In developing countries the key types of services for exports encompass transportation, tourism and financial (offshore) services.
References
1. Bilorus O., Lukyanenko D. etc. Globalization and safety of development: Monograph. — К.: KNEU, 2001. — 733 p.
2. Big economic dictionary/ ed. by А. Azriliyan. — М.: Institute of new economy, 1999. — 1012 p.
3. Kireev A. International Economy: in 2 volumes — М.: International economy, 2000. — 263 p.
4. Kotilko V., Morozova L., Orlova D., Shemeneva O. Services sector and issues of employment. — М.: MGU service, 2001. 98 p.
5. Kotler P. Marketing/ translation from English of V. Beaver. — М.: publishing house «Progress», 1990. — 734 p.
6. Makkonnell Kempbell, Bryu Stenli L. Economics: principles, problems and politics. — In 2 volumes: М.: Respublika, 1998. — 400 p.
7. Rumyantsev А., Коваленко Y. International trade in services: 2nd edition — К.: Center of educational literature, 2003 — 112 p.
8. World tourism goes upwards //Governmental courier, 24 July, 2004. 9. Stepanov О. World trade, transport and developments of ports economy: Monograph. Odessa: Astroprint, 2001. — 124 p.
10. Tkachenko L. Marketing of services: Textbook. — К.: Center of educational literature, 2003. — 192 p.
11. Chudnovsky А., Gukov M. Management of tourism: text-book. — М.: Finances and statistics, 2003. — 288 p.
12. UNCTAD ‘E-commerce and Tourism’ 2000, TD/B/COM.3/EM.9/2.
13. Annual Report of World Travel and Tourism Council, 2005.
14. Hill T.P. On goods and services // Review of Income and Wealth. V. 23 (December 1977), p. 315-338.
15. International Trade Statistics 2007 — http://www.wto.org
16. The Results of the Uruguay Round of Multilateral Trade Negotiations. The Legal Texts. WTO. Cambridge University Press. 2002. p.286
17. World Tourism Organization Report. (http://www.world-tourism.org) 18. WTO Annual Report 2007 — http://www.wto.org