Automatic Data-Driven Approaches for Evaluating the Phonemic Verbal
Fluency Task with Healthy Adults
Hali Lindsay, Nicklas Linz German Research Center for Artificial Intelligence (DFKI),
Saarbr¨ucken, Germany [email protected] [email protected]
Johannes Tr¨oger, Jan Alexandersson German Research Center for Artificial Intelligence (DFKI),
Saarbr¨ucken, Germany [email protected] [email protected]
Josef Van Genabith German Research Center for Artificial Intelligence (DFKI),
Saarbr¨ucken, Germany
Christoph Kaller Faculty of Medicine, Freiburg Brain Imaging Center,
University of Freiburg, Freiburg, Germany
Abstract
Phonemic Verbal Fluency (PVF) is a cogni-tive assessment task where a patient is asked to produce words constrained to a given alpha-betical letter for a specified time duration. Pa-tient productions are later evaluated based on strategies to reveal crucial diagnostic informa-tion by manually scoring results according to predetermined clinical criteria. In this paper, we propose four alternative similarity metrics and evaluate them in a two-fold argument, us-ing the clinical criteria as a baseline. First, we consider the capacity of each metric to model PVF production using a rank-based approach, and then consider the metrics ability to com-pute finer resolution clinical measures that are indicative of the underlying strategy. Automa-tion of the clinical criteria and proposed met-rics are evaluated on PVF performances for 16 letters from 32 healthy German students (n=512). Weighted phonemic edit distance performed best overall for modelling both pro-duction and strategy.
1 Introduction
Phonemic Verbal Fluency (PVF) is a standard neu-ropsychological test that is used to assess cogni-tive abilities. During this task, a person is asked to produce as many words as possible starting with a given letter in a specified amount of time. Classically, the PVF performance is then scored by counting the total number of unique words produced, however more fine-grained measures
of performance (i.e. strategy) have been estab-lished to differentiate between multiple patholo-gies (Gruenewald and Lockhead,1980). Troyer et al. (Troyer et al.,1997) first proposed a framework for assessing the strategy of a PVF performance: a rule-based system to determine phonemic clus-ters by manually defining criteria for phonemic similarity (Vonberg et al., 2014). According to this criteria, consecutive words in a production are lumped into categories if they share common first letters (e.g. arm & art), rhyme (e.g. stand & sand), share first and last sounds (e.g. sat,seat &soot) or are homonyms (e.g.some&sum).
In the case of SVF, the similarity metric is seman-tically motivated.
Given the sparse body of research on automatic PVF analysis schemes modelling both production and strategy, further investigation on more sophis-ticated data-driven modelling approaches to PVF is needed. The goal of this paper is two-fold:
(1) First, we aim to introduce and compare the performance of five different similarity met-rics for modelling production of PVF–in cog-nitively healthy participants–across sixteen letter categories, including an automated version of the current clinical criteria.
(2) Second, we propose a data-driven cluster-ing scheme for determincluster-ing phonemic clusters as a means of evaluating production strategy. In both experimental conditions, we compare the novel metrics to an implementation of the classic clinical Troyer baseline, described previously, to evaluate performance.
2 Related Work
Little previous research has proposed similar data-driven approaches for PVF evaluation which re-quires a phonemic similarity metric, respectively. Ryan et al. (Ryan et al., 2013) determined phonemic clusters in PVF tasks using a phone-mic similarity score, based on edit-distance be-tween phoneme representations from a pronunci-ation dictionary, and a common biphone score, a binary variable encoding the presence of a com-mon initial and/or final biphone. They compared PVF performances (letterF) of martial arts fight-ers with high and low exposures (according to number of fights) and found significant differ-ences in the groups mean and maximum cluster length for both biphone and phonemic similar-ity score approaches, and significant differences for the mean pairwise phonemic similarity pro-vided by the common biphone method. This ex-ploratory result demonstrates the potential of au-tomated qualitative PVF analysis in the context of neurocognitive syndromes.
However, this approach does not capture the effect that phonemic properties might influence strategy, e.g. that some phonemes are closer in articulation than others. Previously, authors have proposed methods to weight edit-distance between phonemic representations with features reflective of the similarity between phonemes. Fontan et al.(Fontan et al., 2016) used
Leven-shtein (Levenshtein, 1966) distance between dif-ferent phonemes, weighted by common features shared between them. Through this, they propose a new metric to evaluate automatic speech recog-nition systems, that seem to be consistent with hu-man perception. Zampieri et al. (Zampieri and de Amorim, 2014) proposed a metric to enhance target word recovery for spell checking in English where they combined two weighted instances of Levenshtein distance. First, between the edit dis-tance between two words normal spelling is cal-culated and then between the four digit Soundex code representations, where the Soundex algo-rithm represents similar sounding words as the same representation. This was combined with clustering techniques to improve spell checking. Similar methods have been used to measure pro-nunciation differences of dialects in Norwegian where weighted Levenshtein distance using pho-netic representations and acoustic features were used with clustering techniques (Heeringa,2005). Given this, there is a substantial gap in advanc-ing the state of the art in data-driven modelladvanc-ing of PVF speech output that can be leveraged for clini-cal applications.
3 Methods
Closing this gap, this section describes four pro-posed distance metrics for measuring similarity as well as the clinical baseline and details a rank-cost evaluation criteria to compare all metrics’ ability to model PVF productions. Furthermore, this methodology is used in a second performance evaluation of each metric for modelling clinical clustering and switching strategy based on clus-ters defined by the affinity propagation clustering algorithm (Frey and Dueck,2007).
3.1 Modelling Production
3.1.1 Metrics
Levenshtein distance (Levenshtein,1966) is com-puted as the number of insertions, deletions and substitutions that are necessary to transform one word into another word. Let d, iandsrepresent the cost of deletions, insertions and substitutions respectively.
1. LD: The Levenshtein distance between the orthographic representation of words
pho-netic similarity. Phonological feature vectors are obtained from Epitran using Panphon’s database of International Phonetic Alpha-bet (IPA) symbol features (Mortensen et al., 2016). Each phonetic symbol is represented by a fixed-length vector of integers between -1 and 1 representing the presence (+1), ab-sence (0), or lack (-1) of 21 phonological fea-tures. The weighted similarity score forsis the hamming distance between the phonetic vector representations. dandiare held con-stant at 1.
3. pos: Levenshtein distance between pho-netic representations, weighted for position in word, d, i and s are set as q, where q is drawn from the exponential distribution at positioni, withλ= 0.5.
4. sem: The semantic distance between word vector representation. Semantic representa-tions of word vectors were obtained from the German fastText model (Grave et al., 2018; ?) and similarity is approximated as the co-sine distance between the vectors.
5. Troyer: Implementation of Troyer clinical criteria for phonemic clustering (Troyer et al., 1997). Values were calculated by (1) string matching the first or last 2 letters, (2) match-ing the first two sounds of phonetically tran-scribed words, (3) for rhyming, matching the last two sounds of phonetically transcribed words and (4) for homophones, matching phonetic transcriptions of the whole word. Each criteria was weighted as 1 and the sum of criteria present was used as a score. The max score was a 4 and the lowest 0. Words with equivalent scores where sorted alphabet-ically.
Phonetic transcriptions were obtained with Epi-tran, a python library that translates orthographic to phonetic representations (Mortensen et al., 2018).
For each letter category,c, in our data set a vo-cabulary of the set of all words produced, Vc, is
constructed. The vocabularyVchas lengthN. For
each of the described similarity metricsf, a table of size NxN is created where the similarity be-tween every word in vocabulary is calculated. The result is a square, symmetric similarity matrix,Sc,
for each metric.
3.1.2 Evaluation
Difference of scale for each of the metrics ren-ders direct comparison impossible, therefore per-formance of the metrics is evaluated via ranking tables.
For each similarity matrix of a letter category Sc, a list is generated for every word in the
vocab-ulary,Vc, of the most similar to the least similar as
determined by the metricf. To formalize this, a rank tableT is created for every wordwin each letter vocabularyVc.
Once all tables are populated, the rank cost of the PVF samplesRCf are calculated bycfor each
f. Given a productionP = w1...wn, a metric f
and ranking tables for each word Twf1...T
f wn the
rank cost ofP, givenf, is determined as
RCf(P) = n−1
P
j=1
Twfj[wj+1]
n−1
Using rank based comparison is motivated by a two arguments. First, ranking makes different similarity metrics comparable, by rendering issues of scale irrelevant while preserving the individual metrics outcome. Second, the resultingRCf can
be interpreted directly as the offset of the mean rank, when used for predicting the next word from our vocabulary. The similarity metricf which is better at modelling production will have a lower RCf.
3.2 Modelling Strategy
3.2.1 Metrics
After modelling production, it is crucial to con-sider that the clinicalTroyermetric is not a method of modelling production, but rather a clustering strategy to explore the underlying cognitive pro-cess of this clinical task. Taking this into account, the following methodology aims to compare each metric’s ability to model the underlying strategies of the PVF task.
Affinity Propagation Clustering (AP clustering) is a clustering algorithm based on each point in a data set—in this application, the similarity ma-trix Sc for each metric f—passing messages
si-multaneously through two matrices, representing either responsibility or availability. The end result is an emergence of data points—or words from Vc—that are considered exemplars, having high
A A A A B B B B D D D D F G G G H H H K K K K K L L L L M M M N N N N N P P PRR R R R S S S S T T T T V V V Z Z 50 75 100 125 150
160 200 240
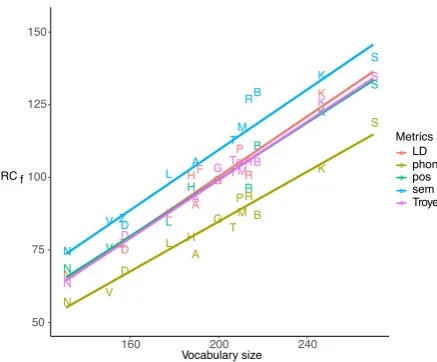
[image:4.595.75.294.61.242.2]Vocabulary size Metrics a a a a a LD phon pos sem Troyer RC f
Figure 1: MedianRCf for each letter and methodf as
a function of vocabulary size. Differentf are indicated by color. Lines indicate fit of a linear model.
or better suited by availability (Frey and Dueck, 2007). A unique point of AP clustering is that the number of clusters is not predefined, but emerges from the data. This concept lends itself naturally to the idea of clustering in PVF, as exemplars can be seen as the general topic that is being searched for during the production.
To apply this to the data, for every letter cate-goryc, the generated similarity matrixScfor each
metricfis used to create a set of clusters as deter-mined by AP clustering algorithm. The resulting clusters are then saved and applied to each produc-tion in the data set to consider the strategy esti-mated by each metric. Consecutive words in each participant production are compared to see if they belong in a cluster as determined by each similar-ity metric.
For example, if a participant was given the letter category C, they might produce the following:
cat, crab, crawl, crib, cash, cache
The clusters generated from a selection of the sim-ilarity metrics using the AP clustering algorithm to cluster the PVF performance would yield the fol-lowing, where words within a set of brackets indi-cate a computed cluster:
Troyer: [cat], [crab, crawl, crib], [cash, cache] sem: [cat, crab], [crawl, crib], [cash], [cache]
3.2.2 Evaluation
The quality of the AP clustering technique on this task is evaluated using the silhouette coeffi-cient. This measure is ideal as it does not require
a ground truth. This measure looks at the fit of a cluster by considering if every point is in its closest cluster, or if another cluster would be more suit-able. Each point in the dataset is considered. First, the average distance between the chosen point and all points in its own cluster (distancecohesion) is
calculated. Then, the average distance between the same point and all points in next nearest cluster is calculated (distanceseparation).
distanceseparation−distancecohesion
max(distanceseparation, distancecohesion)
The silhouette coefficient is bounded from -1 to 1, where positive values indicate higher quality clusters and negative values typically indicate that a point has been incorrectly clustered (Rousseeuw, 1987).
The ability of the metrics to model strategy is evaluated by looking at the average rank cost within clusters as well as the average rank cost between clusters, or switches. The rank cost ta-bles created previously are used to calculate this respectively.
The average rank cost of clusters is calculated by looking at the rank cost of transitions between words in each cluster and normalized by the num-ber of transitions in a cluster.
The average rank cost of switches in a produc-tion is calculated by summing the rank costs of transitions between cluster boundaries and nor-malizing by the number of switch transitions.
Metrics with a lower average rank cost within clusters and higher average rank cost of switching are seen to better model strategy.
4 Experiment 1: Modelling Production
For the first experiment, one minute PVF perfor-mances of 32 German students (9 male, 23 female; Age 22.88) from 16 different letter categories (i.e. A, B, D, F, G, H, K, L, M, N, P, R, S, T, V, Z) were collected. These were manually transcribed on a word level into sequences of correct responses. Words were converted into phoneme (IPA) repre-sentations using the pythonepitran1package. For each letter category c, a vocabulary Vc was
con-structed to calculate the RCf of each sample as
described in Section4.
Statistical analysis was performed using R (software version 3.4.0). Performance of metrics over all letters was examined with a linear mixed
A B D F G H K L
50 100 150
M N P R S T V Z
50 100 150 200
[image:5.595.72.521.62.411.2]Metrics LD phon pos sem Troyer
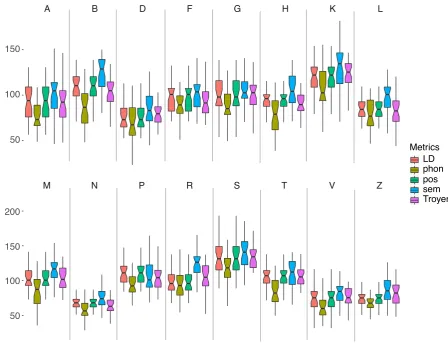
Figure 2: Comparison ofRCf values for distance metricsf and letter categories. Each boxplot represents one
letter category and contains results from the five distance metrics defined in Section3.1. In the case of black and white prints, metrics for each letter category match the legend from top to bottom as left to right.
effects analysis using thelme4(Bates et al.,2014) package. EachRCf was modelled as a single data
point and letter and metric were represented as fixed effects. The participant identifier was mod-elled as a random intercept.
5 Experiment 2: Modelling Strategy
The affinity propagation clustering algorithm was implemented in python from scikit-learn frame-work (Pedregosa et al., 2011). The same param-eters were used to determine all models. The pref-erence parameter serves as an indicator of how fit a word in the vocabulary is to be an exemplar, higher values indicate that it is more likely where as lower values indicate that it is less likely. This also in-fluences the number of clusters produced, where higher preference values lead to more clusters and lower preference values lead to fewer cluster. The preference parameter was set for each word in the vocabulary as the Zipf word frequency as
de-termined by the python wordfreq package (Speer et al.,2018). The zipf word frequency represents the frequency of the word in a large, in this case German, corpus on a ’human-friendly’ scale. The result is a value between 1.0 and 8.0, where the larger the value, the more frequent the word is in the language. The goal of using the word fre-quency during clustering is to give a high exem-plar weight to more frequent words to make the clusters relevant to the PVF production task. The remaining parameters were left at their default val-ues; the damping factor was set to 0.5 and conver-gence iteration rate at 200. Each previously com-puted similarity matrixScwas used as an input to
generate clusters for each metricf.
LD phon pos sem Troyer 0
50 100 150 200 250
300 Clusters
Switches
RC f
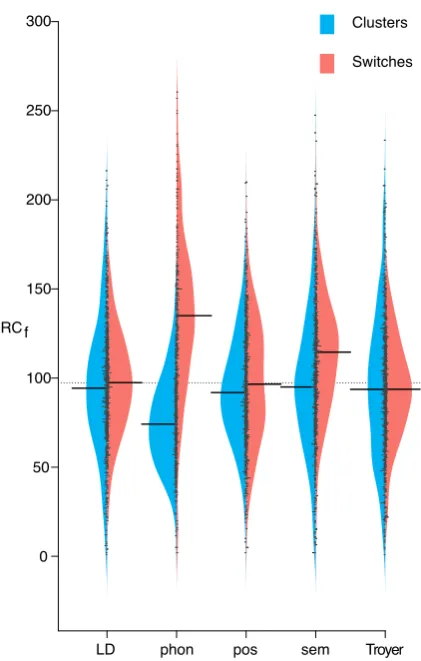
Figure 3: Beanplots comparing the distribution of av-erage rank cost of clustering and switching across all letter categories, by metric. The left distribution is for clustering and the right distribution is for switching. The long bar in the distribution represents the median.
6 Results
6.1 Experiment 1
Results are displayed in Figure2, where a better fit is indicated by lowerRCf. One boxplot is shown
for each letter category. The threshold for reject-ing a null hypothesis and determinreject-ing statistical significance is set at 0.05 for all tests performed.
The linear models were created as described in 3.1.2and revealed that RCf values were
signifi-cantly lower for thephonand significantly greater for thesemmetric. Performances varied across let-ter categories with the lowest overallRCf values
being observed for the letterNand the highest for S.
6.2 Experiment 2
Evaluation of cluster quality as produced by the AP clustering algorithm is monitored via their sil-houette coefficients as described in section 3.2.2
and are shown in Table1.
The highest quality clusters were produced by the phonmetric. The posmetric had the second highest quality on average. The remaining metrics all produced relatively close values for all letter categories with Troyer performing slightly better thanLDandsem. Overall, all metrics on average produced positive cluster values.
LD phon pos sem Troyer 0.025 0.738 0.330 0.083 0.170
Table 1: silhouette coefficients
Figure 3 uses beanplots to compare each met-ric by the distribution of average rank cost within a cluster and the average rank cost of switches. Phonhad a much lower average rank cost within clusters where as all other metrics were relatively equal, withTroyerhaving slightly lower than LD. Sem had the highest average cluster rank cost.
For each metric, a paired-samples t-test was conducted to compare average RCf, aggregated
across letter categories, between clustering and switching conditions. There were significant dif-ferences in average rank cost for clustering and switching forphon(t(222)=-20.17, p<0.05), sem (t(222)=3.69, p<0.05) and pos (t(222)=-2.372, p<0.05). No significant differences were found for the metrics LD or Troyer.
7 Discussion
For modelling the entire production,phon outper-formed the troyer andLD metrics in every letter category, showing an improvement from our base-line measurements. Overall, the metric that best modeled the data based on the ranked cost evalu-ation wasphon. The semantic similarity measure sem had the highest average rank cost across all letter categories, leading us to believe that the task as a whole is not semantically motivated.
For modelling strategy based on clustering and switching, the phonetically weight edit distance phon continued to have the highest quality clus-ters as indicated by a low rank cost across all let-ter categories. This metric also best modelled the switching procedure between clusters as indicated by a high rank cost. In addition,
[image:6.595.77.288.64.395.2]could be due to the lower quality of clusters pro-duced by the sem metric, as determined by the silhouette coefficient, however the overall score is within a reasonable range. Another consideration is that the phonemic task has little semantic un-derlying notions for producing clusters and phone-mically derived measures are more suited to the task. There is also a possibility that within phone-mic verbal fluency there are phonephone-mic and seman-tic strategies that motivate clustering and switch-ing. For example, a cluster of the words ”grand-mother”, ”grandfather”, and ”grandstand” would be both semantically and phonemically motivated.
8 Conclusion
This paper compared different similarity metrics for their ability to model production in PVF for multiple letter categories. The proposed phon approaches significantly outperformed the simple LD baseline and automated troyer methods for both modelling production and strategy. Surpris-ingly, thesemmetric performed poorly in compar-ison to all other metrics when modelling the entire production sequence, but was able to capture the notion of underlying strategies of clustering and switching.
Further development of the newly proposed metrics should be continued by tuning parameters for AP clustering per evaluated metric to achieve higher quality clusters rather than the uniform con-figurations demonstrated in this paper. Further investigations could also combine semantic and phonemic methods by classifying clusters as be-ing either semantically motivated or phonemically motivated. The next step in this line of research would be to apply these new PVF techniques in a clinical application and evaluate the effectiveness of these features to distinguish between different pathological groups. Similar evaluations should be conducted for other languages, since results may vary due to phonemic differences.
References
Douglas Bates, Martin M¨achler, Ben Bolker, and Steve Walker. 2014. Fitting linear mixed-effects models using lme4.arXiv preprint arXiv:1406.5823.
D. G. Clark, P. M. McLaughlin, E. Woo, K. Hwang, S. Hurtz, L. Ramirez, J. Eastman, R. M. Dukes, P. Kapur, T. P. DeRamus, and L. G. Apostolova. 2016. Novel verbal fluency scores and structural brain imaging for prediction of cognitive outcome
in mild cognitive impairment. Alzheimers Dement
(Amst), 2:113–122.
Lionel Fontan, Isabelle Ferran´e, J´erˆome Farinas, Julien Pinquier, and Xavier Aumont. 2016. Using phono-logically weighted levenshtein distances for the pre-diction of microscopic intelligibility.
Brendan J. Frey and Delbert Dueck. 2007. Clustering by passing messages between data points. Science, 315(5814):972–976.
Edouard Grave, Piotr Bojanowski, Prakhar Gupta, Ar-mand Joulin, and Tomas Mikolov. 2018. Learning word vectors for 157 languages. In Proceedings of the International Conference on Language
Re-sources and Evaluation (LREC 2018).
Paul J Gruenewald and Gregory R Lockhead. 1980. The Free Recall of Category Examples. Journal of Experimental Psychology: Human Learning and
Memory, 6:225–240.
Wilbert Heeringa. 2005. Measuring dialect pro-nunciation differences using levenshtein distance.
Zeitschrift fr Dialektologie und Linguistik, pages
205–208.
Vladimir I Levenshtein. 1966. Binary codes capable of correcting deletions, insertions, and reversals.
Nicklas Linz, Johannes Tr¨oger, Jan Alexandersson, and Alexandra K¨onig. 2017. Using Neural Word Em-beddings in the Analysis of the Clinical Semantic Verbal Fluency Task. In Proceedings of the 12th International Conference on Computational
Seman-tics (IWCS).
David R. Mortensen, Siddharth Dalmia, and Patrick Littell. 2018. Epitran: Precision G2P for many lan-guages. In Proceedings of the Eleventh Interna-tional Conference on Language Resources and
Eval-uation (LREC 2018), Paris, France. European
Lan-guage Resources Association (ELRA).
David R. Mortensen, Patrick Littell, Akash Bharad-waj, Kartik Goyal, Chris Dyer, and Lori S. Levin. 2016. Panphon: A resource for mapping IPA seg-ments to articulatory feature vectors. InProceedings of COLING 2016, the 26th International Confer-ence on Computational Linguistics: Technical Pa-pers, pages 3475–3484. ACL.
F. Pedregosa, G. Varoquaux, A. Gramfort, V. Michel, B. Thirion, O. Grisel, M. Blondel, P. Pretten-hofer, R. Weiss, V. Dubourg, J. Vanderplas, A. Pas-sos, D. Cournapeau, M. Brucher, M. Perrot, and E. Duchesnay. 2011. Scikit-learn: Machine Learn-ing in Python. Journal of Machine Learning
Re-search, 12:2825–2830.
James O Ryan, Serguei VS Pakhomov, Susan E Marino, Charles Bernick, and Sarah Banks. 2013. Computerized analysis of a verbal fluency test. In
Proceedings of ACL, pages 884–889.
Robyn Speer, Joshua Chin, Andrew Lin, Sara Jew-ett, and Lance Nathan. 2018. Luminosoin-sight/wordfreq: v2.2.
Johannes Troeger, Nicklas Linz, Alexandra Knig, Philippe Robert, Jan Alexandersson, Jessica Pe-ter, and Jutta Kray. 2019. Exploitation vs. explo-rationcomputational temporal and semantic analy-sis explains semantic verbal fluency impairment in alzheimer’s disease.Neuropsychologia.
Angela K Troyer, Morris Moscovitch, and Gordon Winocur. 1997. Clustering and Switching as Two Components of Verbal Fluency: Evidence From Younger and Older Healthy Adults. Neuropsychol-ogy, 11(1):138–146.
Isabelle Vonberg, Felicitas Ehlen, Ortwin Fromm, and Fabian Klostermann. 2014. The absoluteness of semantic processing: Lessons from the analysis of temporal clusters in phonemic verbal fluency. 9:e115846.
David L. Woods, John M. Wyma, Timothy J. Herron, and E. William Yund. 2016. Computerized Analy-sis of Verbal Fluency: Normative Data and the Ef-fects of Repeated Testing, Simulated Malingering, and Traumatic Brain Injury. PLOS ONE, 11(12):1– 37.