TRANSPLANT SIZE AFFECTS EARLY GROWTH OF A
PINUS
TAEDA
CLONE
David B. South
1, Al Lyons
2, Russ Pohl
31
School of Forestry and Wildlife Sciences and Alabama Agricultural Experiment Station, Auburn University, AL, USA
2
Hancock Forest Management, Harpersville, AL, USA
3Georgia Forestry Commission, Macon, GA, USA
Abstract.Block-plot experiments in Alabama and Georgia were examined to determine the effects of transplant size on early height growth of a tissue-cultured, Pinus taeda L clone. Ramets of clone L-3576 (miniplugs) were transplanted into a bareroot nursery at three spacings. After lifting, the transplants were sorted into three classes according to the diameter at the soil-line; 3-4.9 mm, 5-6.9 mm, 8-9.9 mm. Survival after 5 years in the field was greater than 97% at both the cutover site in Alabama and the grassland site in Georgia. At both sites, transplants with the largest diameter exhibited the greatest height and diameter growth. At year five, the difference in height between the smallest and largest class was approximately 0.5 m. This is roughly equal to a time-gain of 4 to 5 months. Stand uniformity can be improved slightly when planting large stock (when the stock range in initial diameter is 2 mm). Results from these trials suggest that early growth performance of one clone can be affected by the size of transplants at time of planting.
Keywords: stock quality, nursery, survival, clone, plantation, methyl bromide, chloropicrin, oxyfluorfen, permethrin, esfenvalerate, triadimefon, atrazine, metsulfuron methyl, sulfometuron, sethoxydim
1
Introduction
For decades, forest researchers have known that early gains in survival and growth of 1+0 bareroot pine seedlings can be achieved by planting large-diameter stock [1,2,3,4]. In fact, growth models have been developed which al-low the user to vary the size of planting stock at time of planting. Models have been developed forPinus ra-diata [5], Pinus banksiana [6] and Pinus taeda [7]. In some cases, these models indicate that that early growth gains from planting larger diameter stock may, equal (or exceed) that achieved by applying herbicides to small-diameter seedlings [8]. What is not known is if these models are also useful when the planting stock does not originate from seed and has no genetic variation (i.e. a single genotype).
Advances in somatic embryogenesis and nursery tech-nology [9] have provided landowners in the southern United States the option of establishing clonal planta-tions of Pinus taeda. Although there are a few studies that compare the performance of seedlings with clonal
stock [10,11], we are not aware of any reports that de-termine the effect of plant size on early growth of tissue-cultured Pinus taeda stock. When a 15 cm difference in early height is noted between seedlings and clones, few ask the question if this difference could be due to a small difference in size at planting. Typically, in most perfor-mance trials, initial height and diameter measurements are not recorded at time of planting. This can lead to confounding of initial seedling quality with treatments which sometimes leads to inappropriate conclusions [12]. In addition, it is not known if stock size has an effect on stand homogeneity. To address these deficiencies, trials were established to see if stock size (Table 1) could affect early growth and homogeneity of a tissue-cultured clone ofPinus taeda.
2
Materials and Methods
In March of 2004, nursery soil was fumigated with a combination of methyl bromide (439 kg/ha) and chloropi-crin (9 kg/ha). Mini-plugs produced using somatic
em-Copyright©2015 Publisher of theMathematical and Computational Forestry & Natural-Resource Sciences
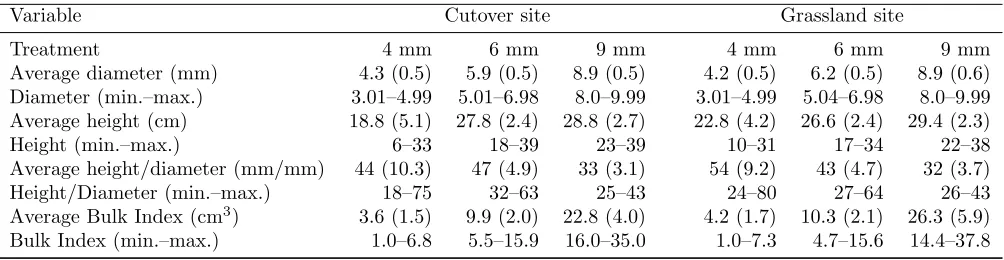
Table 1: A comparison of three initial stock size classes by site forPinus taeda clone L-3576. All of the transplants measured were outplanted. Values of standard errors are given in parentheses (n>255).
Variable Cutover site Grassland site
Treatment 4 mm 6 mm 9 mm 4 mm 6 mm 9 mm
Average diameter (mm) 4.3 (0.5) 5.9 (0.5) 8.9 (0.5) 4.2 (0.5) 6.2 (0.5) 8.9 (0.6)
Diameter (min.–max.) 3.01–4.99 5.01–6.98 8.0–9.99 3.01–4.99 5.04–6.98 8.0–9.99
Average height (cm) 18.8 (5.1) 27.8 (2.4) 28.8 (2.7) 22.8 (4.2) 26.6 (2.4) 29.4 (2.3)
Height (min.–max.) 6–33 18–39 23–39 10–31 17–34 22–38
Average height/diameter (mm/mm) 44 (10.3) 47 (4.9) 33 (3.1) 54 (9.2) 43 (4.7) 32 (3.7)
Height/Diameter (min.–max.) 18–75 32–63 25–43 24–80 27–64 26–43
Average Bulk Index (cm3) 3.6 (1.5) 9.9 (2.0) 22.8 (4.0) 4.2 (1.7) 10.3 (2.1) 26.3 (5.9)
Bulk Index (min.–max.) 1.0–6.8 5.5–15.9 16.0–35.0 1.0–7.3 4.7–15.6 14.4–37.8
bryogenesis tissue culture technology (Sutton et al. 2004). Mini-plug ramets of line L-3576 were manufactured in Canada by CellFor Inc. at Vancouver, BC and were shipped to Hazlehurst, Mississippi. On May 28, the mini-plugs were transplanted by hand into one bed at the PlumCreek Timberland Co. Nursery. All ramets were transplanted into 8 rows spaced 15 cm apart. Approxi-mately one-third of the transplants were spaced 10.2 cm apart within the row. Another plot was established at within-row spacing of 3.4 cm and a third plot was spaced at 2.0 cm apart.
Herbicide applications began on June 9 when oxyflu-orfen (170 g a.i./ha) was applied as a broadcast applica-tion. Similar amounts of oxyfluorfen were also applied on June, 28, July 15, July 22, August 2 and August 24. Insecticide applications began on June 17 and ended on September 17. Permethrin and esfenvalerate were ap-plied periodically to control Lygus linenarious (Palisot de Beauvois). Two applications of triadimefon (350 g a.i./ha) were applied to control Cronartium quorum f. sp. fusiforme (Hedg. & Hunt ex Cumm.) and other fungicides were applied to lower the probability of de-tecting foliar diseases. Fertilization with nitrogen was conduced beginning in June and ending in September (total of 157 kg/ha applied to the crop). The amount of potassium, sulfur and calcium applied totaled 156 and 61, and 18 kg/ha, respectively.
In late summer, transplants were top-pruned in order to increase uniformity and to lower the height/diameter ratio. On January 11, 2005, the plug+1 transplants were lifted using shovels and were transported to Auburn Uni-versity (where they were placed in a cooler at 3oC). Sub-samples were dried in a forced-air oven for 72 hours at 70˚ C and dry weights of roots, stems and foliage were recorded. Prior to outplanting, diameters (at the nurs-ery soil-line) were measured using digital calipers. The transplants were sorted into three size classes according to the diameter at groundline (i.e. position on stem be-tween first root and first branch where the soil caused
a color change). The 9 mm class contained transplants that ranged in initial diameter (DIA) from 8 to 9.99 mm while the 6 mm class ranged from 5 to 6.99 mm (Table 1). The 4 mm class ranged in diameter from 3 to 4.99 mm and plants with a diameter less than 3.0 mm were dis-carded. Each trial contained 12 experimental units (i.e. 4 blocks X 3 treatments) arranged in a randomized com-plete block design. All plots were planted at a stocking of 1075 plants per ha. The plug+1 transplants in blocks 2 and 4 were planted in a square pattern with 305 cm between trees. For these blocks, there were 100 trees per plot (i.e. 10 rows with 10 trees per row). Blocks 1 and 3 were planted in a rectangular pattern with rows 427 cm apart and trees 217 cm apart and each plot contained 105 trees (i.e.7 rows with 15 trees per row).
Heights after planting were measured from the soil line to the shoot tip. In March (cutover site) and May (grassland site), each plant was evaluated for foliar in-jury. Transplants free of injury symptoms were ranked as: 0 = less than 5% brown needles; 1 = 5% or more brown needles. Diameter at breast height (DBH) was recorded for years 2008 to 2010.
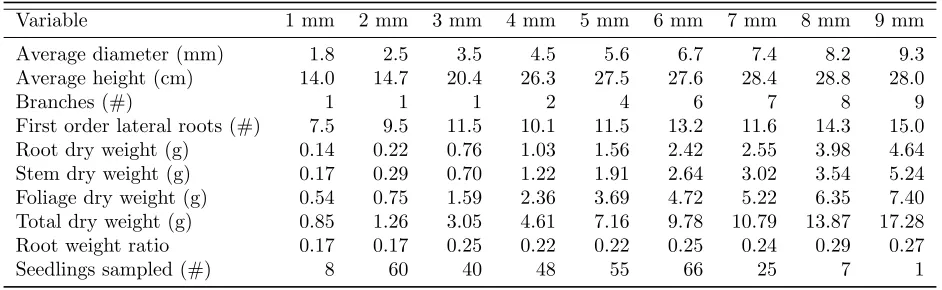
Table 2: Morphology of transplants selected for destructive sampling for Pinus taeda clone L-3576. None of these transplants were outplanted.
Variable 1 mm 2 mm 3 mm 4 mm 5 mm 6 mm 7 mm 8 mm 9 mm
Average diameter (mm) 1.8 2.5 3.5 4.5 5.6 6.7 7.4 8.2 9.3
Average height (cm) 14.0 14.7 20.4 26.3 27.5 27.6 28.4 28.8 28.0
Branches (#) 1 1 1 2 4 6 7 8 9
First order lateral roots (#) 7.5 9.5 11.5 10.1 11.5 13.2 11.6 14.3 15.0
Root dry weight (g) 0.14 0.22 0.76 1.03 1.56 2.42 2.55 3.98 4.64
Stem dry weight (g) 0.17 0.29 0.70 1.22 1.91 2.64 3.02 3.54 5.24
Foliage dry weight (g) 0.54 0.75 1.59 2.36 3.69 4.72 5.22 6.35 7.40
Total dry weight (g) 0.85 1.26 3.05 4.61 7.16 9.78 10.79 13.87 17.28
Root weight ratio 0.17 0.17 0.25 0.22 0.22 0.25 0.24 0.29 0.27
Seedlings sampled (#) 8 60 40 48 55 66 25 7 1
metsulfuron methyl (28 g a.i./ha) and sulfometuron (24 g ai.ha).
2.2 Grassland site This site was located at the Ar-rowhead seed orchard in Bleckley County, Georgia (GPS: N 32.373433 W 83.483817). Topography at this site is generally flat and the area had been disked twice prior to planting. On January 21, fresh weights were mea-sured on 100 transplants per diameter class per replica-tion. Weights were recorded for replication one before proceeding to the next replication. The average fresh weights were 15, 24, and 69 g, for the small, medium and large transplants. Transplants were hand-planted using long-handle TT 2-0 shovels on January 27, 2005. Heights were measured on January 26, 2006. A broadcast treat-ment of herbicide was applied on April 19, 2005. The treatment contained sulfometuron (105 g a.i./ha) and sethoxydim (175 g a.i./ha). Grasses between rows were mowed 3 times during the summer months.
2.3 Data Analysis Each trial utilized a randomized complete block plot design with four replicates and the trials were analyzed separately. Due to the young stand age, the analysis included only replicate and grade ef-fects. For each tree, an inside-bark volume index was determined using a formula found suitable for Pinus taeda [13]. Plot means were generated and these val-ues were analyzed using PROC GLM of the Statisti-cal Analysis System software package [14]. Orthogonal contrasts were employed to detect linear and quadratic relationships. Stock class was treated as fixed, while replicates were treated as random effects. Differences among treatments were declared significant at the alpha = 0.1 level. A transplant stress index (TSI) was deter-mined for each trial in the manner described previously [15]. TSI is equal to the slope of the linear relationship between shoot height at the beginning of the growth pe-riod and height increment. First-year height growth was
generated for each surviving tree and these values were regressed against initial height to obtain a TSI value for each plot. Each regression included more than 90 trans-plants. A negative TSI indicates transplants have under-gone transplant shock and the more negative the value, the greater the intensity of transplant stress. Stand uni-formity was examined by calculating a coefficient of vari-ation (standard devivari-ation/mean) for height and DBH.
RCDlob is a growth and yield model that was devel-oped using seedling data for Pinus taeda [7]. It allows the user to estimate the growth of seedlings that vary in initial size (i.e. root-collar diameter). We wanted to know if this model could also approximate the growth gains observed for planting larger ramets in a mono-clonal plantation. Therefore, we conducted a simulation using a planting density of 1075 plants per ha and a stan-dard site preparation scenario. We then compared the observed 5th year values with the RCDlob projections from planting 4 mm, and 9 mm stock.
3
Results and Discussion
The size of transplants was similar at both planting locations. Although the 9-mm transplants had a greater bulk index (i.e. diameter X diameter X height) and were slightly taller than the 6-mm class, they had lower height/diameter ratios (Table 1). Destructive sampling indicated that the 8-mm class was heavier and tended to have a higher root weight ratio (i.e. root dry weight/total plant dry weight) than transplants with smaller diame-ters (Table 2).
Table 3: Probability of a greaterF-statistic for survival (year 5), foliar damage (Damage), diameter at breast height at year 5 (DBH), and volume per ha at year 5 (Volume) of aPinus taeda clone as affected by stock size at planting. Numbers in brackets represent L.S.D. values (α=0.05).
Site d.f. Survival Damage DBH Volume
Cutover Replication 3 0.3495 0.3267 0.5108 0.4393
Size 2 0.3199 0.0467 0.1542 0.1356
Linear -1 0.5708 0.1527 0.0734 0.0656
Quadratic -1 0.1713 0.0301 0.5090 0.4601
Error 6 [2.4] [26] [10.9] [7.0]
Grassland Replication 3 0.3910 0.4697 0.0575 0.2112
Size 2 0.5057 0.0002 0.0069 0.0148
Linear -1 0.2818 0.0356 0.0024 0.0055
Quadratic -1 0.7278 0.0001 0.6904 0.4866
Error 6 [3.0] [10] [5.3] [3.7]
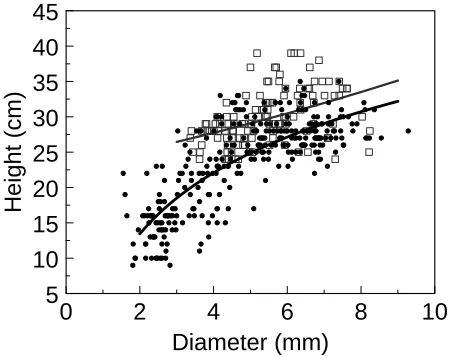
made with the use of shovels or augers). The top of the foam miniplug was typically planted about 7 cm be-low the soil surface. In addition, when compared to seedlings (archived data from a different nursery and different year), it appears the transplants might have larger diameters for a given height (Figure 1). It is pos-sible diameter gain is due to the head-start transplants receive from additional time spent in greenhouse cul-ture. Although a similar pattern in heights and diame-ters have been observed forPinus radiata cuttings [16], more research would be needed to determine if a trend
0
2
4
6
8
10
5
10
15
20
25
30
35
40
45
Diameter (mm)
Height (cm)
Figure 1: A comparison of nursery height and nursery di-ameter for barerootPinus taedaseedlings from a nursery in Alabama (top line; open squares) and for transplants of clone L-3576 from a nursery in Mississippi (bottom line; solid dots).
of lower height/diameter ratios is repeatable for clonal transplants from otherPinus taeda nurseries.
3.2 Foliar injury Pinus taedamay turn a “nitrogen-deficient” color after exposure to freezing weather [17]. Brown foliage can be a sign of freeze injury and foliar in-jury was observed at the cutover site in early February. A few days after planting, freezing temperatures (as low as -8oC) occurred on the 24th, 25thand 26thof January. Foliage assessed in March indicated that brown needles occurred on a third of the trees. Foliar injury was also noted on about a third of the small stock at the grass-land site. At that location, freezing temperatures (e.g. -1oC) occurred just a few days after planting (i.e. Jan-uary 28, 29th, and 30th). At both sites, foliar symptoms were greater on stock with a DIA that was smaller than 5 mm (Table 4). At both locations, the injury had a quadratic relationship with size (Table 5). This obser-vation is supported by others who reported that freeze injury is negatively related to RCD [18]. The injury was ephemeral and trees at both sites recovered quickly.
Table 4: Effect of initial stock size on survival, height, diameter at breast height (DBH), foliar damage, and Transplant Stress Index (TSI) of Pinus taeda clone L-3576 in Alabama (Cutover) and Georgia (Grassland). Except for the 9 mm class for year 5 height, all means are for four replications.
Site Class Variable After planting Year 1 Year 2 Year 3 Year 4 Year 5
Cutover 4 mm Height (cm) 20 48 125 220 351 513
6 mm Height (cm) 21 56 141 243 377 550
9 mm Height (cm) 22 61 152 255 395 559
4 mm DBH (mm) 17 44 72
6 mm DBH (mm) 20 50 79
9 mm DBH (mm) 22 53 82
4 mm Volume (m3/ha) 16
6 mm Volume (m3/ha) 21
9 mm Volume (m3/ha) 23
4 mm Damage (%) 52
6 mm Damage (%) 31
9 mm Damage (%) 18
4 mm TSI -1.29 -0.11 -0.1 -0.12 0.03
6 mm TSI -0.86 -0.17 -0.31 0.08 0.04
9 mm TSI -0.95 0.11 -0.39 0.06 0.06
Grassland 4 mm Height (cm) 16 68 164 295 422 529
6 mm Height (cm) 20 77 177 310 459 593
9 mm Height (cm) 22 96 209 350 476 646
4 mm DBH (mm) 35 65 106
6 mm DBH (mm) 37 67 109
9 mm DBH (mm) 46 75 116
4 mm Volume (m3/ha) 19
6 mm Volume (m3/ha) 22
9 mm Volume (m3/ha) 25
4 mm Damage (%) 38
6 mm Damage (%) 7
9 mm Damage (%) 1
4 mm TSI -0.15 0.57 0.28 0.06 1.34
6 mm TSI -0.42 0.45 0.27 0.13 0.65
9 mm TSI -0.32 0.07 0.01 -0.23 0.46
Regardless of year, we did not detect a significant treatment effect on TSI values at the cutover site. How-ever, stock size at the grassland site apparently affected TSI values during the second, third and fourth years (Ta-ble 5). The significant linear effect suggests the bulker and heavier transplants exhibited lower TSI values when compared to the smaller transplants.
3.4 Height and diameter A derecho event occurred at the Alabama site on May 3, 2009. A derecho is a widespread and long-lived straight line wind storm asso-ciated with a fast moving squall line. Central Alabama experienced widespread winds of 80 to 100 kph and some locations received maximum winds of 110 to 130 kph. A few thousand trees may have been blown down across Central Alabama. At the Alabama trial, perhaps 5% of the trees had broken tops (i.e. height growth less than
30 cm for the year). Breakage was related to block lo-cation. There was less than 1% breakage in block #3 but in block #2, the 9 mm plot had 28% breakage. For this reason, this plot was dropped in the analysis for 5th year heights. More height growth occurred at the grass-land site (average height was 584 cm) in Georgia when compared to the cutover site in Alabama (average height was 539 cm). The soil at the Georgia location had fewer rocks, more topsoil, and less hardwood competition.
Table 5: Probability of a greaterF-statistic for transplant stress index (TSI) ofP. taeda clone L-3576 as affected by stock size at planting. Numbers in brackets represent L.S.D. values (α=0.05).
Prob>F
Cutover Grassland
D.f. Year 1 Year 2 Year 3 Year 4 Year 5 Year 1 Year 2 Year 3 Year 4 Year 5
Replication 3 0.6984 0.7533 0.0224 0.6292 0.6285 0.9937 0.4782 0.3357 0.3971 0.5602
Size 2 0.2488 0.7313 0.6046 0.7310 0.9503 0.4899 0.0466 0.0545 0.0178 0.2784
Linear (1) 0.1762 0.6142 0.3387 0.5027 0.7918 0.3293 0.0239 0.0409 0.0314 0.1311
Quadratic (1) 0.3171 0.5616 0.9050 0.7096 0.8759 0.5126 0.2451 0.1296 0.0231 0.7273
Error 6 [0.6] [1.0] [0.7] [0.7] [0.2] [1.1] [0.4] [0.2] [0.2] [1.3]
Table 6: Probability of a greater F-statistic for height of a Pinus taeda clone L-3576 as affected by stock size at planting. Numbers in brackets represent L.S.D. values (α= 0.05).
D.f. Prob>F
After planting Year 1 Year 2 Year 3 Year 4 Year 5
Cutover Replication 3 0.3725 0.5427 0.9015 0.8556 0.6238 0.2040
Size 2 0.6905 0.0063 0.0700 0.1215 0.1236 0.4583
Linear (1) 0.4145 0.0024 0.0287 0.0559 0.0529 0.3059
Quadratic (1) 0.8917 0.3017 0.5701 0.4983 0.6308 0.5709
Error 5-6 [6] [6] [23] [36] [44] [92]
Grassland Replication 3 0.3265 0.1008 0.5440 0.2151 0.0222 0.3213
Size 2 0.0007 0.0001 0.0052 0.0075 0.0104 0.0273
Linear (1) 0.0068 0.0001 0.0017 0.0026 0.0021 0.0118
Quadratic (1) 0.0005 0.9136 0.8911 0.7457 08586 0.3189
Error 6 [1.1] [5] [21] [27] [21] [73]
difference between the smallest and largest class was 46 cm on the cutover site and 117 cm on the grassland site. The less than expected height growth at the cutover site might be a result of wind damage experienced in May. Due to an increase in plot variability, the treatment ef-fect was no longer significant at the cutover site.
At year five, the difference in fifth-year diameter be-tween the smallest and largest class was similar for both sites (1 to 1.1 cm). This difference was significant at both sites (Table 3). Since survival was high at both sites, the difference in stand volume was driven by the difference in DBH. Planting stock that averaged 5 mm larger in diameter resulted in greater than 30% volume gain at both sites (Table 3). Of course, as the stand ages, the absolute gain might increase as the percentage gain declines [20, 21].
3.5 Time Gain In addition to absolute gains, an esti-mate of the time-gain [22] was made using annual height measurements. By plotting height over time and using linear equations, a “hypothetical” number of days re-quired to reach a height of 5 m was calculated (assuming growth rate is constant throughout the year). When 6
mm stock was planted on the cutover site, a height of 5 m was reached 3 months sooner than for the smaller stock (i.e. 4 mm diameters). Likewise, on the grassland site the time gain for this comparison was estimated at 4 months. Assuming a plantation is harvested when the current annual increment (CAI) is 16 m3/ha, then three
months of additional growth would translate into a gain in volume of 4 m3/ha.
stud-ies that plant size can affect subsequent growth. In fact, some growth equations are based on the idea that growth is a function of tree size [24]. The realized gain from planting larger stock (i.e. 6 mm stock vs. 4 mm stock) might be similar to realized gains from planting certain clones (Figure 2).
4 mm 6 mm 9 mm C36 C40 C32 C93
0 200 400 600 800
Height - cm
Bleckley County Marion County
Figure 2: A comparison of height gains (age 5 years) from planting larger Pinus taeda transplants (Black-ley County, Georgia; clone L-3576 ) with planting four clones of Pinus taeda (Marion County, Georgia). The absolute gain from planting transplants that were 2 mm larger in diameter (ie. 6 mm vs. 4 mm) was approx-imately the same as that achieved from planting clone C40 vs. clone C36 [11].
3.7 Culling standards At some nurseries, an attempt is made to cull stock prior to shipping trees to outplant-ing sites. Nursery managers give packers morphological specifications to use to identify culls. Due to time con-straints, only a few morphological standards are used during the culling process. Typically, seedlings that are too small to plant easily are culled as well as those with obvious signs of disease. In some cases, large stock is considered to be culls because tree planters might not plant them properly [23].
For clonally propagated stock, morphological culling standards are either based on intuition or data from out-planting studies [16, 23, 25]. When field performance trials are lacking, many nursery managers use intuition to set culling limits. For example, stock with diame-ters greater than 10 mm might be culled even though they survive and grow better than stock with 4 to 6 mm diameters [23]. On the other end of the spectrum, we did not test transplants with diameters less than 3 mm because they have smaller roots and lower root-weight ratios (Table 2). We assumed they would have lower survival potential. However, in other trials, some
nurs-eries have shipped ramets with diameters as small as 1 mm. In situations where both the demand and price for clonal stock is high, there may be an incentive to lower culling standards and ship ramets with diameters in the 1 and 2 mm range (Table 2).
3.8 RCDlob The 5th-year RCDlob simulations pro-duced average heights of 518 and 579 cm for the 4 mm and 9 mm plants, respectively. The RCDlob simulation for height gain (i.e. 61 cm) was in between the realized values for the cutover site (46 cm) and grassland site (117 cm). The RCDlob estimate for average quadratic DBH at year six was 72 mm for the 4-mm stock and 75 mm for 9-mm stock. For the cutover site, the respective 5-year DBH values were 73 mm and 83 mm which are close to the simulated values. The results suggest the site index for the cutover site might be similar to the RCDlob site index (i.e. simulated height of tallest 20 trees at age 25 years = 26 m). In contrast, the RCD-lob simulations underestimated realized height and DBH gains at the grassland site.
3.9 Stand uniformity In this trial, stand uniformity was affected by the environment and by transplant size. The environment was more uniform at the cutover site than for the grassland site (Figure 3 and 4). Greater uniformity at the grassland site meant that differences among means were easier to detect (statistically). The CV values reported for the sites above are more uniform than those reported for three clones planted in North Carolina [26].
0 1 2 3 4 5 6 7
0 0.1 0.2 0.3
0 0.1 0.2 0.3 0.4
Average height (m)
CV height - cutover site CV height - grassland site
4 mm 6 mm 9 mm
cutover
grassland 4
6
9
4
6 9
2 3 4 5 6 7 0
0.1 0.2 0.3 0.4 0.5
0 0.1 0.2 0.3 0.4 0.5 0.6
Average height (m)
CV diameter - cutover site
CV diameter
grassland site
4 mm 6 mm 9 mm
cutover
grassland 4
6
9 4
6
9
Figure 4: Uniformity in stand diameter at breast height is affected by size of planting stock (ie. 4 mm, 6 mm, 9 mm) and by height of stand at time of measurement. Each point represents the coefficient of variation (CV) of more than 332 ramets ofPinus taeda L-3576.
The CV in height (Figure 3) and CV in diameter (Figure 4) generally decreased as average height of the stand increased. An exception was noted at the cutover site where the CV for height increased during the fifth growing season. It is likely this increase was related to stem breakage as a result of the derecho event. Other researchers have reported a reduction in CV (for both height and diameter) as the stand increases in size [25, 27, 28].
An unexpected finding was that transplant size at planting had an effect on stand uniformity. At both sites, the larger transplants exhibited more uniformity than the smaller, 4-mm class (Figures 3 and 4). The gain in uniformity from planting 9-mm transplants in a mono-clonal plantation was considerable, especially when compared to reported gains in uniformity from planting a single clone instead of a mixture of clones. For height, Sharma et al. [27] reported a CV (DBH at age 12 yr) of 0.142 of a clonal mixture (i.e. 10 clones) compared with a CV of 0.126 for a mono-clonal planta-tion. This difference (0.016) is less than the 0.055 and 0.077 differences observed between the 4-mm class and 9-mm classes (age 5 years) at the cutover site and grass-land sites, respectively. This suggests that transplant size at planting can affect stand homogeneity.
Economically, variability in DBH is minimally im-portant when stands are harvested for biomass or for pulpwood. In these cases, additional volume growth is the primary justification for establishing mono-clonal plantations. In contrast, homogeneity can affect net present value (NPV) when landowners harvest
sawtim-ber. In such cases, uniformity can affect stand value (when stands contain the same amount of volume at har-vest). In situations where greater uniformity decreases the amount of pulpwood and increases the amount of sawtimber, then the NPV will be increased. In con-trast, increased uniformity might lower NPV in situa-tions where the proportion of sawtimber is decreased due to a proportional increase in pulpwood [29, 30, 31, 32]. Therefore, greater uniformity does not always result in more profit. Not only is it important to select the correct clone, but it may be wise to select a nursery that pro-duces homogeneous ramets. Establishing a mono-clonal plantation with heterogeneous ramets might result in a non-uniform stand [26].
4
Conclusions
Plant size is important for good field growth of ram-ets propagated with either rooted cuttings [23] or tissue culture. From the trials reported here, transplants with diameters of 8 to 9.99 mm and heights of 22 to 39 cm performed better than stock with diameters less than 5 mm. An increase in initial diameter of 5 mm (i.e. 4.3 vs 9.3 mm) increased 5th year height by 46 cm to 117 cm. An increase in diameter of just 2 mm might increase average height by 20 cm to 60 cm. On some productive sites, planting uniformly large transplants could improve homogeneity and could increase yields by 3 to 4 m3/ha
(at age 5 years). This might result in a gain in stand development of 4 to 5 months.
Acknowledgements
These trials were financially supported by the South-ern Forest Nursery Management Cooperative. We thank CellFor Corporation for donating the nursery stock, Ken McQuage for producing the stock and Dr. Steve Gross-nickle and Dr. Curtis VanderSchaaf for reviewing earlier drafts. Thanks also go to Tommy Hill for recording the annual measurements. The authors would also like to thank the anonymous reviewers for their comment that improved the content of this paper.
References
[1] Wakeley, P.C. 1949. Physiological grades of southern pine nursery stock. In: Proceedings of the 49thAnnual Meeting of the Society of American Foresters; 1949: Bethesda, Maryland: Society of American Foresters. 311-322 p.
[3] Mason, E.G., D.B. South, and Z. Weizhong. 1996. Performance of Pinus radiata in relation to seedling grade, weed control, and soil cultivation in the central North Island of New Zealand. New Zealand Journal of Forest Science. 26(1/2):173-183.
[4] South, D.B. 1993. Rationale for growing southern pine seedlings at low seedbed densities. New Forests. 7(1):63-92.
[5] Mason, E.G. 2001. A model of the juvenile growth and survival of Pinus radiata D.Don; adding the ef-fects of initial seedling diameter and plant handling. New Forests. 22(1/2):133-158.
[6] Payandeh, B. 1996. Growth and survival functions for three planted species in Northern Ontario. Northern Journal of Applied Forestry. 13(1):19-23.
[7] VanderSchaaf, C.L., and D.B. South. 2008. RCD-lob: A growth and yield model for loblolly pine that incorporates root-collar diameter at time-of-planting. Americas Journal of Plant Science and Biotechnology. 2(1):5-11.
[8] South, D.B. 2001. Three plantation establishment models for pine. New Zealand Journal of Forestry. 45(4):10-13.
[9] Grossnickle, S.C., and J. Pait. 2008. Somatic embryo-genesis tissue culture for applying varietal forestry to conifer species. In: Dumroese, R.K., Riley, L.E., Eds. National Proceedings: Forest and Conservation Nursery Associations; 2007: Fort Collins, Colorado: USDA Forest Service, Rocky Mountain Research Sta-tion. Proceedings. 135-139 p.
[10] Roberts, S.D., R.J. Rousseau, and B.L. Herrin. 2013. Assessing potential genetic gains from varietal planting stock in loblolly pine plantations. In: Guldin JM, Ed. Proceedings of the 15th Biennial Southern Silvicultural Research Conference; 2008: Hot Springs, Arkansas: USDA Forest Service General Technical Report SRS-175. 241-245 p.
[11] Dougherty, D., M. Kane, R. Teskey, R. Daniels, and J. Wright. 2012. Characterization of yields for Pinus taeda genotypes at the half-sib, full-sib, and varietal levels of genetic improvement at two planting densi-ties at age 5 in the Upper Coastal Plain of Georgia. In: Butnor, J.R., Ed. Proceedings of the 16th Bien-nial Southern Silvicultural Research Conference; 2011: Charlestown, South Carolina: USDA Forest Service General Technical Report SRS-156. 98-99 p.
[12] Pinto, J.R., R.K. Dumroese, A.S. Davis, and T.D. Landis. 2011. Conducting seedling stocktype trials: a
new approach to an old question. Journal of Forestry. 109(5):293-299.
[13] Van Deusen, P.C., A.D. Sullivan, and T.G. Mat-ney. 1981. A prediction system for cubic foot volume of loblolly pine applicable through much of its range. Southern Journal of Applied Forestry. 5(4):186–189.
[14] SAS Institute Inc. 1988. SAS/STAT User’s Guide, Release 6.03 Edition. SAS Institute Inc., Cary, N.C., United States.
[15] South, D.B., and J.B. Zwolinski. 1997. Transplant stress index: a proposed method of quantifying plant-ing check. New Forests. 13(1/3):315-328.
[16] South, D.B., M.I. Menzies, and D.G. Holden. 2005. Stock size affects outplanting survival and early growth of fascicle cuttings of Pinus radiata. New Forests. 29(3):273-288.
[17] Perry, T.O., and G.W. Baldwin. 1966. Winter break-down of the photosynthetic apparatus of evergreen species. Forest Science. 12(3):298-300.
[18] South, D.B., D.G.M. Donald, and J.L. Rakestraw. 1993. Effect of nursery culture and bud status on freeze injury to Pinus taeda and P. elliottii seedlings. South African Forestry Journal. 166:37-45.
[19] South, D.B., J.L. Rakestraw, and G.A. Low-erts. 2001. Early gains from planting large-diameter seedlings and intensive management are additive for loblolly pine. New Forests. 22(1/2):97-110.
[20] South, D.B. 1991. Testing the hypothesis that mean relative growth rates eliminate size-related growth dif-ferences in tree seedlings. New Zealand Journal of For-est Science. 21(2/3):144-164.
[21] South, D.B., and C.L. VanderSchaaf. 2006. The sta-tistical reason why some researchers say some silvi-cultural treatments “wash-out” over time. In: Con-nor, K.F., Ed. Proceedings of the 13thbiennial south-ern silvicultural research conference; 2005: Memphis, Tennessee: USDA Forest Service General Technical Report SRS-92. 333-337 p.
[22] South, D.B., and J.H. Miller. 2007. Growth response analysis after early control of woody competition for 14 loblolly pine plantations in the southern US. Forest Ecology and Management. 242(2):569-577.
[24] Zeide, B. 1993. Analysis of growth equations. Forest Science. 39(3):594-616.
[25] Sharma, R.K., E.G. Mason, and C.T. Sorens-son. 2007. Impact of planting stock quality on initial growth and survival of radiata pine clones and model-ing initial growth and survival. New Zealand Journal of Forestry. 52(1):14-23.
[26] Steiger, J.J. 2013. Impacts of different levels of genetic homogeneity on juvenile stem characteristics and potential stand-level value in loblolly pine ( Pi-nus taeda L.). Thesis, North Carolina State Univer-sity. Available from: http://repository.lib.ncsu.edu/ ir/bitstream/1840.16/8525/1/etd.pdf
[27] Sharma, R.K., E.G. Mason, and C.T. Sorensson. 2008. Productivity of radiata pine (Pinus radiata D. Don.) clones in monoclonal and clonal mixture plots at age 12 years. Forest Ecology and Management. 255(1):140-148.
[28] Purvis, S.J. 2009. Impacts of silvicultural prac-tices on within-stand variability of loblolly pine (
Pi-nus taeda) plantations. Thesis, University of Geor-gia. Available from: https://getd.libs.uga.edu/pdfs/ purvis stephen j 200908 ms.pdf
[29] Nance, W.L., and C.F. Bey. 1979. Incorporating ge-netic information in growth and yield models. In: Pro-ceedings of the 15th Southern Forest Tree Improve-ment Conference; 1979: Mississippi State University, MS.140-148 p.
[30] Blake, J.I., L.D. Teeter, and D.B. South. 1989. Analysis of the economic benefits from increasing uni-formity in Douglas fir nursery stock. Forestry. 62 (Suppl):251-262.
[31] Cannell, M.G.R. 1989. Uniform nursery stock and plantation development. Forestry. 62 (Suppl):263-273.