INTRODUCTION
Solar cells directly convert sunlight into elec-tricity, as a result of the photovoltaic effect and the fact they consist of doped semiconductor ma-terials forming a P-N Junction. Different semi -conductor materials can be used in solar cells, including Crystalline Silicon (c-Si) and Amor-phous Silicon (a-Si). The c-Si can be either Poly-crystalline or Mono-Poly-crystalline, depending on the manufacturing processes implemented.
The solar cell performance is directly affected by the weather conditions, mainly the solar irra-diance and temperature [Sauer et al. 2007]. The effect of decreasing irradiance involves a drop in solar cell output current and voltage, and the effect of increasing cell temperature consists in
a slight increase in the output current and con-siderable decrease in output voltage, resulting in an overall decrease in output power. These effects are illustrated in Figures 1 and 2.
Solar panels are tested in laboratory set-ting under Standard Test Conditions (STC) of 1000 W/m2 incident solar irradiance, 25°C cell temperature, 0.0 wind speed and 1.5 air mass spectrum. STC rarely exist in actual outdoor con-ditions, specifically the cell temperature, since most of the time, under actual operating condi-tions, will be much higher than 25°C, especially in hot climates [Pless et al. 2005]; hence, they cannot be used to estimate the actual performance and energy yield of a PV System.
Different solar cell technologies have differ -ent responses to the temperature variations, and 1 Renewable Energy Center, Applied Science Private University, Amman 11931, Jordan
2 Mechanical Engineering Department, Zarqa Private University, Az-Zarqa 13132, Jordan
3 Mechanical Engineering Department, School of Engineering, The University of Jordan, Amman 11942, Jordan
* Corresponding author’s e-mail: [email protected]
ABSTRACT
One of the main parameters that affect the solar cell performance is cell temperature; the solar cell output decreases
with the increase of temperature. Therefore, it is important to select the proper solar cell technology that performs
better at a specified location considering its average temperatures. In addition, the solar cell performance is directly reflected on the overall economics of the project. This paper is proposed to evaluate the variations in the perfor
-mance of different solar cell technologies related to the temperature in Amman, Jordan. Field data of weather sta
-tion and three PV systems (Poly-crystalline, Mono-crystalline and Thin-film) of identical design parameters were collected from Test Field Project at Applied Science Private University, Shafa Badran, Amman, Jordan. These data were analysed in the following way. estimated specific energy yield (kWh/kWp) for the three different PV systems was calculated depending on the measured value of solar irradiance and technical specifications of the installed so
-lar panels and inverters, then the actual energy yield at different temperatures over one year was compared with the estimated value, so the deviations could be determined and actual temperature coefficients for energy yield could be calculated, knowing that the three PV Systems have identical design parameters (tilt angle, azimuth angle, type and dimensions of mounting structure and inverter size) and same cleaning method and schedule. It was found that the thin-film solar panels are less affected by temperature with temperature coefficient of -0.0984%, and -0.109%, -0.124% for Mono-crystalline and Poly-crystalline respectively. These results can be implemented in the prelimi
this difference in response has been widely inves -tigated in the literature.
Hamrouni et al. [2008] investigated the effect of ambient temperature and solar irradiance on the performance of solar pumping system and con-cluded that high ambient temperature decreased the pump flow rate and overall system efficiency. Priyanka and Ravindra [2012] studied the tem-perature dependence (in the range of 273–523 K) of key characteristics of solar cell, namely the short circuit current density, open circuit volt-age, fill factor and efficiency, considering solar cells of different semiconductor materials such as. Si, GaAs, InP, CdTe and CdS. They concluded that the overall performance decreases with the increase of temperature.
Dubey et al. [2013] reviewed literature inves-tigations on the relation between cell temperature and solar cell performance, and concluded that care must be taken when using the expressions found in the literature to estimate solar cell tem-perature, because those expressions apply only for restricted mounting geometry. Tobnaghi et al. [2013] experimentally obtained coefficients to es -timate the variations in the electrical parameters of
solar cells with temperature, and the most signifi -cant coefficient obtained described the decrease of maximum power output with the increase of temperature, with coefficient of -0.005 mW/°C.
Je et al. [2014] monitored the performance of different solar cell technologies in tropical cli -mate in Singapore, including mono-crystalline Si, heterojunction crystalline Si, multicrystalline Si, double-junction Si, single-junction/double-junc -tion amorphous Si, CdTe and CIGS. In this work, the degradation rates were evaluated using Sta-tistical decomposition methods. The degradation rates for mono-crystalline Si modules were found to be equal or less than -0.8% per year, -1% for multicrystalline Si modules, -2% for amorphous Si, micromorph Si, and CdTe modules and -6% for CIGS modules.
Cañete et al. [2014] studied the performance of four different technologies in southern Spain; it was found that the performance of thin-film modules is better in summer, while in the case of poly-crystalline modules, their performance is better in winter.
This paper investigates the temperature ef-fect in Amman, Jordan, on mono-crystalline, Figure 1. Effect of Irradiance on Solar Cell I-V Curve
DESCRIPTION OF PV SYSTEMS
AND ANALYSED DATA
PV Systems
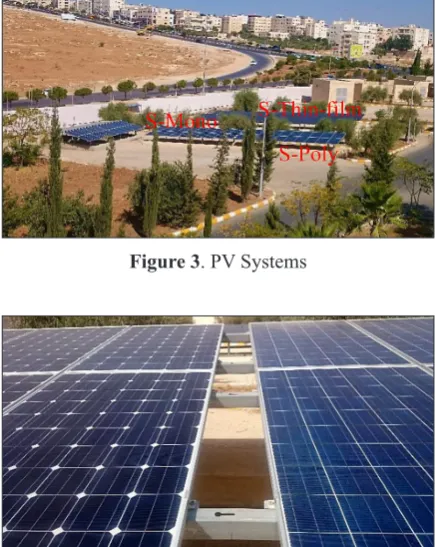
Test Field Project at Applied Science Private University (ASU) is a unique project of its type in Jordan, with its diverse installed PV System. The project comprises seven different PV proj -ects, all installed for research purposes. These systems are. CPV Dual-Axis Tracking System, Poly-crystalline Dual-Axis Tracking System, South Poly-crystalline PV System (S-Poly), South Mono-crystalline PV System (S-Mono), South Thin-film PV System (S-Thin-film), East-West Poly-crystalline PV System and East-East-West Mono-crystalline PV System. This diversity in the project offers wide research capabilities for the project, and the three south oriented PV Sys -tems were chosen for the purpose of analysis in this paper, knowing that they are all of identical design parameters (tilt angle, azimuth angle, type and dimensions of mounting structure, length and gauge of wiring and inverter size). Techni-cal specification of inverters and PV panels for the three systems are described in Table 1 and Table 2. Identical design parameters are outlined in Table 3. The three systems and weather station, which is 70 m apart from the PV Systems, are shown in Figures 3 to 6.
Weather Station
In addition to these three systems, the weath -er data w-ere also collected from a standardized weather station in ASU offering wide range of
Methodology
Since all the three PV Systems are of iden-tical design parameters and exposed to same weather conditions (irradiance, temperature and wind speed), we can assume that the difference between the actual energy yield (kWh/kWp) and estimated energy yield is primarily due to actual cell temperature (Tc) being higher (or lower) than Tc at STC, taking into account the actual incident irradiance, array size (kWp), array area and mod -ule as well as inverter efficiency.
Data and Calculations
The actual data for energy yield were ex-tracted from the monitoring system of the three inverters and are shown in Table 4. In Table 5, average monthly values for ambient tempera-ture (Ta) and global horizontal irradiance (GHI) is extracted from the weather station data logger. Direct horizontal irradiance (DHI) is calculated using Diffused/Global irradiance ratio in [PVGIS
Table 1. Technical Specifications of the Inverters System Model (kWSize
AC)
Max.
efficiency
S-Poly SB 5000TL-20 5 97%
S-Mono SB 5000TL-20 5 97%
S-Thin-film SMC 5000A 5 96.1%
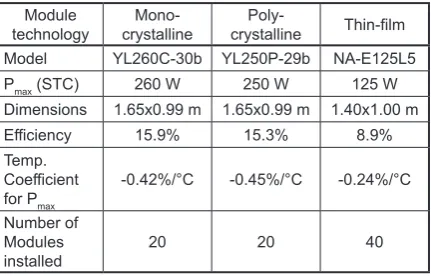
Table 2. Technical Specifications of the PV Panels Module
technology crystallineMono- crystallinePoly- Thin-film
Model YL260C-30b YL250P-29b NA-E125L5 Pmax (STC) 260 W 250 W 125 W
Dimensions 1.65x0.99 m 1.65x0.99 m 1.40x1.00 m
Efficiency 15.9% 15.3% 8.9%
Temp.
Coefficient
for Pmax -0.42%/°C -0.45%/°C -0.24%/°C
Number of
Modules
installed 20 20 40
Table 3. Identical Design Parameters
Tilt angle 11°
Azimuth angle 0° (Directly south oriented)
European Communities, 2001–2012]. The data of wind speed is neglected, since Tc is taken into account in the calculations, and Tc is directly af-fected by wind speed [Dubey 2013].
Estimated energy yield (kWh/kWp/month) can be calculated using equation 1.
max
/
P
t
A
G
E
estimated=
×
×
η
×
(1)where: G is average monthly global incident ir-radiance (kW/m2),
Ais array total area (m2),
η is module efficiency,
t is total number of hours per month and
Pmax is array maximum power (kWp).
Global incident irradiance is calculated using the following formula [Gulin et al. 2013] and solar angles in [PVSyst V6.43] form PVSyst software.
R
D
B
G
=
+
+
(2)RESULTS AND CONCLUSION
Where B is direct irradiance in tilted and aligned surface, D is diffuse irradiance on tilted and aligned surface and Risreflection irradiance on tilted and aligned surface. In the calculations,
D and R are assumed as one component since a pyranometer measures both together. Table 6 shows the results of applying equations 1 and 2.
Calculating Tc is critical in determining the amount of deviation between the actual and theo-retical energy yield at STC. Hence, Tc is calculat-ed using the formulae found in [SMA Solar Acad-emy], which simply states that if the module is free mounted (ground mounted), Tc will be 20°C higher than the ambient temperature. Therefore, annual average increase in calculated Tc over Tc at STC was found to be 12.53°C.
Annual deviation in energy yield for the three systems was found to be 15.4%, 17.0% and 19.5% for Thin-film, Mono-crystalline and Poly-crystalline PV modules, respectively. This amount of deviation is assumed to be caused by temperature rise of 12.53°C in Tc. Then, the de-viation caused by temperature rise of 1°C in Tc was calculated.
Figure 4. S-Mono (left), S-Poly (right)
Figure 5. S-Thin-film
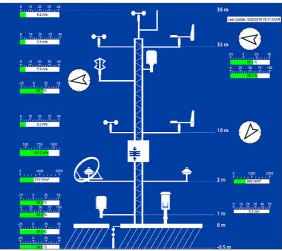
Figure 6. ASU Weather Station
The results demonstrated that energy yield for Thin-film PV modules is less affected by tempera -ture than Mono-crystalline and Poly-crystalline PV modules. Temperature coefficient for Thin-film PV modules was found to be -0.0984%, which means that for each 1°C of Tc increase above that of Tc at STC, the energy yield will decrease by 0.0984%. For Mono-crystalline and Poly-crystalline PV modules, temperature coefficient was found to be -0.109% and -0.124%, respectively.
These results are good indications of how am-bient temperature would affect the annual energy yield of a PV System, and they are of increasing importance for large-scale PV projects since the decrease of energy yield with temperature will be of greater amount.
Figure 7. Data of ASU Weather Station
Table 4. Actual Energy Yield (kWh/kWp/month)
Month S-Mono S-Poly S-Thin-film
January 91.52 87.73 84.84
February 122.68 118.21 118.35
March 144.03 139.85 140.74
April 172.41 168.53 176.11
May 182.01 179.5 191.62
June 192.65 190.5 201.94 July 198.04 194.68 209.45
August 186.23 181.28 197.11
September 159.69 153.5 166.66
October 146.54 139.48 150.69
November 110.01 104.24 105.92
December 86.15 83.02 79.29
Table 5. Average Monthly Weather Data
Month Ta (°C) GHI (W/m2) DHI (W/m2)
January 6.8 116 67
February 11.5 182 106
March 13.1 212 127
April 19.4 285 182
May 19.9 302 214
June 25.5 349 269
July 25.1 344 265
August 24.9 299 227
September 22.3 262 194
October 20.2 196 135
November 14.2 150 99
December 7.5 109 68
Table 6. Global Incident Irradiance and
Estimated Energy Yield for PV Systems
Month G (kW/m2)
Eestimated (kWh/kWp/month)
S-Mono S-Poly S-Thin-film
January 131 97 97 97
February 199 138 139 138
March 225 167 167 167
April 294 212 212 211
May 306 228 228 227
June 351 253 253 252
July 348 259 259 258
August 309 229 230 229
September 279 201 201 200
October 216 160 160 160
November 171 123 123 123
Acknowledgments
The authors wish to thank Applied Science Private University for the valuable data provided.
REFERENCES
1. Cañete C., Carretero J. and Sidrach-de-Cardona M., 2014. Energy performance of different photo -voltaic module technologies under outdoor condi-tions”, Energy, 65, Feb., 295–302.
2. Dubey S., Sarvaiya J.N. and Seshadri B. 2013.
Temperature Dependent Photovoltaic (PV)
Ef-ficiency and Its Effect on PV Production in the
World, A Review. Energy Procedia, 33, 311–321. 3. Gulin M., Vašak M. and, Baotić M., 2013. Estimation
of the global solar irradiance on tilted surfaces. Proc. of 17th International Conference on Electrical Drives
and Power Electronics, EDPE 2013, 334–339.
4. Hamrouni N., Jraidi M. and Chérif A., 2008. Solar radiation and ambient temperature effects on the
performances of a PV pumping system”, Revue des Energies Renouvelables, 11(1), 95–106. 5. Pless S., Deru M., Torcellini P., and Hayter S.
2005. Procedure for Measuring and Reporting the
Performance of Photovoltaic Systems in Buildings. Colorado. DOE/NREL and MRI, pp. 4.
6. Priyanka S. and Ravindra N.M., 2012. Tempera-ture dependence of solar cell performance–an analysis, Solar Energy Materials and Solar Cells, 101, 36–45.
7. PVGIS European Communities, 2001–2012, Monthly Solar Radiation Data, D/G. Ratio of diffuse to global irradiation, 32.040, 35.900. http.//re.jrc.
ec.europa.eu/pvgis/apps4/pvest.php?map=africa
8. PVSyst V6.43. Tools, Tables/graphs of solar
pa-rameters, Sun height and Incidence angle at 0° azi
-muth and 11° tilt in Shafa Badran, Jordan.
9. Sauer D., Rau U. and Kaltschmitt M. 2007. Pho
-tovoltaic Power Generation. In: Kaltschmitt M.,
Streicher W. and Wiese A (Eds.), Renewable En-ergy – Technology, Economics and Environment.
Berlin/Heidelberg. Springer-Verlag Publishing, pp. 268–271.
10. SMA Solar Academy. Planning and Design,
M-P-PD-1-DE-en_WW-123610, pp. 18.
11. Tobnaghi D.M., Madatov R. and Naderi D., 2013.
The effect of temperature on electrical parameters
of solar cells. International Journal of Advanced Research in Electrical, Electronics and Instrumen -tation Engineering, 2(12).
12. Ye J.Y., Reindl T., Aberle A.G. and Walsh T.M., 2014. Performance Degradation of Various PV Module Technologies in Tropical Singapore”,