RESEARCH
Development of a method for classifying
and transmitting high-resolution feeding
behavior of fish using an acceleration pinger
J. Horie
2,6*, H. Mitamura
1,3, Y. Ina
1, Y. Mashino
1, T. Noda
4, K. Moriya
1, N. Arai
3,5and T. Sasakura
2Abstract
Background: Monitoring the feeding behavior of animals in the wild is key to understanding their energetics and the influence of the environment on their survival. Recently, a novel acceleration transmitter that processes accel-eration data onboard and outputs identification results has been developed by AquaSound Inc. (Kobe, Japan) to investigate feeding biology in fish. To date, few attempts have been made to identify the feeding behavior of fish using transmitters, and none of these attempts accomplished classification of alternative feeding behaviors according to prey items. The objective of this study was to develop an algorithm that can be incorporated in the acceleration transmitter and can identify alternative feeding behaviors in fish, using red-spotted grouper (Epinephelus akaara) as a model species.
Results: Most of the identification algorithms describing feeding behavior in fish developed in previous studies used a combination of acceleration and angular velocity. In this study, we constructed an algorithm based on three-axis accelerometry data alone, since a gyroscope consumes much more electricity and would shorten the battery life of the transmitter. Acceleration data were obtained in tank experiments. Feeding behaviors, induced by feeding three types of live prey (Trachurus japonicus, Metapenaeus ensis and Hemigrapsus sanguineus), as well as other behaviors (routine and escape movements), were simultaneously recorded at 200 Hz by acceleration data loggers, implanted in the abdominal cavities of fish, and by a video camera. A decision tree, including a three-dimensional lookup table, was constructed to classify the behaviors into four behavior classes: shrimp-eating, fish-eating, crab-eating and other behaviors. The classification accuracy was estimated to be 0.77 (F-measure) for shrimp-eating, 0.73 for fish-eating, 0.71 for crab-eating and 0.78 for other movements, using fivefold cross-validation.
Conclusions: The algorithm developed in this study could be incorporated into the transmitter, which would record acceleration data at high frequency (200 Hz), process the data onboard and output classification results of behaviors. This method would reveal more aspects of fish biology, such as individual feeding strategies.
Keywords: Biotelemetry, Acceleration transmitter, Lookup table
© The Author(s) 2017. This article is distributed under the terms of the Creative Commons Attribution 4.0 International License (http://creativecommons.org/licenses/by/4.0/), which permits unrestricted use, distribution, and reproduction in any medium, provided you give appropriate credit to the original author(s) and the source, provide a link to the Creative Commons license, and indicate if changes were made. The Creative Commons Public Domain Dedication waiver (http://creativecommons.org/ publicdomain/zero/1.0/) applies to the data made available in this article, unless otherwise stated.
Background
One of the key goals in fish biology is to understand feed-ing behavior. When feedfeed-ing, most fish exhibit character-istic changes in acceleration, which are, in most cases, distinct from those of routine movements [1]. Feeding behavior can thus be investigated in detail by measuring
characteristic changes in acceleration. Instruments that are widely used to measure physical variables in/around target fish in the wild are animal-borne data loggers and ultrasonic transmitters (aka pingers or acoustic trans-mitters). Previous studies have shown that animal-borne acceleration and/or gyroscope data loggers are useful to analyze the feeding behaviors of various species of fish [2–4]. However, a data logger has the disadvantage that it must be retrieved after attachment to a target fish (to download the data); this is often extremely difficult,
Open Access
*Correspondence: [email protected]
depending on the species. In contrast, a pinger does not have this disadvantage; data are transmitted ultrasoni-cally. In fact, pingers have been widely used for remotely measuring physiological and behavioral variables of free-living animals [5]. However, the amount of information that a pinger can send per unit of time is critically lim-ited, since underwater communication is compromised by multipath propagation and strong signal attenua-tion. It follows that the sampling frequency of accelera-tion afforded by a pinger tends to be much lower (by 5–10 Hz) than that of a data logger. Sampling frequency can present a major problem, according to Broell et al. [2], who suggested that the sampling frequency should be more than 100 Hz for reliable identification of the feeding behaviors of predatory fish.
Nevertheless, a few novel acceleration pingers have been developed successfully to analyze the biological fea-tures of various fish. One of the best-known acceleration pingers is the V9AP (Vemco Inc., Nova Scotia, Canada; sampling frequency: 5 or 10 Hz), which transmits general variables such as a root mean square (RMS) calculated from three-axis acceleration. The outstanding advantage of such a method is that the pinger can detect the move-ments of a target animal using relatively simple statistics. These pingers have been used to study the field activity and metabolic rates of bonefish [6] and giant Australian cuttlefish [7], the spatial ecology and residency patterns of the great barracuda [8], the seasonal residency of juve-nile sand tiger sharks [9], energy use by wild adult Pacific salmon [10], and seasonal changes in the activity levels of horseshoe crabs [11]. Another well-known accelera-tion pinger is the AccelTag (Thelma Biotel, Trondheim, Norway; sampling frequency: 20 Hz). This is a custom-adapted pinger that transmits behavior-specific parame-ters derived from three-axis acceleration data such as tilt angle, roll angle, lateral acceleration and vertical accel-eration. This method, in which a pinger transmits not raw acceleration data but several simplified parameters derived onboard from enormous amounts of data, has resolved the essential problem of pingers, i.e., the inabil-ity to transmit large amounts of data. In fact, the Accel-Tag has been utilized to detect specific behaviors in fish, such as burrowing movements of Lusitanian toadfish [12,
13] and the tail beat activity of red-spotted grouper [14]. Despite these advances, pinger-mediated remote meas-urements of feeding behavior in fish remain challeng-ing; the sampling frequency is too low (<100 Hz) to allow accurate classification of feeding behavior.
Recently, we have developed a new acceleration pinger (AquaSound Inc., Kobe, Japan) that samples acceleration data at a high frequency (200 Hz), classifies the behav-iors of target fish via onboard processing and outputs the results of such classifications. The pinger must initially
be programmed with a classification algorithm based on three-axis acceleration data. Such algorithms should not be elaborate; long processing times may compromise the pinger’s other operations (sampling and transmitting). In this study, we developed a decision tree, including a three-dimensional lookup table that serves as the classi-fication algorithm. The major advantage of this approach is that several key parameters are examined in detail. A lookup table alone requires a great deal of program mem-ory. The combination of a lookup table and a decision tree enhances classification accuracy within the extent that the algorithm does not consume excessive memory. We first conducted tank experiments using acceleration data loggers to obtain acceleration data. We chose red-spotted groupers (Epinephelus akaara) as the model spe-cies. This fish exhibits strong site fidelity [15] and is a typical sit-and-wait predator that remains still until food items are found (triggering feeding behavior) or a threat is detected (triggering escape behavior). We assumed that the foraging tactics of this fish were relatively advan-tageous for us in developing the algorithm; this species does not frequently perform dynamic behaviors, other than while feeding. Thus, feeding behavior was expected to be distinguishable from other behaviors.
Methods
Study animals
Eighteen mature red-spotted groupers [total length (TL): 35.0 ± 3.7 mm; body mass (BM): 687 ± 197 g] obtained from local fish dealers (in Osaka and Maizuru, Japan) were used. Red-spotted groupers grow up to about 60 cm in length and are found around the coasts of southern Honshu (Japan) and eastern China [16]. Previous stud-ies of stomach contents have shown that mature fish feed principally on smaller fish, shrimps and crabs [15].
Tank experiments
Tank experiments using data loggers were conducted in October–November 2013, October–December 2014 and October–December 2015 at Maizuru Fisheries Research Station, Kyoto University, Kyoto, Japan. Eight-een red-spotted groupers were individually kept in fiber-reinforced plastic (FRP) tanks (length: 70 cm; width: 100 cm) in which seawater circulated at a temperature of 17.2 ± 1.1 °C to a depth of 70 cm. An acceleration data logger (size: 60 × 6 × 12 mm3; mass: 7 g in air;
was inserted. The wound was closed using an operating needle and sutures. The implant operation took approxi-mately 5 min. The weight of the logger in water was less than 3% of the weight of the grouper. After surgery, the groupers were acclimatized for at least 1 week. During the acclimatization period, we supplied the groupers with three types of live prey: fish (Japanese horse mack-erel, Trachurus japonicus), shrimps (Metapenaeus ensis) and crabs (Hemigrapsus sanguineus). Subsequently, feed-ing behaviors were logged as three-axis acceleration data using the data loggers and simultaneously recorded as video images using a video camera (HDR-CX720V; SONY, Tokyo, Japan). The video images were used to associate all acceleration data with each of three behav-ioral patterns (fish-eating, shrimp-eating, or crab-eating). The data loggers were set to record fish behaviors for 25 min each day for 5–10 days. Shrimp-eating and crab-eating events were sampled between 15:00 and 18:00, while fish-eating events were sampled between 18:00 and 21:00. These time frames were chosen based on a study of the feeding habits of red-spotted grouper [17].
Data analyses
Data analyses were performed using MATLAB (Math-Works, Natick, MA, USA). We first extracted all behav-ioral events from the three-axis acceleration datasets. An ‘event’ was defined as the 0–250-ms interval commenc-ing at the time when acceleration on any axis surpassed the threshold (2.0 g). This threshold was chosen to ensure that we detected all feeding events but not tiny, subtle routine movements.
The acceleration along each axis (ax, ay and az) was
rela-beled because an instrument inserted into the abdominal cavity of a fish would not be completely fixed. In the tank experiments, the y-axis was directed forward, but x- and
z-axes were not consistently directed vertically and later-ally, judging from acceleration data from six red-spotted groupers over 10 days in which they did not move. There-fore, we termed the acceleration along the longitudinal axis (body axis ab) ay and acceleration in the orthogonal
direction (ar)
a2
x+a2z (Fig. 1). The vectorial sum of all
acceleration axes was thus |a| =a2
x+a2y+a2z. Results
Acceleration data
In the tank experiments, we observed 49 shrimp-eating events (n = 5 fish), 9 fish-eating events (n = 3 fish), 15 crab-eating events (n = 3 fish) and 45 other behavioral events (n = 8 fish). More details about the feeding events are given in Table 1.
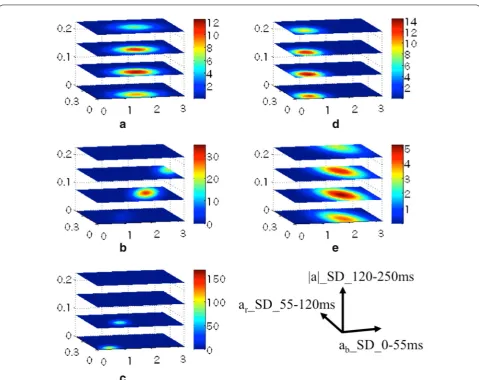
A typical example of each behavior is shown in Fig. 2. At first glance, it seemed that (a) most of the
characteristic changes in acceleration ended within 50 ms after event initiation, (b) the amplitude and dura-tion of acceleradura-tion during fish-eating and other (escape) behavior tended to be much greater than those during any other behaviors, while (c) acceleration during crab-eating and other (routine) behavior was lower than that during shrimp-eating, and (d) the duration of other behaviors (routine and escape) was exceptionally long in certain cases. We hypothesized that these characteristics were key components when selecting parameters to clas-sify feeding behaviors.
Classification phase I
We first constructed a lookup table to classify feeding behaviors. For accurate classification, parameters used in a lookup table not only need to be characteristic of each type of behavior, but also somewhat independent of each other. In terms of the characteristics mentioned above, the amplitude and duration of acceleration are good examples of such parameters. Thus, we first divided each event into three phases using the border times tS and
tE: the commencement phase (0 to ts ms); the transition
phase (ts to tE ms); and the final phase (tE to 250 ms). The
commencement phase would describe the intensity of a movement; the final phase would reflect whether a fish became completely stationary or not; and the transition phase would support the other two parameters. Parame-ters from each of the three phases would be independent. We chose the standard deviation of ab in the
commence-ment phase as parameter I; the standard deviation of ar
in the transition phase as parameter II; and the standard deviation of |a| in the final phase as parameter III. We assumed that ab was the most significant axis early in
the behavior and that |a| reflected even minimal move-ment along any axis. The border times tS and tE were
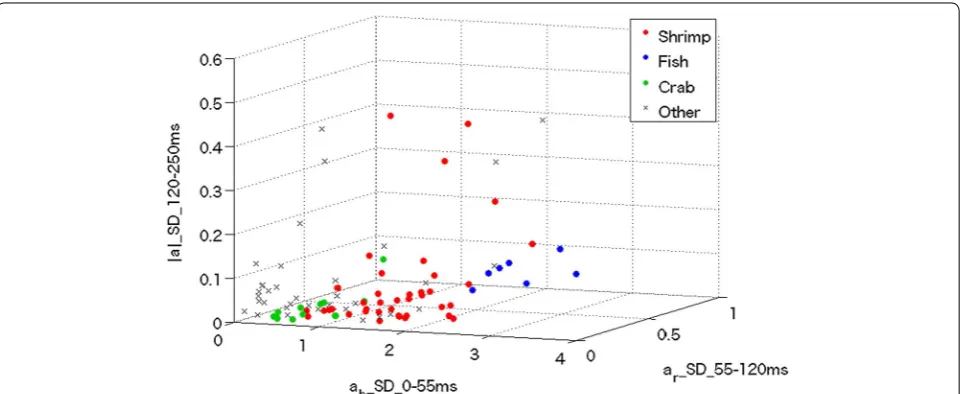
chosen to be 55 and 120 ms, respectively, based on the data of Fig. 3, where the maximum classification accuracy (defined below) was evident. Finally, the distribution map was created, as shown in Fig. 4.
Based on the distribution (Fig. 4), we estimated the sta-tistical population using a three-dimensional Gaussian
distribution (Fig. 5). The probability density of each type of behavior was calculated. Other (routine) behavior was condensed into very narrow ranges of all three parame-ters. Fish-eating spreads toward the directions of param-eters I and II, but was noticeably limited in the direction of parameter III. Shrimp-eating was between other (rou-tine) and fish-eating behavior. Crab-eating overlapped somewhat with shrimp-eating and other (routine) behav-ior. Other (escape) behavior spanned almost the entire distribution, although the density thereof was rather low.
The classification algorithm, i.e., the lookup table, was derived from the probability density distribution. First, the three-dimensional volume was divided into cells. The
Table 1 Number of feeding events per individual that per-formed the behaviors
Indiv. no. Crab-eating Shrimp-eating Fish-eating
1 3 3 5
2 0 11 0
7 0 0 3
12 0 11 0
14 0 11 0
15 8 13 0
17 4 0 0
18 0 0 1
Fig. 2 A typical example of changes in three-axis acceleration associated with a shrimp-eating, b fish-eating, c crab-eating, d others (routine) and
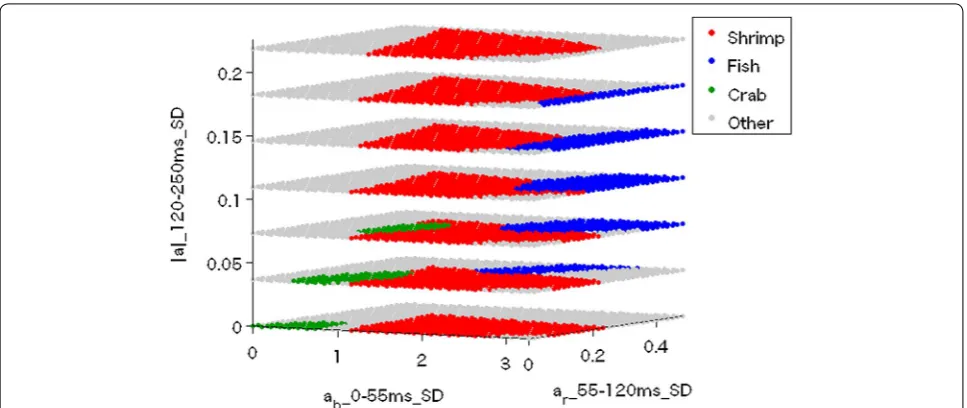
probability density of each behavioral pattern in each cell was calculated. Each cell was labeled with the behavioral pattern for which the probability density was greatest. We thus obtained the 3D lookup table shown in Fig. 6.
We ran a classification test using fivefold cross-valida-tion (Table 2). Of all behaviors, 38/49 (78%) shrimp-eating, 6/9 (67%) fish-eating, 10/15 (67%) crab-eating and 25/45 (56%) other behaviors were correctly classified. However, many shrimp-eating and other behaviors were misclassi-fied as eating. This was because some aspects of crab-eating were very similar to those of shrimp-crab-eating and
other behaviors. Therefore, we chose additional parame-ters to discriminate among shrimp-eating, crab-eating and other behaviors classified as crab-eating.
Classification phase II
The strongest candidate for parameter IV was the ar of the
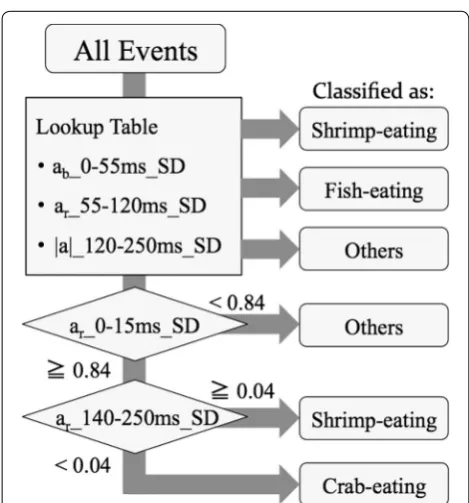
early portion of behaviors; acceleration that was orthogo-nal to the body axis was rather independent of parameter I. We calculated p values between (a) shrimp-eating and crab-eating, (b) crab-eating and other behaviors and (c) other behaviors and shrimp-eating, as functions of the border times (the times from event initiation) (Fig. 7a). We found that other behaviors could be reasonably well separated (p < 0.01) when the border time was 15 ms. We set the threshold where the Mahalanobis distances (a sta-tistical distance from the mean [18]) of crab-eating and other behaviors were equal (Fig. 7b).
Figure 7a shows that the p value comparison between shrimp-eating and crab-eating decreased as the border time exceeded 70 ms. This indicated that the later part of
ar might serve as parameter V, which could distinguish
shrimp-eating from crab-eating. We calculated p values as functions of the time to the end of an event (250 ms) (Fig. 8a). We found that the p value for the comparison between shrimp-eating and crab-eating reached its low-est level (p < 0.01) when the border time was 140 ms. We thus set this as the threshold so that true-positive crab-eating events were not discarded (Fig. 8b).
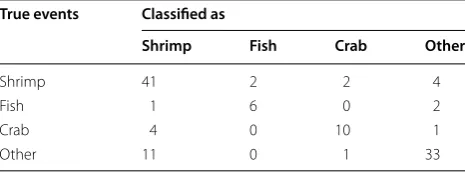
Finally, we fixed the classification flow as described in Fig. 9. The classification test results were revised as shown in Table 3. Compared to Table 2, eight events of other behavior and four events of shrimp-eating were
Fig. 3 A contour map identifying the optimum border times tS and
tE. The horizontal, vertical and colored axes show border time 1 (tS),
border time 2 (tE) and the harmonic mean of the F-measure for all
types of behaviors, respectively
Fig. 4 Scatter plots of all behaviors. Each circle is plotted at a location specified by three parameters. The terms ‘ab_SD_0-55 ms,’ ‘ar_SD_55-120 ms’
successfully eliminated from the totals of crab-eating. Finally, the F-measures, the harmonic means (thus bal-anced indicators) of precision and recall, came down to 0.77 ± 0.11 for shrimp-eating, 0.73 ± 0.19 for fish-eating, 0.71 ± 0.22 for crab-eating and 0.78 ± 0.04 for other behaviors (the figures are means with standard deviations).
Discussion
We found that the feeding behaviors of red-spotted groupers could be detected and classified to accuracies of 0.77 for shrimp-eating, 0.73 for fish-eating and 0.71 for crab-eating in the F-measures, employing only accelera-tion data along the body axis and orthogonal direcaccelera-tion. These accuracies were somewhat less but still comparable to those produced by employing both acceleration and
angular velocity [4]. We selected five parameters, i.e., the standard deviation of ab of 0‒55 ms, the standard
devia-tion of ar of 55‒120 ms, the standard deviation of |a| of
120‒250 ms, the standard deviation of ar of 0‒15 ms and
the standard deviation of ar of 140‒250 ms, for the
classi-fication algorithm. The behavioral patterns of red-spotted groupers are associated with fairly specific amplitudes and durations of acceleration. Thus, we could classify feeding behaviors accurately using time-specific param-eters derived from only acceleration data.
Although target fish need to be within the range of a receiver (several hundred meters for example; cf. AQRM-1000, AquaSound Inc., Kobe, Japan) when data are trans-mitted, it would be possible to count and log the number of each behavior in the memory of a pinger. These data could then be transmitted to the receiver when the fish is
Fig. 5 Probability densities of shrimp-eating, fish-eating, others (routine) and others (escape). The probability of each type of behavior is high in the
within its detection range. Therefore, the feeding behav-iors of a target fish do not always need to be performed within the detection range of the receiver.
Many previous studies assessing the feeding behavior of fish utilized data loggers. A data logger can measure a comparatively wide range of variables, such as accelera-tion, angular velocity and magnetic parameters at high frequency. Such variables have enabled us to accurately
Fig. 6 Three-dimensional lookup table that determines behavioral types. The most probable behavioral pattern at each point is assigned. For
exam-ple, if the acceleration data parameters are 2, 0.5 and 0.1, respectively, the behavior is classified as shrimp-eating
Table 2 Classification test results using the lookup table
True events Classified as
Shrimp Fish Crab Other
Shrimp 38 2 6 3
Fish 1 6 0 2
Crab 4 0 10 1
Other 11 0 9 25
Fig. 7 ap values by the border time from event initiation. The p value between crab-eating and other behaviors was minimal when the border
detect and identify specific behaviors, including feeding behaviors, of fish [4, 19]. However, a data logger must be retrieved after being attached to a target animal to download data. On the other hand, a pinger can transmit data remotely, while the amount of data it can transmit are technically limited [13]. Previous studies have suc-ceeded in assessing the field activity of fish using a V9AP (VEMCO Inc., Nova Scotia, Canada), along with several
specific behaviors of fish such as burrowing movements and tail beat activity using AccelTag (Thelma Biotel, Trondheim, Norway). However, remote assessment of feeding behavior in fish has remained challenging.
In this study, we developed an algorithm for a new acceleration pinger that classifies the feeding behav-ior of fish. The algorithm will be incorporated in the pinger, which records acceleration data at high frequency (200 Hz), processes the data onboard and outputs clas-sification results of behaviors. We used red-spotted groupers as a test species and showed that their feeding behaviors could be classified with accuracies of more than 0.7 (in the F-measures) using acceleration data. However, the behavior of red-spotted groupers in experi-mental tanks will differ somewhat from that in the wild. The frequency of each type of behavior could vary with the surrounding environment. In addition, each fish will interact with other individuals, creating other move-ments in addition to the routine and escape movemove-ments. Thus, the accuracy of classification may be reduced to some extent in the field. Nevertheless, our method could be applied to any animal of sufficient size to accommo-date the experimental instrument by adapting the clas-sification algorithm, although it might be fairly difficult to apply this method to fish that do not employ ambush hunting strategies, as these species may be more likely to move completely out of the receiver’s range and may not make striking acceleration when feeding. The results of previous studies support the applicability of our method (e.g., [3, 4]). The method by which this procedure could be adapted to use in other species would be as follows: (1) conducting tank experiments using acceleration data log-gers and a video camera, (2) analyzing acceleration data
Fig. 8 ap value versus the border time to the end of the event. The p value between crab-eating and shrimp-eating was minimal when the border
time was 140 ms. b A box plot of the parameter ar_SD_140-250 ms, which describes the standard deviation of orthogonal acceleration from 140 to 250 ms. Events for which this parameter was less than 0.04 were classified as crab-eating
Fig. 9 Flow of classification. The first fork presents the
to find the motions common to each behavioral pattern, (3) choosing several relevant parameters to construct a classification algorithm (either a lookup table or a deci-sion tree) and (4) programming the algorithm into an acceleration transmitter. This method could also poten-tially be applied to animals other than fish. For example, the feeding strategies of seabirds and marine mammals are also of interest to biologists (cf research using accel-eration data loggers and/or ARGOS transmitters [20–22] and a review paper [23]), but research in this area has been hindered by problems such as the difficulty of tag retrieval and low frequencies of data transmission. Meth-ods for remote sensing of accelerational events in such animals could also be broadened using this method.
Conclusions
Feeding is one of the most fundamental elements of fish biology, as are breeding and death [15]. The feed-ing behavior of fish critically affects growth and matu-ration and plays an important role in estimating the environmental accommodations of their habitats. How-ever, methods used to assess the feeding behavior of fish in the field have mainly been limited to enumerat-ing stomach contents [15, 24, 25] and video-recording [26]. We developed a new method, using an acceleration pinger, to assess the feeding behaviors of fish in the wild and showed that it may be possible to use this method to investigate other aspects of fish biology, such as indi-vidual feeding strategies.
Abbreviations
RMS: root mean square (statistical measure of the magnitude of varying quan-tity); TL: total length; BM: body mass; FRP: fiber-reinforced plastic.
Authors’ contributions
JH, HM and TS designed and developed the acceleration pinger. JH, YI and YM conducted tank experiments using acceleration data loggers. JH, YI, YM and TN analyzed the acceleration data. JH, HM, TN, KM and NA wrote the draft of manuscript. All authors read and approved the final manuscript.
Author details
1 Graduate School of Informatics, Kyoto University, Yoshida-honmachi, Sakyo-ku, Kyoto, Kyoto 606-8501, Japan. 2 AquaSound Inc., Portisland Building 501, 4-1-1 Minato-jima Nakamachi, Chuo-ku, Kobe, Hyogo 650-0046, Japan.
3 CREST, Japan Science and Technology Agency, Kawaguchi Center Building, 4-1-8 Hon-cho, Kawaguchi, Saitama 332-0012, Japan. 4 The Institute of Statisti-cal Mathematics, 10-3 Midori-cho, Tachikawa, Tokyo 190-8562, Japan. 5 Field Science Education and Research Center, Kyoto University, Kitashirakawa Oiwake-cho, Sakyo-ku, Kyoto, Kyoto 606-8502, Japan. 6 Present Address: Graduate School of Informatics, Kyoto University, Yoshida-honmachi, Sakyo-ku, Kyoto, Kyoto 606-8501, Japan.
Acknowledgements
We thank all the members of Maizuru Fisheries Research Station for all the support on the tank experiments. We sincerely acknowledge Katsumi Ito and Yasuhiko Endo (AquaSound Inc.) for all the helps and advices with respect to the acceleration pinger.
Competing interests
The authors declare that they have no competing interests.
Ethics approval and consent to participate
All procedures of the experiments were approved by the Animal Research Committee of Kyoto University (Permit Numbers: Informatics 25-3 and Inf-K14003).
Availability of data and materials
The datasets used and/or analyzed during the current study available from the corresponding author on reasonable request.
Funding
The funding for this study was obtained from Grant-in-Aid for Young Scientists (A) (25712022).
Publisher’s Note
Springer Nature remains neutral with regard to jurisdictional claims in pub-lished maps and institutional affiliations.
Received: 18 December 2016 Accepted: 18 May 2017
References
1. Domenici P, Blake R. The kinematics and performance of fish fast-start swimming. J Exp Biol. 1997;200(8):1165–78.
2. Broell F, Noda T, Wright S, Domenici P, Steffensen JF, Auclair JP, Taggart CT. Accelerometer tags: detecting and identifying activities in fish and the effect of sampling frequency. J Exp Biol. 2013;216:1255–64.
3. Noda T, Kawabata Y, Arai N, Mitamura H, Watanabe S. Monitoring escape and feeding behaviours of cruiser fish by inertial and magnetic sensors. PLoS ONE. 2013;8:e79392.
4. Kawabata Y, Noda T, Nakashima Y, Nanami A, Sato T, Takebe T, Soyano K. Use of a gyroscope/accelerometer data logger to identify alternative feeding behaviours in fish. J Exp Biol. 2014;217(18):3204–8.
5. Cooke SJ, Hinch SG, Wikelski M, Andrews RD, Kuchel LJ, Wolcott TG, Butler PJ. Biotelemetry: a mechanistic approach to ecology. Trends Ecol Evol. 2004;19:334–43.
6. Murchie KJ, Cooke SJ, Danylchukc AJ, Suski CD. Estimates of field activity and metabolic rates of bonefish (Albula vulpes) in coastal marine habitats using acoustic tri-axial accelerometer transmitters and intermittent-flow respirometry. J Exp Mar Biol Ecol. 2011;396:147–55.
7. Payne NL, Gillanders BM, Seymour RS, Webber DM, Snelling EP, Semmens JM. Accelerometry estimates field metabolic rate in giant Australian cuttlefish Sepia apama during breeding. J Anim Ecol. 2011;80:422–30.
8. O’Toole AC, Murchie KJ, Pullen C, Hanson KC, Suski CD, Danylchuk AJ, Cooke SJ. Locomotory activity and depth distribution of adult great bar-racuda (Sphyraena barracuda) in Bahamian coastal habitats determined using acceleration and pressure biotelemetry transmitters. Mar Freshw Res. 2010;61:1446–56.
9. Kneebone J, Chisholm J, Skomal G. Mar Biol. 2014;160(5):1149–63. Table 3 Classification test results using both the lookup
table and the decision tree
True events Classified as
Shrimp Fish Crab Other
Shrimp 41 2 2 4
Fish 1 6 0 2
Crab 4 0 10 1
• We accept pre-submission inquiries
• Our selector tool helps you to find the most relevant journal • We provide round the clock customer support
• Convenient online submission • Thorough peer review
• Inclusion in PubMed and all major indexing services • Maximum visibility for your research
Submit your manuscript at www.biomedcentral.com/submit
Submit your next manuscript to BioMed Central
and we will help you at every step:
10. Wilson SM, Hinch SG, Eliason EJ, Farrell AP, Cooke SJ. Calibrating acoustic acceleration transmitters for estimating energy use by wild adult Pacific salmon. Comp Biochem Physiol A. 2013;164:491–8.
11. Watson WH III, Johnson SK, Whitworth CD, Chabot CC. Rhythms of loco-motion and seasonal changes in activity expressed by horseshoe crabs in their natural habitat. Mar Ecol Prog Ser. 2016;542:109–21.
12. Føre M, Alfredsen JA, Gronningsater A. Development of two telemetry-based systems for monitoring the feeding behaviour of Atlantic salmon (Salmo salar L.) in aquaculture sea-cages. Comput Electron Agric. 2011;76(2):240–51.
13. Almeida PR, Pereira TJ, Quintella BR, Gronningsaeter A, Costa MJ, Costa JL. Testing a 3-axis accelerometer acoustic transmitter (AccelTag) on the Lusitanian toadfish. J Exp Mar Biol Ecol. 2013;449:230–8.
14. Yoshida N, Mitamura H, Sasaki M, Nobuaki N. Measurement of activity for sit-and-wait predator, red-spotted grouper, using acoustic acceleration transmitter. J Adv Mar Sci Technol Soc. 2015;21(1):1–5.
15. Kayano Y. Feeding Habits of the Grouper, Epinephelus akaara, on Artificial Reefs. Suisanzoshoku. 2001;49(1):15–21.
16. Ukawa M, Higuchi M, Mito S. Spawning habits and early life history of a serranid fish, Epinephelus akaara. Jpn J Ichthyol. 1966;13:156–61. 17. Masuda R, Matsuda K, Masaru T. Laboratory video recordings and
underwater visual observations combined to reveal activity rhythm of red-spotted grouper and banded wrasse, and their natural assemblages. Environ Biol Fish. 2012;95:335–46.
18. Mahalanobis PC. On the generalized distance in statistics. Proc Natl Inst Sci India. 1936;12:49–55.
19. Noda T, Kawabata Y, Arai N, Mitamura H, Watanabe S. Animal-mounted gyroscope/accelerometer/magnetometer: in situ measurement of the movement performance of fast-start behaviour in fish. J Exp Mar Biol Ecol. 2013;451:55–68.
20. Gallon S, Bailleul F, Charrassin J-B, Guinet C, Handrich Y, Hindell M. Identifying foraging events in deep diving southern elephant seals, Mirounga leonina, using acceleration data loggers. Deep-Sea Res. 2013;88–89:14–22.
21. Naito Y, Bornemann H, Takahashi A, McIntyre T, Plotz J. Fine-scale feeding behavior of Weddell seals revealed by a mandible accelerometer. Polar Sci. 2010;4:309–16.
22. Naito Y, Costa DP, Adachi T, Robinson PW, Fowler M, Takahashi A. Unravel-ling the mysteries of a mesopelagic diet: a large apex predator specializes on small prey. Funct Ecol. 2013;27:710–7.
23. Wilson RP, Vandenabeele SP. Technological innovation in archival tags used in seabird research. Mar Ecol Prog Ser. 2012;451:245–62. 24. Hyslop EJ. Stomach contents analysis—a review of methods and their
application. J Fish Biol. 1980;17(4):411–29.
25. Cortés E. A critical review of methods of studying fish feeding based on analysis of stomach contents: application to elasmobranch fishes. Can J Fish Aquat Sci. 1997;54(3):726–38.