University of Pennsylvania
ScholarlyCommons
Publicly Accessible Penn Dissertations
Fall 12-22-2010
Coexpression Networks Based on Natural
Variation in Human Gene Expression at Baseline
and Under Stress
Renuka Nayak
University of Pennsylvania, [email protected]
Follow this and additional works at:http://repository.upenn.edu/edissertations Part of theComputational Biology Commons, and theGenomics Commons
Recommended Citation
Nayak, Renuka, "Coexpression Networks Based on Natural Variation in Human Gene Expression at Baseline and Under Stress" (2010).Publicly Accessible Penn Dissertations. 1559.
Coexpression Networks Based on Natural Variation in Human Gene
Expression at Baseline and Under Stress
Abstract
Genes interact in networks to orchestrate cellular processes. Here, we used coexpression networks based on natural variation in gene expression to study the functions and interactions of human genes. We asked how these networks change in response to stress.
First, we studied human coexpression networks at baseline. We constructed networks by identifying correlations in expression levels of 8.9 million gene pairs in immortalized B cells from 295 individuals comprising three independent samples. The resulting networks allowed us to infer interactions between biological processes. We used the network to predict the functions of poorly-characterized human genes, and provided some experimental support. Examining genes implicated in disease, we found that IFIH1, a diabetes susceptibility gene, interacts with YES1, which affects glucose transport. Genes predisposing to the same diseases are clustered non-randomly in the network, suggesting that the network may be used to identify candidate genes that influence disease susceptibility. These analyses showed that human coexpression networks based on natural variation may offer information on gene functions and interactions.
We then examined the extent to which networks change upon stress. We studied changes in expression levels and gene relationships induced by two stresses: endoplasmic reticulum (ER) stress and exposure to ionizing radiation (IR). Using large datasets, we found between 30-70% of genes change expression upon stress. In contrast, the majority (between 65-95%) of gene relationships are maintained as assessed using statistical, network and machine learning methods. However, a subset of genes altered relationships upon stress. These genes tended to be critical for the cellular response to the specific stress examined. For example, BIP and CHOP altered relationships in ER stress; p21, GADD45A and CCNB1 altered relationships in IR stress. Some genes with altered relationships have not been implicated in ER or IR stress or do not change
expression; these are genes that may be critical but remain unexplored. We provide evidence implicating two such genes, INHBE and SLC3A2, in the response to ionizing radiation. Our results suggest that the majority of gene relationships are maintained upon stress, but those genes with altered relationships tend to be critical to the stress response.
Degree Type Dissertation
Degree Name
Doctor of Philosophy (PhD)
Graduate Group
Cell & Molecular Biology
Second Advisor Michael J. Kearns
Keywords
genomics, networks, genetics, computational biology
Subject Categories
COEXPRESSION NETWORKS BASED ON NATURAL VARIATION IN HUMAN
GENE EXPRESSION AT BASELINE AND UNDER STRESS
Renuka R. Nayak
A DISSERTATION
in
Cell and Molecular Biology
Presented to the Faculties of the University of Pennsylvania in Partial Fulfillment of the
Requirements for the Degree of Doctor of Philosophy
2010
Supervisor of Dissertation Co-supervisor
_______________________ _______________________
Vivian G. Cheung Michael J. Kearns
Professor, Pediatrics Professor, Computer and Information Science
Graduate Group Chairperson
_______________________
Daniel S. Kessler, Associate Professor, Cell and Developmental Biology
Dissertation Committee
Marisa S. Bartolomei, Professor, Cell and Developmental Biology Morris J. Birnbaum, Professor, Medicine
Shane T. Jensen, Associate Professor, Statistics
ii
iii ACKNOWLEDGEMENTS
I am deeply indebted to many people for the project undertaken here.
I thank Vivian G. Cheung. She encouraged me to be fearless, to find joy in nature
and science always, and to push myself to the limit of my abilities. Her tireless efforts to
provide feedback and advice have shaped me.
I thank Michael J. Kearns. He introduced me to new ways of thinking and
learning about biology. It is clearly manifested in this dissertation. He has been
instrumental to my development as a young researcher.
I thank my thesis committee members for their excellent suggestions, their
encouragement and for sharing their stories with me. Many thanks to members of the
Cheung and Spielman labs. I have enjoyed contemplating profound scientific and
non-scientific ideas with you over the years. Thanks to colleagues, friends, and the MD-PhD
Office for their guidance and friendship.
And, most importantly, I thank my parents and my brother. Your unending love
iv
ABSTRACT
COEXPRESSION NETWORKS BASED ON NATURAL VARIATION IN HUMAN
GENE EXPRESSION AT BASELINE AND UNDER STRESS
Renuka R. Nayak
Dissertation Advisors: Vivian G. Cheung and Michael J. Kearns
Genes interact in networks to orchestrate cellular processes. Here, we used
coexpression networks based on natural variation in gene expression to study the
functions and interactions of human genes. We asked how these networks change in
response to stress.
First, we studied human coexpression networks at baseline. We constructed
networks by identifying correlations in expression levels of 8.9 million gene pairs in
immortalized B cells from 295 individuals comprising three independent samples. The
resulting networks allowed us to infer interactions between biological processes. We
used the network to predict the functions of poorly-characterized human genes, and
provided some experimental support. Examining genes implicated in disease, we found
that IFIH1, a diabetes susceptibility gene, interacts with YES1, which affects glucose
transport. Genes predisposing to the same diseases are clustered non-randomly in the
network, suggesting that the network may be used to identify candidate genes that
v networks based on natural variation may offer information on gene functions and
interactions.
We then examined the extent to which networks change upon stress. We studied
changes in expression levels and gene relationships induced by two stresses: endoplasmic
reticulum (ER) stress and exposure to ionizing radiation (IR). Using large datasets, we
found between 30—70% of genes change expression upon stress. In contrast, the
majority (between 65—95%) of gene relationships are maintained as assessed using
statistical, network and machine learning methods. However, a subset of genes altered
relationships upon stress. These genes tended to be critical for the cellular response to
the specific stress examined. For example, BIP and CHOP altered relationships in ER
stress; p21, GADD45A and CCNB1 altered relationships in IR stress. Some genes with
altered relationships have not been implicated in ER or IR stress or do not change
expression; these are genes that may be critical but remain unexplored. We provide
evidence implicating two such genes, INHBE and SLC3A2, in the response to ionizing
radiation. Our results suggest that the majority of gene relationships are maintained upon
vi
TABLE OF CONTENTS
Acknowledgements iii Abstract iv
Table of Contents vi
List of Tables ix
List of Figures x
Introduction 1
Chapter 1: Coexpression network based on natural variation in human gene expression reveals gene interactions and functions
Abstract 30 Introduction 31 Results 32
Gene coexpression network 32
Properties of human gene coexpression networks in B cells 34
Biological processes in B cells 36
Predicting gene functions using coexpression networks 37 Predicting the functions of genes implicated in GWAS 40
Human gene coexpression website 43
Discussion 43 Methods 46
Samples and gene expression measurements 46
Gene correlation and construction of the coexpression network 47
Random gene pairs and networks 48
Enrichment analysis 48
Co-occurrence of biological processes 49
Tunicamycin treatment 49
Databases 50
Chapter 2: Genome-wide study of human gene relationships at baseline and upon stress
vii • Coexpression between genes does not differ significantly upon ER
stress
76
• Coexpression between genes does not differ significantly upon IR stress 77 • Examining whether subnetworks of genes change expression as expected upon
stress 78
• Upon ER stress, the majority of neighbors in a subnetwork change
expression as expected based on baseline correlations 81 • Upon IR stress, the majority of neighbors in a subnetwork change
expression as expected based on baseline correlations
82
• Analysis of genes with altered relationships 83
• Using machine learning to model relationships between genes 84
• Testing SVMs and setting parameters 86
• Most genes maintain relationships with other genes, but those with altered relationships tend to play critical roles in the ER stress response
87
• Most genes maintain relationships with other genes, but those with altered relationships tend to play critical roles in the IR stress response
90
• Learned weights suggest new relationships between genes 93 • SVM weights recapitulate the role of GADD45A in cell death and cell
cycle control 94
• SVM weights recaptiulate relationships between GADD45A and other
genes upon IR stress 95
• SVM weights suggest GADD45A is related to INHBE and SLC3A2 and provide insight into their functions
96
• Estimates of extent to which relationships change upon stress 98 Discussion 99 Methods 104
Cells and gene expression experiments 104
Tunicamycin treatment 104
Ionizing radiation treatment 105
Gene correlation and construction of coexpression networks 105
Random networks 106
Significance testing 106
Caspase assays 107
Machine learning using support vector machines 107
Enrichment analysis 108
viii
Chapter 3: The role of INHBE in the endoplasmic reticulum stress response
Introduction 178 Results 179 • INHBE is correlated in expression with TGF-β pathway members and genes
involved in apoptosis 179
• INHBE mRNA levels are induced in primary fibroblasts undergoing ER stress 180 • Characterization of the ER stress response in primary fibroblasts 181 • Preliminary evidence that siRNA knockdown of INHBE attenuates the ER
stress response 183
Future Directions 184
Methods 185
Cells 185
Tunicamycin treatment 185
Western blot 185
qRT-PCR 185
siRNA knockdown 186
Transmission electron microscopy 186
Summary, Discussion and Future Directions 201
Concluding Remarks 211
Appendix
Supplementary Table 1.1: Gene pairs whose correlations in gene expression
levels differ significantly (Pcorrected<0.05) among the 3 datasets
215
Supplementary Table 1.2: Gene pairs that are correlated in gene expression
levels with |r|>0.5 and are found within 500 kb of each other. 393
Supplementary Table 1.3: Predicted functions of poorly characterized genes
based on the functions of neighboring genes. 395
Supplementary Figure 1.1: Genes identified in genome-wide association studies
and their neighbors in the network 397
Supplementary Table 2.1: Changes in gene expression levels induced by
tunicamycin (ER stress) 425
Supplementary Table 2.2: Changes in gene expression levels induced by ionizing
radiation 2 and 6 hours after treatment 551
Supplementary Table 2.3: Gene pairs which are differentially coexpressed
(Fisher's test of homogeneity) 651
Supplementary Table 2.4: Properties of coexpression networks using different
correlation thresholds 656
Supplementary Table 2.5: Fraction of neighbors that change expression as
expected upon stress. 658
ix LIST OF TABLES
Table 1.1: Properties of networks using different correlation thresholds. 59
Table 1.2: Biological processes active in B cells. 60
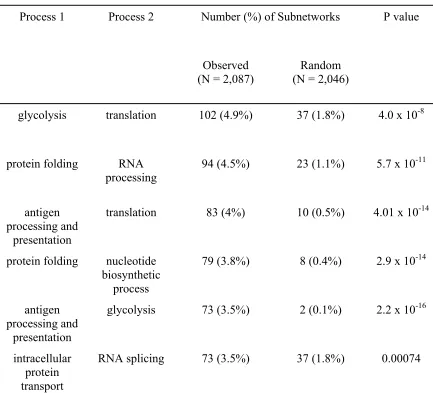
Table 1.3: Biological processes that frequently co-occur within subnetworks. 61
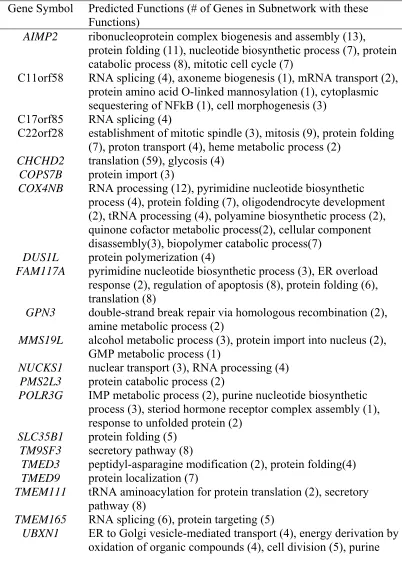
Table 1.4: Predicted functions of poorly characterized genes based on the
functions of their neighboring genes. 62
Table 2.1: Genes that alter their relationships upon tunicamycin treatment. 122
Table 2.2: Genes that alter their relationships upon ionizing radiation treatment 131
Table 2.3: Genes with most positive SVM weights for GADD45A at 0 hours 141
Table 2.4:Genes with most negative SVM weights for GADD45A at 0 hours 146
Table 2.5: Genes with most positive SVM weights for GADD45A at 6 hours 151
Table 2.6: Genes with most negative SVM weights for GADD45A at 6 hours 156
Table 2.7. Genes that show altered relationships in two out of three methods 161
Table 3.1: Genes that are correlated with INHBE in tunicamycin treated
individuals. 197
x
LIST OF FIGURES
Figure 0.1: Many human genes have few publications associated with them in
PubMed. 22
Figure 1.1: Examples of gene pairs that are significantly and reproducibly
correlated. 52
Figure 1.2: Coexpression network where connections are placed between genes
that are correlated at |r| > 0.50. 53
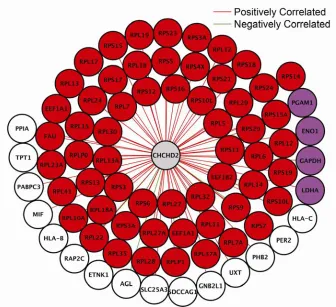
Figure 1.3: CHCHD2 Subnetwork. 54
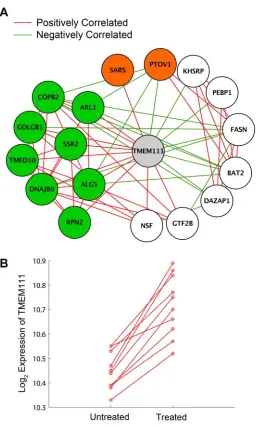
Figure 1.4: TMEM111 Subnetwork. 55
Figure 1.5: TRAF1 and HMGCR Subnetworks. 56
Figure 1.6: IFIH1 and B3GALT4 Subnetworks 58
Figure 2.1: CCNB1IP1 increases six hours after exposure to ionizing radiation. 110
Figure 2.2: Distribution of expression changes upon stress. 111
Figure 2.3: Correlation in expression levels before and after stress. 112
Figure 2.4: Distribution of correlation coefficients between all pairwise
combinations of genes. 114
Figure 2.5: Distribution of connections per gene in coexpression networks
|r|>0.50. 115
Figure 2.6: Stress-induced changes in gene expression are consistent with
coexpression relationships observed at baseline. 116
Figure 2.7: Performance of SVMs on unstressed and stressed samples. 118
Figure 2.8: Expression and modeling of DDIT3 and THAP1 upon ER stress. 119
Figure 2.9: Expression and modeling of CDK8, GADD45A and VEGFA upon IR
stress. 120
Figure 2.10: INHBE and SLC3A2 are associated with cell death. 121
Figure 3.1: Genes correlated with INHBE expression levels in
tunicamycin-treated samples of immortalized B cells from 131 individuals (|r|>0.50). 187
Figure 3.2: XBP1 splicing in primary fibroblasts treated with tunicamycin. 188
Figure 3.3: Primary human fibroblast upregulate the expression of INHBE
following 2, 4 and 8 hours of tunicamycin treatment 189
Figure 3.4: Time course of ER stress response activation in primary fibroblasts. 190
Figure 3.5: Transmission electron microscopy image of fibroblast treated with
DMSO for 8 hours. 191
Figure 3.6: Transmission electron microscopy image of fibroblast treated with
tunicamycin for 8 hours showing double-membraned vesicle. 192
Figure 3.7: Transmission electron microscopy image of fibroblast treated with
xi Figure 3.8: Transmission electron microscopy image of fibroblast treated with
DMSO for 24 hours. 194
Figure 3.9: Transmission electron microscopy image of fibroblast treated with
tunicamycin for 24 hours. 195
Figure 3.10: siRNA knockdown of INHBE attenuates the induction of BIP, ATF4
and CHOP 4 hours after tunicamycin treatment. 196
Figure 4.1: Two genes do not change expression upon stress but do alter
1 INTRODUCTION
Development of “omics” biology and the deluge of data
Living cells consist of thousands of components working in concert to orchestrate
diverse processes. Researchers aim to identify these components and understand how
they work together. The former aim has been aided by the development of new
technologies. DNA sequencing technology has provided a catalogue of the ~20,000
genes present in humans (Lander et al. 2001). RNA sequencing (Mortazavi et al. 2008)
and microarray technologies (Schena et al. 1995) measure the abundance of thousands of
transcripts simultaneously and tell us which genes are expressed in different tissues or
conditions. Proteomic technologies (Gstaiger and Aebersold 2009), such as mass
spectrometry, measure the protein abundance (Pandey and Mann 2000) and
post-translational modifications (Kang et al. 2008; Matsuoka et al. 2007) of hundreds of genes
at a time, though this technology is still in its infancy. These are exciting times because
we have a more complete picture of the components that constitute biological systems
than ever before.
However, these technological advances reveal gaping holes in our knowledge of
biological systems. The functions of many human genes are unknown; even the
functions of genes in tractable organisms, like yeast, are incompletely characterized
(Sharan et al. 2007). The functions of new types of RNA molecules, such as long
studies have similarly produced unexpected insights into protein modifications (Kang et
al. 2008), but leave many questions regarding the functions of these modifications.
Furthermore, insight into how these “parts” (i.e. DNA, RNA and protein) work
together to give rise to the remarkable system of a living cell is incompletely understood.
Much of our current knowledge focuses on small subsets of genes and pathways that are
well characterized. This is because, as a community, we tend to study genes and protein
that have been studied before (Pfeiffer and Hoffmann 2007). Thus, we lack information
on how pathways influence each other. This knowledge is critical in clinical settings,
where we know little about how the cellular machinery goes awry and what can be done
to remedy such pathologies.
Motivation for network-based analysis of biological systems
The deluge of data and the need to understand how cellular components work
together have led researchers to develop computational tools and models to
systematically analyze large datasets; networks are one such tool (Barabasi and Oltvai
2004). Networks (or graphs) provide an intuitive representation of relationships that exist
between molecular components. Additionally, the fields of graph theory and machine
learning have provided a set of tools to study large networks and their properties, to
3
networks of human genes, and how these networks change, are the main focus of this
dissertation.
Networks are attractive models of biological systems because genes do not work
in isolation but rather in the context of molecular networks. Compelling evidence comes
from humans, where mutations in genes participating in the same protein complexes lead
to similar diseases (Lim et al. 2006). This suggests that genes work coordinately to
orchestrate cellular processes. Additional evidence comes from studies on double
mutants in yeast. For example, two genes are synthetic lethal when mutation of either
one alone does not cause death but when mutation of both does (Bender and Pringle
1991). Genes that are synthetically lethal tend to be involved in similar pathways or
complexes, implying that genes influence each other (Boone et al. 2007). Sometimes, the
roles of genes in specific processes can only be discerned by studying them in the context
of other genes: a screen examining double mutants in yeast uncovered functional
dependencies between genes in the unfolded protein response (Jonikas et al. 2009) and
implicated many genes that were previously unexplored. These studies illustrate that
genes act in networks and their functions can be learned by studying them in the context
of other genes.
Network biology: state of the art
in multiple organisms (Zhu et al. 2007). In this dissertation, I study human gene
coexpression networks, and describe a select few below for comparison.
Coexpression networks: Coexpression networks represent genes that are correlated in
expression across different samples. They are used to identify genes that are coordinately
regulated or perform similar functions (Eisen et al. 1998). To construct networks, the
Pearson correlation coefficient is typically used to quantify coexpression, and genes
which are strongly correlated are connected (Stuart et al. 2003). One limitation is that
some correlations can be artifacts or arise from confounders. This can be addressed
partially by identifying reproducible correlations across several datasets (Lee et al. 2004;
Stuart et al. 2003). The relative ease and speed with which expression levels can be
measured across a large number of genes and conditions makes coexpression networks a
feasible genome-wide method of examining relationships among many genes (e.g. in
comparison to protein-protein interactions). Additionally, advances in microarray
technologies have led to improvements in the quality of expression measurements (Ness
2007), and a spectrum of genes can be studied because gene-specific reagents are not
required. Similar types of networks include relevance networks (Butte and Kohane
2000), mutual information networks (Basso et al. 2005), and others (Zhang and Horvath
2005). These all share the common property that they are mainly constructed using
5 Protein-protein interaction networks: Protein-protein interaction networks (PPIs)
represent proteins that physically interact (Ito et al. 2001; Rual et al. 2005; Stelzl et al.
2005; Uetz et al. 2000). Protein interaction is determined by yeast-2-hybrid (Y2H)
assays or affinity purification-mass spectrometry (AP-MS) (Bork et al. 2004). One
limitation of the yeast-2-hybrid approach is that interactions are identified outside of their
normal context (i.e. interactions between human proteins are tested within yeast cells).
While AP-MS can reveal context-dependent interactions, purification of protein
complexes are required, so many interactions are missed. Thus, multiple methods of
identifying protein-protein interactions are required to query all possible interactions (Yu
et al. 2008). Currently, identification of all combinations of protein-protein interactions
in humans is time- and labor-intensive and remains a difficult enterprise (Alexander et al.
2009).
Genetic interaction networks: Genetic interaction networks represent pairs of genes
which, when mutated, influence a specific phenotype of interest (Boone et al. 2007;
Jonikas et al. 2009). For example, synthetic genetic array analysis is a high-throughput
method developed to generate genetic interaction networks (Tong et al. 2001). These
studies are primarily done in yeast, where mutant genes can easily be introduced into
cells and examined for their effect on growth (Boone et al. 2007). This type of study is
difficult in human because there are no high-throughput methods to delete pairs of human
genes. It is conceivable to knockdown pairs of genes using siRNA libraries, but such
(Boutros and Ahringer 2008). To my knowledge, no study has examined pairwise
combinations of knockdowns of human genes to uncover a human genetic interaction
network.
Transcription factor regulatory networks: Transcription factor regulatory networks
represent transcription factors that physically bind genomic DNA and directly regulate
gene expression. Chromatin immunoprecipitation (Blais and Dynlacht 2005) (ChIP) or
DamID (Vogel et al. 2007) is followed by microarray or next-generation sequencing
(Johnson et al. 2007) to identify transcription factor binding sites. This is combined with
expression profiling to determine whether a binding event also corresponds to altered
expression of the target. These networks are “directed” because the transcription factor
causally regulates the expression levels of its targets. Only one or a few transcription
factors are examined in a given study since a large amount of cellular material and
transcription factor-specific reagents are required.
Gene regulatory networks: Regulatory networks represent causal regulatory
relationships between genes, where one gene regulates the expression of another (these
are “directed” networks). This is a more generalized version of a transcription factor
regulatory network, where regulators include other genes in addition to transcription
factors. Investigators have inferred gene regulatory networks using a combination of
gene expression levels, presence of transcription factor binding motifs, siRNA-based
7
mutants) of the putative regulator (Amit et al. 2009; Bonneau et al. 2007; Oliveri et al.
2008). Many of these studies have been done in model organisms, focusing on specific
processes and pathways. Arguably, the most impressive of these gene regulatory
networks represents specification of the endoderm and mesoderm in sea urchins (Oliveri
et al. 2008). This wiring diagram, which includes 40 transcription factors, was
discovered over the course of six years, attesting to the time and labor required for the
careful dissection of a gene regulatory network.
Additional types of networks include metabolic networks (Duarte et al. 2004;
Forster et al. 2003; Jeong et al. 2000), co-citation and literature-based networks (Jenssen
et al. 2001), protein modification networks (Kang et al. 2008; Matsuoka et al. 2007), and
networks based on combining naturally-occurring genetic perturbations and gene
expression (Chen et al. 2008; Emilsson et al. 2008; Zhu et al. 2008).
Motivation for studying human biology using gene coexpression networks
Here, I examined coexpression networks because they enabled me to study a wide
spectrum of genes across multiple conditions in human cells. By studying genes in the
context of gene networks, I was able to learn about functions of human genes (Chapter
1), their relationships to each other (Chapter 1), and how these relationships change upon
stress (Chapter 2). Studying human genes provided insight into possible mechanisms of
human diseases, and to allowed me to propose a hypothesis for a poorly-characterized
datasets. This was a consequence of the fact that our lab is interested in the genetic basis
of variation in human gene expression; thus, I was equipped to exploit genetic variation
to identify relationships between genes using large sample sizes. I examined data from
~100+ samples growing at baseline or under stressed conditions. Thus, I was well-poised
to ask questions that have not been explored before.
Coexpression networks provide insight into gene functions and gene interactions
Since the major focus of this thesis is on human gene coexpression networks and
how they reveal gene functions and altered relationships, I describe studies that highlight
insights from network-based analyses of gene expression.
Coexpression networks provide insight into gene function. This was first
demonstrated by Stuart et al. (Stuart et al. 2003). These investigators studied four
evolutionary diverse organisms: humans, flies, worms and yeast. Using gene expression
levels measured under varying conditions by microarrays, they calculated correlation in
expression levels for all pairwise combinations of genes. A network was assembled from
coexpression patterns that were conserved across four organisms. In this network, genes
involved in similar processes were found to be connected to each other. Stuart et al. then
examined poorly-characterized genes, inferred the functions of these genes based on their
neighbors in the network, and validated these predictions using siRNA experiments. This
study demonstrated the utility of using a “guilt-by-association” approach to determine
9
Additionally, coexpression networks provide insight into altered interactions.
Investigators have compared coexpression networks from different species to identify
species-specific gene relationships (Bergmann et al. 2004). For example, Oldham et al.
(Oldham et al. 2006) compare coexpression networks in human and chimpanzee brains in
order to identify genes with altered interactions. They find that coexpression patterns in
the cerebral cortex are less conserved in chimps and posit that these different
relationships are the drivers of evolutionary change. Investigators have also compared
networks from normal and diseased tissue to identify genes with altered relationships in
cancer tissues (Carter et al. 2004; Choi et al. 2005). Thus, comparison of gene
coexpression networks can provide insight into how interactions between genes are
altered under different conditions, as well as insight into human disease.
Limitations of coexpression network analysis
There are limitations to what can be learned from coexpression network analysis.
For example, the functions of some genes are not reflected in their mRNA levels or in the
mRNA levels of other genes; these genes will not be represented in the coexpression
network. Thus, coexpression networks are incomplete. Additionally, they are an abstract
representation of the molecular networks that operate within cells. Perhaps most
unsatisfying is that coexpression networks do not provide insight into the mechanisms
that give rise to the observed correlations nor do they identify causal regulatory
human genes (Figure 0.1, number of Pubmed articles for each human gene). And, the
literature has demonstrated that coexpression relationships have proved useful in learning
about genes (Stuart et al. 2003; Wolfe et al. 2005) and in providing a basis for additional
studies (Hagberg et al. 2010). Thus, given the lack of knowledge on the functions and
interactions of many human genes, as most recently acknowledged in genome-wide
association studies (Hirschhorn 2009), I considered it worthwhile to undertake the study
of human gene coexpression networks using uniquely large datasets in this dissertation.
Static versus dynamic networks
We know that biological networks change, but current methods of studying
networks imply fixed, unchanging relationships between genes. This is partly because
studying dynamics is difficult for many of the networks described above. For example,
studies of coexpression networks pool heterogeneous data together in order to use
variation in expression that arises from environmental perturbations. This makes it
difficult to determine whether coexpression patterns change. There have been only a few
studies examining if and how relationships between genes are altered in disease states or
across species (Bergmann et al. 2004; Choi et al. 2005; de la Fuente 2010; Oldham et al.
2006).
To my knowledge, no studies have prospectively examined the effect of stress on
11
clear that some gene relationships are rewired in response to stress or upon development,
the extent to gene networks change has not be examined. In Chapter 2 of this
dissertation, I address some of these questions by studying how human coexpression
networks change in response to 2 types of stresses: endoplasmic reticulum (ER) stress
and stress induced by ionizing radiation (IR). In studying these stresses, I use support
vector machines, a machine learning algorithm, to examine relationships between genes
and further explore genes with altered relationships.
Motivation for using support vector machines to examine relationships between genes
Support vector machines (SVM) are a set of supervised machine learning
algorithms used to identify patterns or relationships in large datasets (Boser et al. 1992).
SVMs are valued for their ability to generalize well to unseen data (Smola and Schölkopf
2004). Here, I use support vector machine regression (Drucker et al. 1997; Müller et al.
1997) in order to identify relationships between genes using expression levels from
unrelated individuals. Specifically, I use SVM regression to estimate a function which
predicts the expression of a given (“target”) gene using the expression of all other genes
(“predictor genes”). The SVM algorithm assigns a weight to each predictor gene, and the
relationships between the target gene and predictor genes are captured by these weights
(Ahmed and Xing 2009). I consider this to be a modified form of a coexpression network
since the primary method of examining relationships between genes is based on
SVM model
Suppose that we have training data {(x1, y1), (x2, y2)…,(xN,yN)}, where xi
represents a vector of gene expression levels (e.g., xi=[gi1, gi2,…gip], where p is the
number of predictor genes), yi represents the expression of a target gene, and N represents
the number of individuals in the training set. The SVM linear regression algorithm
estimates the function:
y = w·x + b
, where w is a vector representing the weights (a set of real numbers), b represents the
bias term (a real number) and w·x is the dot product between w and x (the sum of the
products of pairs of entries in w and x) (Smola and Schölkopf 2004). This is similar to a
traditional squares fit multivariate linear regression model. However, in a
least-squares fit linear regression, the sum of the squared error between the model prediction
and the training sample is minimized, leading to overfitting on the training data for
high-dimensional datasets. In contrast, in SVM linear regression, the following loss function
is minimized:
0 if |ξ| ≤ε
|ξ|ε =
|ξ| - ε otherwise
, where ε represents the amount of error that is tolerated on the training data, and ξ
represents the deviation of a training sample from the model prediction. In essence, the
13
predictions on the training samples, but avoids larger errors (represented by ξ) and
penalizes on these larger errors with a cost of |ξ| - ε. This is referred to as
“epsilon-insensitive loss.”
Additional constraints are also used to estimate the linear function. One
constraint is to minimize the complexity of the function, which is achieved by
minimizing ||w||2, or the square root of the sum of the squares of each entry in w (also
called the L2 norm). A second constraint specifies the degree to which large errors are
tolerated (specified by parameter C>0). This is represented as follows (some details
excluded for the sake of clarity):
N Minimize ||w||2 + C Σi=1 (|ξ|ε)i
In minimizing model complexity and using an epsilon-insensitive loss function,
SVMs avoid overfitting on the training data. Details on implementation (using convex
optimization) are beyond the scope of this dissertation. However, these details and a
further discussion of SVM regression can be found in Smola et al (2004).
SVMs can be used to examine non-linear relationships in the data. The input data
can be mapped (transformed) to a higher dimensional feature space, and a linear model
can be learned in this feature space. SVMs use “kernel” functions in order to achieve
this. Here, we found that employing kernel functions on gene expression data led to
worse performance of SVM models (further described in Chapter 2). Thus, we did not
Motivation for using SVMs over other learning methods
Because we do not use kernel functions in our SVM modeling, it is reasonable to
consider alternative statistical or machine learning models for our purposes. Alternative
models include traditional linear regression models and LASSO. At first, we used
least-squares fit linear regression models and found that these indeed overfit on the training
data (further described in Chapter 2), likely because of the large number of predictor
variables and the relatively small number of training samples. We found that SVM
performance far exceeded that of least-squares fit linear regression (see Chapter 2).
We considered the possibility of using LASSO, but reasoned that doing so would
complicate the interpretation of relationships between genes. LASSO is an algorithm that
estimates a linear model with the primary aim of shrinking weights on predictor variables
down to 0 (Tibshirani 1996). This is achieved by minimizing ||w||1, or the sum of the
absolute values of each entry in w (also called the L1 norm). The main motivation for
using LASSO is to identify a subset of predictor variables that are most useful in making
predictions; selecting a subset of predictors also facilitates interpretation of the resulting
model. If we used LASSO here, some genes would have weights of 0 in predicting the
expression of a target gene; these genes would essentially be excluded from the model.
Thus, we did not use LASSO because we wanted to examine the relationship of the target
gene to all other genes, not just a subset of genes. Additionally, we wanted to examine
15
GADD45A example in Chapter 2). Such an analysis would be complicated by use of the
LASSO model, in which some predictor genes would be included and others would be
excluded. However, it will be interesting to examine LASSO in future studies for the
reasons described above.
In summary, the key reasons we chose SVMs to model relationships between
genes is to (1) develop models that generalize to unseen data and (2) examine the
relationships between a gene and all other genes and how these relationships change upon
stress.
Significance of examining of ER and IR stress
Endoplasmic reticulum stress
The endoplasmic reticulum is an organelle that is the site of synthesis of proteins
that are destined to be secreted or inserted into the plasma membrane (Schroder and
Kaufman 2005). The lumen of the ER provides an environment where proteins are
modified and fold properly before being transported to other parts of the cell. The ER
can be a specialized organelle in specific cell types. For example, in B cells, it
participates in antigen presentation (Rock and Goldberg 1999) and antibody production
(Zhang et al. 2005); in β-pancreatic cells, it is critical for insulin secretion (Harding et al.
proteins (Prockop et al. 1979). Thus, the ER can play diverse and critical roles in normal
cellular processes (Schroder and Kaufman 2005).
ER stress results when the demand on the ER exceeds its capacity. Cells respond
by synthesizing more ER and expanding ER size, decreasing input to the ER by reducing
protein production, and removing existing protein from within the ER (termed
ER-associated degradation) (Schroder and Kaufman 2005). When these efforts fail, cells die
(Kaufman 1999). Sustained ER stress has been implicated in diabetes,
neurodegeneration, cancer, stroke and ischemia (Kim et al. 2008). An improved
understanding of the critical players in the response to ER stress may be useful in
delaying or reversing the pathological changes that occur in these diseases.
Given its critical role in normal physiology and pathology, over the past 20 years,
investigators have started to uncover the roles of genes in the ER stress response.
Common tools to study ER stress include drugs, such as tunicamycin, or chemicals that
prevent proteins from folding properly in the ER. This induces the “unfolded protein
response” (UPR) which induces ER stress. Cells initiate a signaling cascade that results
in gene expression changes that facilitate expansion of the ER and reduction of ER
protein load. The three main molecular arms of the UPR involve IRE1 (called ERN1 in
humans), PERK (called EIF2AK3 in humans), and ATF6 (Ron and Walter 2007). BIP
binds these molecules and keeps them in the inactive state. When unfolded proteins
accumulate in the ER, BIP dissociates from IRE1, PERK and ATF6 and is recruited to
17
ATF6. If these molecules fail to adapt to the stress response, then DDIT3 (also called
CHOP) is upregulated and leads to cell death (Zinszner et al. 1998). Details of the
mechanisms of these pathways have been reviewed previously (Kaufman 1999; Ron and
Walter 2007; Schroder and Kaufman 2005). Here, I study the roles of additional human
genes in the ER stress response.
Cellular response to ionizing radiation
Since the discovery of x-rays, we have known that ionizing radiation (IR) can
have many effects on humans, ranging from skin burns to radiation-induced cancer
(Gudkov and Komarova 2003). Given that humans are regularly exposed to ionizing
radiation, both from the environment (radon, cosmic rays) and man-made sources (x-rays,
radiotherapy, fallout from nuclear weapons testing) (National Council on Radiation
Protection and Measurements. 1987), there is a need to understand the molecular and
cellular responses to ionizing radiation. Such knowledge would be useful in predicting
the effects of exposing humans to ionizing radiation, and possibly modulating the effects
of IR in medical settings.
Ionizing radiation damages DNA, and thus is a mutagen and a carcinogen, as
illustrated by the studies of the atomic bomb survivors (Moloney and Kastenbaum 1955).
Therefore, studies of the cellular response to ionizing radiation have traditionally focused
response were identified by studying individuals with “genomic instability syndromes,”
such as ataxia-telangiectasia and Nijmegen breakage syndrome (O'Driscoll and Jeggo
2006). These studies reveal that genes involved in DNA damage surveillance and repair,
such as ATM and NBS1, play critical roles in the cellular response to ionizing radiation
(O'Driscoll and Jeggo 2006). These genes, along with several others (e.g. ATR, MRE11,
RAD50, CHK1, CHK2), activate a cascade of signaling and transcriptional responses in
order to repair DNA damage (Shiloh 2003; Shiloh 2006). If the damage is irreparable,
this complex network of genes (including p21, GADD45A, cyclin B1) induces cell cycle
arrest or cell death (Shiloh 2006).
In addition to DNA damage repair, other processes are also implicated in the
response to ionizing radiation, as suggested by recent studies using high-throughput
methods (Amundson et al. 1999; Jen and Cheung 2003; Matsuoka et al. 2007; Said et al.
2004; Workman et al. 2006). Changes in gene expression are critical (Elkon et al. 2005;
Shiloh 2006), and investigators have found that genes induced or repressed by IR are
involved in processes such as chromatin remodeling (Said et al. 2004), vacuole function
(Said et al. 2004), RNA metabolism (Said et al. 2004), lipid metabolism (Workman et al.
2006), stress responses (Workman et al. 2006) and metabolic pathways (Workman et al.
2006). However, many genes that are differentially expressed in response to IR have
unknown function (Jen and Cheung 2003; Said et al. 2004), suggesting that we still have
19
previous studies on human cells examining the roles of genes and their relationships in
the cellular response to ionizing radiation.
Advantages and disadvantages of using immortalized B cells
Our studies are primarily done in human immortalized B cells because they offer
many advantages. First, the immortalized B cells used in our studies are part of a
collection that has been used for various gene mapping and functional studies. They are
normal individuals in the Center d’Étude du Polymorphisme Humain (Dausset et al.
1990) (CEPH) and the International HapMap (International HapMap Consortium 2003)
collections. Second, this collection provides the natural variation in gene expression
levels that is used to identify relationships between genes. Third, for ethical reasons, we
cannot examine the effect of tunicamycin or ionzing radiation on individuals in controlled
experimental settings; however, we can examine the response of cells derived from
individuals to gain insight into human biology. The main drawback of using
immortalized B cells is that they are not primary cells. One way to address this is to
Contributions and findings of this dissertation
Here I identify human coexpression networks at baseline and examine how they
change upon stress. I take advantage of normal variation in human gene expression
levels of >4,000 genes in >95 individuals to study baseline and stressed networks.
First (Chapter 1), I identified gene coexpression relationships under baseline,
unstressed conditions, and used these relationships to learn about human gene functions
and interactions. By studying expression levels of 4,238 genes in cells from 295
individuals, I constructed human gene coexpression networks by identifying significant
and reproducible correlations in expression levels of more than 8.9 million gene pairs. I
found biological processes, such as translation and glycolysis, co-occur in the same
subnetworks. Additionally, I predicted the functions of poorly-characterized human
genes and provided supportive experimental evidence for one of these genes, TMEM111.
In the network, genes that predispose to the same disease were clustered non-randomly,
suggesting that the network may serve as a resource for identifying additional candidate
genes that influence disease susceptibility. This study showed that coexpression
relationships identified by exploiting genetic variation may provide insight into gene
functions and interactions in normal and disease processes.
In the second study (Chapter 2), I examined the extent to which relationships
between genes were altered upon exposure to two stresses. To examine endoplasmic
reticulum stress, gene expression was measured in cells from 131 individuals treated with
21
individuals were exposed to ionizing radiation and expression levels were measured
before irradiation (0 hours) and 2 and 6 hours after treatment. I found that although there
were extensive changes in the expression levels of genes induced by ER or IR stress,
network and machine learning methods suggested that the majority of gene relationships
were maintained. However, a subset of genes altered their relationships with other genes,
and these genes tended to play critical roles in the specific stress response examined.
Furthermore, some genes did not change expression level upon stress, but did alter their
interactions with other genes, providing me with an opportunity to explore aspects of the
cellular response that are unlikely to have been previously characterized.
The third study (Chapter 3) is ongoing and examines the role of a
poorly-characterized gene, INHBE, and its function in endoplasmic reticulum stress. I use gene
relationships to explore the function of this gene.
Overall, these studies offer information on the functions of human genes as
discerned from their relationships with each other and how these relationships change
23 References
Ahmed A, Xing EP. 2009. Recovering time-varying networks of dependencies in social and biological studies. Proc Natl Acad Sci U S A 106: 11878-11883.
Alexander RP, Kim PM, Emonet T, and Gerstein MB. 2009. Understanding modularity in molecular networks requires dynamics. Sci Signal2: pe44.
Amit I, Garber M, Chevrier N, Leite AP, Donner Y, Eisenhaure T, Guttman M, Grenier JK, Li W, Zuk O et al. 2009. Unbiased reconstruction of a mammalian
transcriptional network mediating pathogen responses. Science326: 257-263.
Amundson SA, Bittner M, Chen Y, Trent J, Meltzer P, and Fornace AJ, Jr. 1999.
Fluorescent cDNA microarray hybridization reveals complexity and heterogeneity of cellular genotoxic stress responses. Oncogene18: 3666-3672.
Barabasi AL and Oltvai ZN. 2004. Network biology: understanding the cell's functional organization. Nat Rev Genet5: 101-113.
Basso K, Margolin AA, Stolovitzky G, Klein U, Dalla-Favera R, and Califano A. 2005. Reverse engineering of regulatory networks in human B cells. Nat Genet37: 382-390.
Bender A and Pringle JR. 1991. Use of a screen for synthetic lethal and multicopy suppressee mutants to identify two new genes involved in morphogenesis in Saccharomyces cerevisiae. Mol Cell Biol11: 1295-1305.
Bergmann S, Ihmels J, and Barkai N. 2004. Similarities and differences in genome-wide expression data of six organisms. PLoS Biol2: E9.
Blais A and Dynlacht BD. 2005. Constructing transcriptional regulatory networks. Genes Dev19: 1499-1511.
Bonneau R, Facciotti MT, Reiss DJ, Schmid AK, Pan M, Kaur A, Thorsson V, Shannon P, Johnson MH, Bare JC et al. 2007. A predictive model for transcriptional control of physiology in a free living cell. Cell131: 1354-1365.
Boone C, Bussey H, and Andrews BJ. 2007. Exploring genetic interactions and networks with yeast. Nat Rev Genet8: 437-449.
Boser BE, Guyon IM, Vapnik VN. 1992. A training algorithm for optimal margin classifiers. Proceedings of the fifth annual workshop on Computational learning theory: 144-152.
Boutros M and Ahringer J. 2008. The art and design of genetic screens: RNA interference. Nat Rev Genet9: 554-566.
Butte AJ and Kohane IS. 2000. Mutual information relevance networks: functional genomic clustering using pairwise entropy measurements. Pac Symp Biocomput: 418-429.
Carter SL, Brechbuhler CM, Griffin M, and Bond AT. 2004. Gene co-expression network topology provides a framework for molecular characterization of cellular state. Bioinformatics20: 2242-2250.
Chen Y, Zhu J, Lum PY, Yang X, Pinto S, MacNeil DJ, Zhang C, Lamb J, Edwards S, Sieberts SK et al. 2008. Variations in DNA elucidate molecular networks that cause disease. Nature452: 429-435.
Choi JK, Yu U, Yoo OJ, and Kim S. 2005. Differential coexpression analysis using microarray data and its application to human cancer. Bioinformatics21: 4348-4355.
Dausset J, Cann H, Cohen D, Lathrop M, Lalouel JM, and White R. 1990. Centre d'etude du polymorphisme humain (CEPH): collaborative genetic mapping of the human genome. Genomics6: 575-577.
Drucker H, Burges CJC, Kaufman L, Smola A, Vapnik V. 1997. Support vector regression machines. Advances in neural information processing systems: 155-161.
de la Fuente A. 2010. From 'differential expression' to 'differential networking' -
identification of dysfunctional regulatory networks in diseases. Trends Genet26: 326-333.
Duarte NC, Herrgard MJ, and Palsson BO. 2004. Reconstruction and validation of Saccharomyces cerevisiae iND750, a fully compartmentalized genome-scale metabolic model. Genome Res14: 1298-1309.
25
Elkon R, Rashi-Elkeles S, Lerenthal Y, Linhart C, Tenne T, Amariglio N, Rechavi G, Shamir R, and Shiloh Y. 2005. Dissection of a DNA-damage-induced
transcriptional network using a combination of microarrays, RNA interference and computational promoter analysis. Genome biology6: R43.
Emilsson V, Thorleifsson G, Zhang B, Leonardson AS, Zink F, Zhu J, Carlson S, Helgason A, Walters GB, Gunnarsdottir S et al. 2008. Genetics of gene expression and its effect on disease. Nature452: 423-428.
Forster J, Famili I, Fu P, Palsson BO, and Nielsen J. 2003. Genome-scale reconstruction of the Saccharomyces cerevisiae metabolic network. Genome Res13: 244-253.
Gstaiger M and Aebersold R. 2009. Applying mass spectrometry-based proteomics to genetics, genomics and network biology. Nat Rev Genet10: 617-627.
Gudkov AV and Komarova EA. 2003. The role of p53 in determining sensitivity to radiotherapy. Nature reviews3: 117-129.
Hagberg CE, Falkevall A, Wang X, Larsson E, Huusko J, Nilsson I, van Meeteren LA, Samen E, Lu L, Vanwildemeersch M et al. 2010. Vascular endothelial growth factor B controls endothelial fatty acid uptake. Nature464: 917-921.
Harding HP, Zeng H, Zhang Y, Jungries R, Chung P, Plesken H, Sabatini DD, and Ron D. 2001. Diabetes mellitus and exocrine pancreatic dysfunction in perk-/- mice reveals a role for translational control in secretory cell survival. Molecular cell7: 1153-1163.
Hirschhorn JN. 2009. Genomewide association studies--illuminating biologic pathways. N Engl J Med360: 1699-1701.
International HapMap Consortium. 2003. The International HapMap Project. Nature426: 789-796.
Ito T, Chiba T, Ozawa R, Yoshida M, Hattori M, and Sakaki Y. 2001. A comprehensive two-hybrid analysis to explore the yeast protein interactome. Proc Natl Acad Sci U S A98: 4569-4574.
Jenssen TK, Laegreid A, Komorowski J, and Hovig E. 2001. A literature network of human genes for high-throughput analysis of gene expression. Nature Genet.28: 21-28.
Jeong H, Tombor B, Albert R, Oltvai ZN, and Barabasi AL. 2000. The large-scale organization of metabolic networks. Nature407: 651-654.
Johnson DS, Mortazavi A, Myers RM, and Wold B. 2007. Genome-wide mapping of in vivo protein-DNA interactions. Science316: 1497-1502.
Jonikas MC, Collins SR, Denic V, Oh E, Quan EM, Schmid V, Weibezahn J, Schwappach B, Walter P, Weissman JS et al. 2009. Comprehensive characterization of genes required for protein folding in the endoplasmic reticulum. Science323: 1693-1697.
Kang R, Wan J, Arstikaitis P, Takahashi H, Huang K, Bailey AO, Thompson JX, Roth AF, Drisdel RC, Mastro R et al. 2008. Neural palmitoyl-proteomics reveals dynamic synaptic palmitoylation. Nature456: 904-909.
Kaufman RJ. 1999. Stress signaling from the lumen of the endoplasmic reticulum: coordination of gene transcriptional and translational controls. Genes Dev13: 1211-1233.
Kim I, Xu W, and Reed JC. 2008. Cell death and endoplasmic reticulum stress: disease relevance and therapeutic opportunities. Nat Rev Drug Discov7: 1013-1030.
Lander ES Linton LM Birren B Nusbaum C Zody MC Baldwin J Devon K Dewar K Doyle M FitzHugh W et al. 2001. Initial sequencing and analysis of the human genome. Nature409: 860-921.
Lee HK, Hsu AK, Sajdak J, Qin J, and Pavlidis P. 2004. Coexpression analysis of human genes across many microarray data sets. Genome Res14: 1085-1094.
Lim J, Hao T, Shaw C, Patel AJ, Szabo G, Rual JF, Fisk CJ, Li N, Smolyar A, Hill DE et al. 2006. A protein-protein interaction network for human inherited ataxias and disorders of Purkinje cell degeneration. Cell125: 801-814.
27
Mercer TR, Dinger ME, and Mattick JS. 2009. Long non-coding RNAs: insights into functions. Nat Rev Genet10: 155-159.
Moloney WC and Kastenbaum MA. 1955. Leukemogenic effects of ionizing radiation on atomic bomb survivors in Hiroshima City. Science121: 308-309.
Mortazavi A, Williams BA, McCue K, Schaeffer L, and Wold B. 2008. Mapping and quantifying mammalian transcriptomes by RNA-Seq. Nat Methods5: 621-628.
Müller K, Smola A, Rätsch G, Schölkopf B, Kohlmorgen J, Vapnik V. 1997. Predicting time series with support vector machines. Artificial Neural Networks—ICANN'97: 999-1004.
National Council on Radiation Protection and Measurements. 1987. Ionizing radiation exposure of the population of the United States : recommendations of the National Council on Radiation Protection and Measurements. The Council, Bethesda, MD.
Ness SA. 2007. Microarray analysis: basic strategies for successful experiments. Mol Biotechnol36: 205-219.
O'Driscoll M and Jeggo PA. 2006. The role of double-strand break repair - insights from human genetics. Nat Rev Genet7: 45-54.
Oldham MC, Horvath S, and Geschwind DH. 2006. Conservation and evolution of gene coexpression networks in human and chimpanzee brains. Proc Natl Acad Sci U S A103: 17973-17978.
Oliveri P, Tu Q, and Davidson EH. 2008. Global regulatory logic for specification of an embryonic cell lineage. Proc Natl Acad Sci U S A105: 5955-5962.
Pandey A and Mann M. 2000. Proteomics to study genes and genomes. Nature405: 837-846.
Pfeiffer T and Hoffmann R. 2007. Temporal patterns of genes in scientific publications. Proc Natl Acad Sci U S A104: 12052-12056.
Prockop DJ, Kivirikko KI, Tuderman L, and Guzman NA. 1979. The biosynthesis of collagen and its disorders: Part one, pp. 13-23.
Ron D and Walter P. 2007. Signal integration in the endoplasmic reticulum unfolded protein response. Nat Rev Mol Cell Biol8: 519-529.
Rual JF, Venkatesan K, Hao T, Hirozane-Kishikawa T, Dricot A, Li N, Berriz GF, Gibbons FD, Dreze M, Ayivi-Guedehoussou N et al. 2005. Towards a proteome-scale map of the human protein-protein interaction network. Nature437: 1173-1178.
Said MR, Begley TJ, Oppenheim AV, Lauffenburger DA, and Samson LD. 2004. Global network analysis of phenotypic effects: protein networks and toxicity modulation in Saccharomyces cerevisiae. Proc Natl Acad Sci U S A101: 18006-18011.
Schena M, Shalon D, Davis RW, and Brown PO. 1995. Quantitative monitoring of gene expression patterns with a complementary DNA microarray. Science270: 467-470.
Schroder M and Kaufman RJ. 2005. The mammalian unfolded protein response. Annu Rev Biochem74: 739-789.
Sharan R, Ulitsky I, and Shamir R. 2007. Network-based prediction of protein function. Mol Syst Biol3: 88.
Shiloh Y. 2003. ATM and related protein kinases: safeguarding genome integrity. Nature reviews3: 155-168.
Shiloh Y. 2006. The ATM-mediated DNA-damage response: taking shape. Trends in biochemical sciences31: 402-410.
Smola AJ, Schölkopf B. 2004. A tutorial on support vector regression. Statistics and Computing14: 199-222.
Stelzl U, Worm U, Lalowski M, Haenig C, Brembeck FH, Goehler H, Stroedicke M, Zenkner M, Schoenherr A, Koeppen S et al. 2005. A human protein-protein interaction network: a resource for annotating the proteome. Cell122: 957-968.
Stuart JM, Segal E, Koller D, and Kim SK. 2003. A gene-coexpression network for global discovery of conserved genetic modules. Science302: 249-255.
29
Tong AH, Evangelista M, Parsons AB, Xu H, Bader GD, Page N, Robinson M,
Raghibizadeh S, Hogue CW, Bussey H et al. 2001. Systematic genetic analysis with ordered arrays of yeast deletion mutants. Science294: 2364-2368.
Uetz P, Giot L, Cagney G, Mansfield TA, Judson RS, Knight JR, Lockshon D, Narayan V, Srinivasan M, Pochart P et al. 2000. A comprehensive analysis of protein-protein interactions in Saccharomyces cerevisiae. Nature403: 623-627.
Vogel MJ, Peric-Hupkes D, and van Steensel B. 2007. Detection of in vivo protein-DNA interactions using DamID in mammalian cells. Nat Protoc2: 1467-1478.
Wolfe CJ, Kohane IS, and Butte AJ. 2005. Systematic survey reveals general
applicability of "guilt-by-association" within gene coexpression networks. BMC Bioinformatics6: 227.
Workman CT, Mak HC, McCuine S, Tagne JB, Agarwal M, Ozier O, Begley TJ, Samson LD, and Ideker T. 2006. A systems approach to mapping DNA damage response pathways. Science312: 1054-1059.
Yu H, Braun P, Yildirim MA, Lemmens I, Venkatesan K, Sahalie J, Hirozane-Kishikawa T, Gebreab F, Li N, Simonis N et al. 2008. High-quality binary protein interaction map of the yeast interactome network. Science322: 104-110.
Zhang B and Horvath S. 2005. A general framework for weighted gene co-expression network analysis. Statistical applications in genetics and molecular biology4: Article17.
Zhang K, Wong HN, Song B, Miller CN, Scheuner D, and Kaufman RJ. 2005. The unfolded protein response sensor IRE1alpha is required at 2 distinct steps in B cell lymphopoiesis. J Clin Invest115: 268-281.
Zhu J, Zhang B, Smith EN, Drees B, Brem RB, Kruglyak L, Bumgarner RE, and Schadt EE. 2008. Integrating large-scale functional genomic data to dissect the
complexity of yeast regulatory networks. Nat Genet40: 854-861.
Zhu X, Gerstein M, and Snyder M. 2007. Getting connected: analysis and principles of biological networks. Genes Dev21: 1010-1024.
CHAPTER 1
Coexpression network based on natural variation in human gene expression reveals
gene interactions and functions
Abstract
Genes interact in networks to orchestrate cellular processes. Analysis of these
networks provides insights into gene interactions and functions. Here, we took advantage
of normal variation in human gene expression to infer gene networks, which we
constructed using correlations in expression levels of over 8.9 million gene pairs in
immortalized B cells from three independent samples. The resulting networks allowed us
to infer biological processes and gene functions. Among the biological pathways, we
found processes such as translation and glycolysis that co-occur in the same subnetworks.
We predicted the functions of poorly characterized genes, including CHCHD2 and
TMEM111, and provided experimental evidence that TMEM111 is part of the
endoplasmic reticulum-associated secretory pathway. We also found that IFIH1, a
susceptibility gene of type 1 diabetes, interacts with YES1, which plays a role in glucose
transport. Furthermore, genes that predispose to the same diseases are clustered
non-randomly in the coexpression network, suggesting that networks may provide candidate
genes that influence disease susceptibility. Therefore, our analysis of gene coexpression
networks may offer information on the role of human genes in normal and disease
31
http://www.geneticsofgeneexpression.org/network/.
Introduction
The functions of many human genes are unknown. It is not unusual that when
one searches the literature on a gene, one fails to find any papers that provide information
on its biological roles. Identifying gene function is difficult, especially if no hints, such
as homologies to known genes, are available to direct the search. However, since genes
work by interacting with other genes, we may learn about their functions through their
neighboring genes (Stuart et al. 2003; Ayroles et al. 2009). Identifying gene function is
increasingly important; in the last several years, genome-wide association studies
(GWAS) have identified DNA variants that are associated with common complex
diseases. But for many of these studies, the functional links between the susceptibility
genes and the diseases are unknown.
In this study, we used correlations in expression levels of more than 8.9 million
human gene pairs in immortalized B cells from three datasets to infer gene coexpression
networks. The resulting gene networks were based on correlations between genes that
were found reproducibly in the three datasets. This provided us with gene networks in
which we had high confidence in the gene correlations. We then used the networks to
examine key biological processes and interactions among those processes in our cells.
Then, we inferred the functions of 36 human genes with no known functions and 4 genes
that have been implicated in GWAS as susceptibility genes for common human diseases,
The results from this study are available at
http://www.geneticsofgeneexpression.org/network/ which allows users to explore our
gene networks and to characterize genes of interest.
Results
Gene coexpression network
In order to construct coexpression networks, we took advantage of normal
variation in gene expression (Cheung et al. 2003) among unrelated individuals. We
measured expression levels of genes using microarrays. We focused on 4,238 genes in
immortalized B cells of 295 normal individuals in the Centre d’Étude du Polymorphisme
Humain (CEPH) (Dausset et al. 1990) and the International HapMap collections
(International HapMap Consortium 2005). These cells have been used for various gene
mapping and functional studies (Aggarwal et al. 1985; Morley et al. 2004; Stranger et al.
2007). Our samples include 148 unrelated grandparents in the CEPH-Utah pedigrees, 43
Han Chinese in Beijing (CHB), 44 Japanese in Tokyo (JPT) and 60 Yoruba in Ibadan,
Nigeria (YRI) from the International HapMap Project. Since the expression levels of
most genes are similar between the CHB and JPT samples (Spielman et al. 2007), we
combined the samples as “ASN” for this analysis, as was also done by the International
HapMap Project (International HapMap Consortium 2005). First, we analyzed gene
expression data from each population separately, and computed 3 population-specific
33
gene pair, we compared the 3 population-specific correlations using Fisher’s test of
homogeneity (Sokal and Rohlf 1995) (Fig. 1.1), and identified gene pairs that were
similarly correlated in the 3 datasets. The results showed that less than 1% of gene pairs
differed significantly (P < 0.05, Bonferroni corrected) in correlation among the three
populations (Supplementary Table 1.1); most gene pairs (> 99%) were similarly
correlated in gene expression among populations. For gene pairs whose correlations did
not differ significantly among populations, we summarized the extent of their correlations
by calculating the weighted average correlation, weighted by the number of individuals in
each population (Fig. 1.1). Among the correlated genes are ones that are known to
interact functionally. For example, BTK encodes Bruton agammaglobulinemia tyrosine
kinase (Vetrie et al. 1993) that inhibits FAS (Vassilev et al. 1999), a pro-apoptotic gene.
BTK and FAS are negatively correlated in expression in all three populations (rCEPH-Utah =
-0.52; rASN = -0.47; rYRI = -0.52; test of homogeneity P = 0.87); the weighted average
correlation is -0.51 (Fig. 1.1a). Similarly, UMPS and CTPS encode the enzymes UMP
synthase (Suttle et al. 1988) and CTP synthase (Yamauchi et al. 1990), which are
essential for the production of CTP nucleotides used in the synthesis of DNA. These two
genes are positively correlated in the three populations (rCEPH-Utah = 0.69; rASN = 0.64; rYRI
= 0.68; test of homogeneity P = 0.80), and the weighted average correlation is 0.67 (Fig
1.1b). Next, we used the weighted average correlations of our gene pairs to construct
gene coexpression networks by placing connections between genes with an average