University of Pennsylvania
ScholarlyCommons
Publicly Accessible Penn Dissertations
Summer 8-13-2010
Characterizing Connectivity in Brain Networks
Using Magnetic Resonance Imaging
Jeffrey T. Duda
University of Pennsylvania, [email protected]
Follow this and additional works at:http://repository.upenn.edu/edissertations Part of theBioimaging and Biomedical Optics Commons
Recommended Citation
Duda, Jeffrey T., "Characterizing Connectivity in Brain Networks Using Magnetic Resonance Imaging" (2010).Publicly Accessible Penn Dissertations. 191.
Characterizing Connectivity in Brain Networks Using Magnetic
Resonance Imaging
Abstract
The human brain is a system of neurons that provides great computational capacity via a complicated communication network. A complete description of this network, also known as the human connectome, is an active topic of research as it would provide invaluable knowledge to cognitive neuroscience. Historically, the study of brain connectivity has been marked by a dichotomy between structure and function. Recent advances in magnetic resonance imaging (MRI) provide a potential framework for bridging this divide and allowing for a more complete window onto brain connectivity. Here, a framework for examining structural connectivity and functional connectivity in a network is presented with a focus upon the study of well-known subnetworks. An examination of the thalamo-cortical system exhibits the ability to use multivariate MRI data to model a brain network and identify localized connectivity disruptions. A study of a language-based decision-making task shows how functional and structural connectivity may be used to examine the integration of multiple subnetworks and their influence upon cognitive performance. Finally, a study of lateralization in aging demonstrates that both age-related functional and structural are associated with maintaining a high level of cognitive performance.
Degree Type Dissertation
Degree Name
Doctor of Philosophy (PhD)
Graduate Group Bioengineering
First Advisor James Gee
Keywords
brain connectivity networks MRI
Subject Categories
CHARACTERIZING CONNECTIVITY IN BRAIN NETWORKS USING
MAGNETIC RESONANCE IMAGING
Jeffrey T. Duda
A DISSERTATION
in
Bioengineering
Presented to the Faculties of the University of Pennsylvania
in
Partial Fulfillment of the Requirements for the
Degree of Doctor of Philosophy
2010
Supervisor of Dissertation
James C. Gee, Ph.D., Associate Professor, Radiology
Graduate Group Chairperson
Susan Margulies, Ph.D., Professor, Bioengineering
Dissertation Committee
Andrew Tsourkas, Ph.D., Assistant Professor, Bioengineering
Nick Bryan, M.D., Ph.D., Professor, Radiology
This thesis is dedicated to my parents, John and Judith Duda, for the
encourage-ment and support they provided to all of their offspring in our respective pursuits
Acknowledgements
I am grateful to my parents. I would also like to thank my advisor, Dr. James C.
Gee, for his guidance and support - both far beyond the call of duty. A special
thanks to Dr. Peter Basser for introducing me to the wonders of the diffusion
tensor. Many thanks, as well, to Dr. Murray Grossman for bringing the clinical
significance of the work into sharp focus. Thanks to the committee for taking time
from their careers to read this dissertation and improve its content. Thanks to the
various members of PICSL that I have worked with over the years. In particular,
Dr. Tessa Sundaram Cook, Dr. Phil Cook, and Dr. Brian Avants all of whom
ABSTRACT
CHARACTERIZING CONNECTIVITY IN BRAIN NETWORKS USING
MAGNETIC RESONANCE IMAGING
Jeffrey T. Duda
Supervisor: James C. Gee, Ph.D.
The human brain is a system of neurons that provides great computational
ca-pacity via a complicated communication network. A complete description of this
network, also known as the human connectome, is an active topic of research as
it would provide invaluable knowledge to cognitive neuroscience. Historically, the
study of brain connectivity has been marked by a dichotomy between structure and
function. Recent advances in magnetic resonance imaging (MRI) provide a
poten-tial framework for bridging this divide and allowing for a more complete window
onto brain connectivity. Here, a framework for examining structural
connectiv-ity and functional connectivconnectiv-ity in a network is presented with a focus upon the
study of well-known subnetworks. An examination of the thalamo-cortical system
exhibits the ability to use multivariate MRI data to model a brain network and
identify localized connectivity disruptions. A study of a language-based
decision-making task shows how functional and structural connectivity may be used to
examine the integration of multiple subnetworks and their influence upon
cogni-tive performance. Finally, a study of lateralization in aging demonstrates that
both age-related functional and structural are associated with maintaining a high
Contents
Acknowledgements iii
Abstract iv
Contents v
List of Tables ix
List of Figures x
1 Introduction 1
1.1 Normal brain anatomy and physiology . . . 2
1.2 Connectivity in the brain . . . 4
1.2.1 Anatomical and Structural Connectivity . . . 5
1.2.2 Functional Connectivity . . . 8
1.3 Introduction to the dissertation . . . 9
2 Background: Neuroimaging for the Examination of Anatomy, Struc-ture and Function in the Human Brain 11 2.1 Diffusion Tensor MRI . . . 12
2.1.2 Measuring the diffusion tensor . . . 14
2.1.3 Fiber tractography . . . 16
2.2 Functional MRI . . . 21
2.2.1 Functional connectivity . . . 21
2.3 Early neuroimaging studies of brain connectivity . . . 24
2.3.1 Structural connectivity . . . 24
2.3.2 Combined structural and functional connectivity studies . . 27
3 Multivariate Analysis of Thalamo-Cortical Structural Connectiv-ity Loss in TBI 31 3.1 Introduction . . . 32
3.2 Materials and Methods . . . 35
3.2.1 Cohort and Image Dataset . . . 35
3.2.2 Normalization . . . 38
3.2.3 Connectivity Model . . . 40
3.2.4 Subject Specific Connectivity Models . . . 43
3.3 Results . . . 45
3.4 Discussion . . . 49
4 Structural and functional connectivity influence decision-making in communication. 52 4.1 Introduction . . . 53
4.1.1 Structural connectivity . . . 54
4.1.2 DTI and structure . . . 55
4.1.3 Functional integration and connectivity . . . 56
4.1.5 Incorporation of behavioral data . . . 59
4.2 Methods . . . 60
4.2.1 Subjects . . . 60
4.2.2 Subnetworks in the brain . . . 60
4.2.3 MRI acquisition . . . 62
4.2.4 fMRI analyses overview . . . 62
4.2.5 DTI analyses . . . 64
4.2.6 Relating function and structure to behavior . . . 66
4.3 Results . . . 68
4.3.1 Statistically-based functional integration . . . 68
4.3.2 DTI analyses of biological projections . . . 68
4.3.3 Predicting performance from statistically-based and biologi-cal connectivity . . . 70
4.4 Discussion . . . 71
4.4.1 Summary . . . 71
4.4.2 Large-Scale Neural Networks . . . 72
4.4.3 Functional Integration . . . 73
4.4.4 Functional Connectivity . . . 75
4.4.5 Structural Connectivity . . . 77
4.4.6 Shortcomings . . . 79
4.4.7 Conclusions . . . 80
5 The lateralization of structure and function in aging: A combined fMRI and DTI study 82 5.1 Introduction . . . 83
5.2.1 Analyses of fMRI . . . 87
5.2.2 Analyses of DTI . . . 88
5.2.3 Fiber Tractography . . . 89
5.3 Results . . . 92
5.3.1 Function . . . 92
5.3.2 Structure . . . 92
5.4 Discussion . . . 94
6 Conclusions and Future Directions 100 6.1 Contributions . . . 100
6.2 Future Directions . . . 101
A 103 A.1 Publications by the author . . . 103
List of Tables
4.1 Example stimulus materials for the homonym “pen” in each
exper-imental condition. Sentences adapted from McMillan, et al. [202] . 62
4.2 Peak activation MNI coordinates of functional regions of interest . . 63
4.3 Group-wise correlations of activation t-values under all conditions.
*p <0.05. Cortical regions include orbital frontal (OFC), anterior temporal (ATC), posterior lateral temporal (PLTC), dorso-lateral
prefrontal (DLFPC), and inferior partietal (IPC). A green dotted
line identifies the language subnetwork connections, a spaced blue
dashed line identifies the connections of the decision-making
sub-network and a red dashed line identifies connections between the
language and decision-making subnetworks . . . 81
List of Figures
1.1 a) An image of an ex-vivo human brain in which the forebrain and
hindbrain are visible (image adapted from [277]) b) Each hemisphere
of the the forebrain is divided into four lobes as illustrated here
(image adapted from [204]) c) Brodmann proposed a labeling of
the brain surface based upon cytoarchitectural features of the brain
(image adapted from [276]) . . . 4
1.2 Cortical regions communicate via the white matter which consists
of: a) the projection fibers that connect the cortex to the lower
brain and spinal cord (image adapted from [308]) b) the commisural
fibers that connect the hemispheres of the brain (image adapted
from [307]) c) the association fibers the provide both long and short
range intra-hemispheric connections (image adapted from [308]). . . 5
2.1 An example diagram of a Stejskal-Tanner pulse gradient spin echo
experiment used to measure diffusion (adapted from [37]). For
fur-ther explanation on understanding pulse sequence diagrams, please
see [126]. . . 14
2.3 Properties of the diffusion tensor may be used to create images for
visualization: a) fractional anisotropy measures how
directionally-specific the diffusion of water is within a given voxel; b) directionally
encoded colormaps may be calculated from the primary direction of
diffusion, seen here as a color overlay on an anatomical MR image. . 17
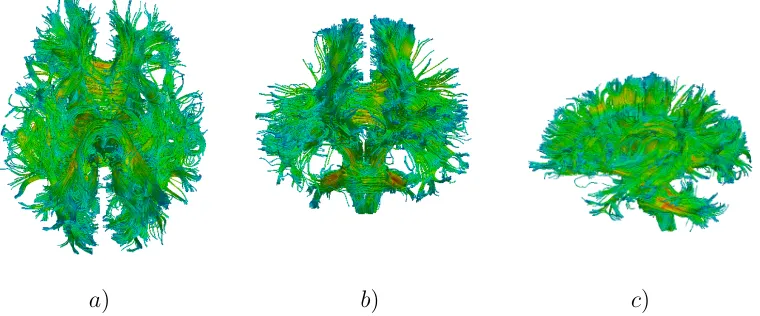
2.4 Whole-brain tractography uses all points in the white matter as
seeds for fiber tracking. Results in an individual subject are
illus-trated here with a) axial b) coronal and c) sagittal views. . . 19
2.5 BOLD fMRI may be used to infer functional activation. Here, the
BOLD signal is displayed as a color overlay on an anatomical MR
image in an individual subject. . . 22
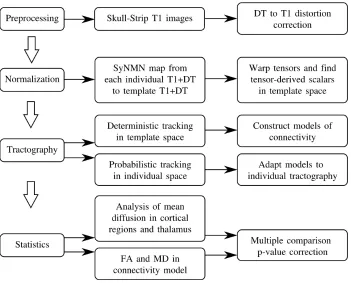
3.1 A overview of the steps required in the processing for the population
analysis of structure and connectivity. . . 36
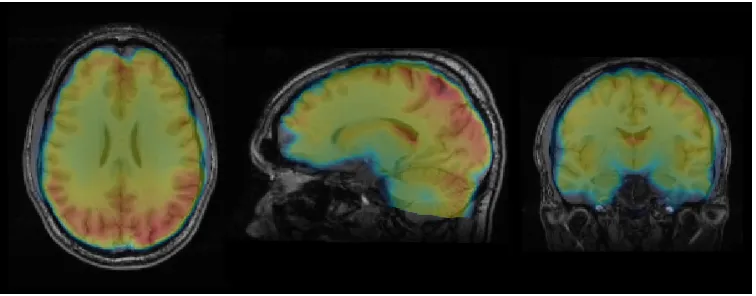
3.2 Triplanar view of the combined T1 and DTI template provided by
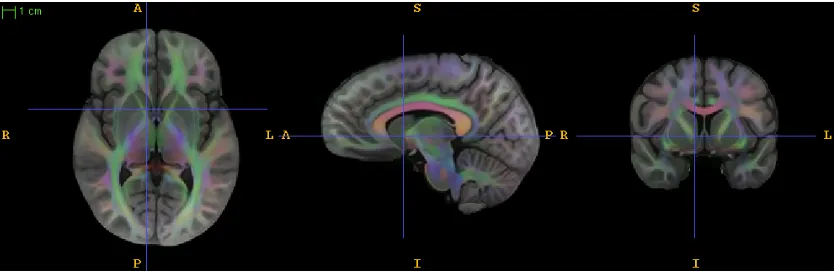
SyNMN. The directionally-encoded color map obtained from the
principal direction of diffusion in the DTI data provides an overlay
to the T1 data. . . 39
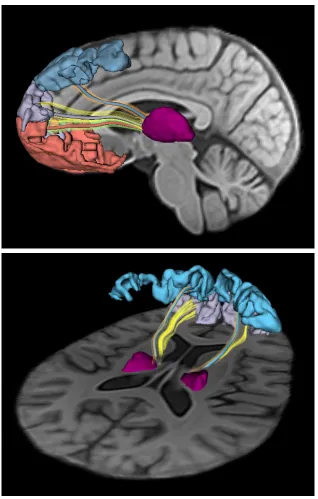
3.3 Thalamo-cortical connectivity models for the prefrontal lobe are
created using deterministic tractography in a subject-specific
at-las. BA’s 9 (blue), 10 (purple) and 11 (pink) are used to label the
streamlines that connect each region to the thalamus. Model
con-nections are visualized as tubes with colors corresponding to their
cortical regions. The streamlines used to determine the model
3.4 The connectivity model (green) was warped into the subject space
via the transform provided by SyMNM. The results of probabilistic
tractography (red) in the individual were then used to adapt the
model to the subject resulting in a model (blue) that more closely
represented the subject’s anatomy. . . 44
3.5 Subject specific connectivity models for connectivity between
tha-lamus (purple) and BA 9(light blue), 10 (light purple) and BA 11
(pink) are illustrated for three controls (left) and three subjects
(right). The connectivity models are colored by average fractional
anisotropy. . . 46
3.6 Mean diffusion is examined in the cortical regions and thalamus.
Results with an FDR-corrected p-value<0.02 and a cluster size of 15 voxels or greater are visualized. . . 47
3.7 Students t-test results after FDR correction at p<0.02 indicated that the left hemisphere connection between thalamus and
Brod-mann area 10 is affected by TBI. Arrows indicate regions where
TBI survivors showed reduced FA compared to controls in both
subject space (left) and template space (right) analysis. Sagittal
and axial slices from the T1 component of the template are shown
4.1 Functionally activated cortical regions (shown in red) were used to
identify white matter fiber bundles that connected any two activated
regions of interest. This resulted in the identification of six white
matter projections for which mean fractional anisotropy (FA) was
calculated. This network included the uncinate fasciculus (blue,
FA=0.397± 0.092), arcuate fasciculus (pink, FA=0.459 ± 0.151), inferior frontal-occiptal fasciculus (orange, FA=0.646±0.122), in-ferior longitudinal fasciculus (purple, FA=0.479 ±0.142), superior longitudinal fasciculus (yellow, FA=0.523±0.068) and the arcuate fasciculus vertical (green, FA=0.511±0.099). . . 69 4.2 Stepwise multiple linear regression analysis examining performance
in the subordinate context and functional connectivity between
re-gions connected by a white matter fiber tract resulted in a model
including the vertical aspect of the arcuate fasciculus (AFV), IFO,
IFL and UNC. * p <0.05 . . . 71 4.3 Stepwise multiple linear regression analysis examining performance
in the subordinate context and tract averaged FA implicated all
biological connections in the network: uncinate fasciculus (UNC),
arcuate fasciculus (ARC), superior longitudinal fasciculus (SLF),
in-ferior longitudinal fasciculus (ILF), inin-ferior frontal-occipital
fascicu-lus (IFO) and the arcuate fascicufascicu-lus vertical (AFV). The coefficients
for each structure are illustrated here. *Indicates an individually
5.1 Top: The human corpus callosum (image adapted from [204]).
De-terministic tractography methods are able to identify the aspects
of the corpus callosum that connect superior cortical regions (green
arrows), but are unable to identify the aspects that extend to more
lateral cortical regions (red arrows). Bottom: Example results of
atlas-based deterministic fiber tractography of the human corpus
callosum with fibers colored by brain lobe. . . 91
5.2 Region-averaged functional activation was measured in both
hemi-spheres in the dorsolateral prefrontal cortex (top row),
posterolat-eral temporal cortex (middle row) and inferior frontal cortex
(bot-tom row). . . 93
5.3 A set of 3 functionally activated regions: Dorsolateral Prefrontal
Cortex (DLPFC), Posterolateral Temporal Cortex (PLTC), and
In-ferior Frontal Cortex (IFC) were identified in the left hemisphere.
These regions, along with their right hemisphere homologues were
used to identify the fiber tracts that provide biological connectivity.
In each hemisphere, intra-hemispheric connectivity is provided by
the arcuate fasciculus (pink) and a bundle of short frontal fibers
(blue). Each homologous pair of activated regions was used to
iden-tify the following subcomponents of the corpus callosum that
pro-vided inter-hemispheric connectivity: DLPFC (green), IFC (orange)
and PLTC (yellow). Surface-meshes created from the the geometric
5.4 Tract-averaged fractional anisotropy was measured for the portions
of the corpus callosum that provide inter-hemispheric connections
between the cortical regions of interest (top row), the arcuate
Chapter 1
Introduction
“The brain is the last and grandest biological frontier, the most complex
thing we have yet discovered in our universe. It contains hundreds of
billions of cells interlinked through trillions of connections. The brain
boggles the mind.”
–James D. Watson, Discovering the Brain, National Academy Press,
1992
The human brain serves as the control center of the nervous system and
con-trols nearly every activity that is required for survival. It contains hundreds of
billions of neurons that communicate with each other via a network of hundreds
of trillions of connections, forming the most complex organ in the human body.
Having been recognized as the body’s major controlling center by the Greek
physi-cian Hippocrates, the brain has long been a focus of scientific inquiry [90]. Early
examinations centered upon dissection to examine the neuroanatomy of the brain
and led to the discovery of critical features of the brain, such as Andreas
that the brain is composed of many “organs” each responsible for specific
func-tional faculties [104]. Paul Broca’s (1824 - 1880) cortical lesion analyses provided
critical knowledge as they introduced the concept of functional lateralization and
suggested a direct link between structure and function in the brain. While these
ex-vivo examinations of the brain provided great insight into brain anatomy and
structure, the ability to examine brain function in-vivo confirmed the functional
specialization of subregions of the brain. Studies of brain function have also
re-vealed that the functional subregions of the brain work together to form large-scale
neural networks that allow for complex cognitive processes. Hence, it is important
to not only characterize anatomy, structure and function in the brain, but also the
inter-relations, or connectivity, and their influence upon cognitive performance.
In this dissertation, we present methods to quantitatively characterize the
re-lationships between anatomy, structure, and function throughout the human brain
through the use of neuroimaging techniques. We use the functional outcome of
brain injury to guide an examination of structural damage in the brain. We
exam-ine both structural and functional connectivity to examexam-ine their role in modulating
behavior in healthy human brain, and we explore the influence of aging upon
later-alization of the brain for both structure and function. In this chapter, we provide
background information for the various concepts discussed later, and introduce the
reader to the layout and direction of the dissertation.
1.1
Normal brain anatomy and physiology
Due to the compartmentalized nature of the brain, its anatomy may be described
in a hierarchical manner. The two hemispheres of the human brain have three
and the rest of the nervous system and is primarily responsible for coordinating
involuntary movement; (2) the midbrain connects the hindbrain to the forebrain,
and contains several pathways important to hearing and vision; (3) the forebrain
is the largest component and is made up of the cerebrum whose functions include
thinking, reasoning and remembering as well as the diencephalon which controls
all the autonomic regulatory activities of the body such as temperature, hunger,
and emotion. The gray matter of the cerebral cortex is the primary component
of the cerebrum, while the underlying cerebral white matter provides the network
of connections between gray matter regions. Each cerebral hemisphere consists of
four lobes (figure 1.1b). The frontal lobe functions involve the abilities to recognize
future consequences resulting from current actions, suppress unacceptable social
responses, and determine similarities and differences between entities or events.
The parietal lobe plays important roles in integrating sensory information from
various parts of the body, knowledge of numbers and their relations, in the
manip-ulation of objects, and portions of the parietal lobe are involved with visuospatial
processing. The temporal lobe is involved in auditory processing, is important for
the processing of semantics in both speech and vision, and plays a key role in the
formation of long-term memory. The occipital lobe is the visual processing center
of the brain. Methods for further subdivision of the lobes based upon
cytoarchi-tectural features of gray matter, most notably by Brodmann [47], have provided a
common anatomical frame of reference for studies of anatomy and have been found
to correspond to functional specialization.
The anatomy of the cerebral white matter is important as it provides the
com-munication network that allows the functional subregions of the cortex to
a) b) c)
Figure 1.1: a) An image of an ex-vivo human brain in which the forebrain and hindbrain
are visible (image adapted from [277]) b) Each hemisphere of the the forebrain is divided into four lobes as illustrated here (image adapted from [204]) c) Brodmann proposed a labeling of the brain surface based upon cytoarchitectural features of the brain (image adapted from [276])
.
connect the cortex with the lower parts of the brain and the spinal cord (figure
1.2a); (2) commisural fibers connect the two hemispheres of the brain (figure 1.2b);
(3) association fibers unite different parts of the same cerebral hemisphere. There
are two types of association fibers: (1) those connecting adjacent gyri, short
as-sociation fibers (i.e. u-fibers); (2) those passing between more distant parts, long
association fibers. The ability to identify functionally specific subregions of the
cortex and the white matter pathways that connect them provides a full
anatom-ical description of specialized large-scale neural networks such as the language,
memory and visuospatial networks.
1.2
Connectivity in the brain
The human brain is a system comprised of more than 1010 neurons that provide
great computational capacity via a complicated communication network consisting
a) b) c)
Figure 1.2: Cortical regions communicate via the white matter which consists of: a)
the projection fibers that connect the cortex to the lower brain and spinal cord (image adapted from [308]) b) the commisural fibers that connect the hemispheres of the brain (image adapted from [307]) c) the association fibers the provide both long and short range intra-hemispheric connections (image adapted from [308]).
cortical gray matter are responsible for processing information while their axons
comprise the white matter that provides the communication channels between the
functionally and structurally segregated subregions of the cortex. The study of
brain connectivity seeks to understand the anatomical arrangement, structural
properties, interconnections, and functional relationships of the elements of this
system and is essential for further insight into the nature of cognitive processes and
could provide a critical window onto development, aging and neurodegenerative
disease in the brain.
1.2.1
Anatomical and Structural Connectivity
The terms anatomical connectivity and structural connectivity are sometimes used
interchangeably, but here we distinguish between the two in an attempt to explore
func-tional connectivity. Anatomical connectivity identifies the presence of a physical
connection between distinct regions in the brain and quantifies the geometry of the
regions and the pathways that connects them. Structural connectivity is concerned
with the biophysical properties of the tissue that connects the regions. Collectively,
anatomical and structural connectivity are known as the human connectome and
they comprehensively describe the biological network of elements that define the
human brain [127].
Brain development plays an important role in defining the geometry and
to-pography of anatomical connections. Phylogenetically older brain regions develop
first and have direct, sometimes unidirectional, connections [112]. The
connec-tions typically have a linear configuration as seen in the corticospinal tracts and
the thalamo-cortical network. Cortical regions associated with more complex
neu-ral networks that require a higher degree of interconnectivity develop later and
consist of systems in which subregions may be connected directly or indirectly via
intermediary cortical regions. While functional regions of the cortex have been well
defined from lesion and functional studies, white matter connective pathways are
not as clearly defined due to these indirect and parallel connections. This can lead
to confusion and ambiguity regarding the components that comprise a particular
neural network. A greater understanding of the inter-relations between anatomy
and function in the brain could help identify the components that are relevant to
a functionally specific network.
Structural connectivity examines the architectural properties of anatomical
connections in order to estimate the integrity or efficacy of the connections. As
with anatomic connectivity, brain development plays an integral role in defining
matter also exhibits spatial variation with maturation first occurring centrally
and then peripherally, and from the occipital lobe to the frontal lobe [105]. The
myelin sheath that surrounds the axons of the white matter provides insulation
that enhances the speed at which signals are transmitted by the fibers. Degree
of myelination provides the basis for many measures of structural integrity and
the spatial arrangement of myelin sheaths provides a basis for elucidating fiber
orientation.
Gall and Spurzheim [104] were the first to establish that white matter consists
of individual fibers that are grouped into tracts that provide a biological
con-nection between cortical gray matter regions. The myelin sheath that surrounds
axons was first described by Thomas Schwann [199], but the term ‘myelin’ itself
was introduced later by neuropathologist Rudolph Vircho [209]. Carl Weigert’s
development of a histological stain for the identification of myelin was critical to
advancing the study of white matter and is still is use today [199]. Further work in
histological staining techniques by Camillo Golgi provided the ability to visualize
entire nerve cells, including the dendritic tree [115]. This technique was employed
extensively by Santiago Ram´on y Cajal to study nerve cells in the brain and spinal
cord [111]. The work of Paul Flechsig (1847-1929) greatly advanced knowledge
regarding white matter as he was the first to observe that myelination during
de-velopment varied based upon anatomical location and he also introduced Flechsig’s
rule, stating that cortical sensory areas are not directly connected with each other,
but rather connect to adjacent association cortices [93], a concept that profoundly
influenced modern neuroscientific concepts related to cortical localization. The
development of horseradish peroxidase (HRP) tract-tracing allowed for the precise
imaging (MRI) has allowed for routine imaging of gray and white matter and these
methods are discussed in more detail in chapter 2.
1.2.2
Functional Connectivity
The functional organization of the brain seems to observe two guiding principles:
functional segregation and functional integration [280]. Functional segregation
refers to the organization and grouping of functionally specialized neurons into
spatially distinct cortical brain regions. However, in order to perform complex
tasks it is necessary for several functionally segregated and anatomically distinct
regions to work together and form functional networks under a concept known
as functional integration. Further understanding of brain function requires not
only knowledge about the functional topography of the brain but also the complex
processes by which these regions interact. Functional segregation and integration
are both central to the study of functional connectivity. Functional connectivity
has been referred to as an ‘elusive concept’ due to the large variety of definitions,
modalities and methods that have been described using this term [140]. Here we
will reserve the term ‘functional connectivity’ to refer to statistical paradigms that
identify temporally coordinated activity in spatially distinct units [241].
Early work examining Gall’s theory of functional segregation focused upon
cor-tical lesion studies. In particular, the work of Paul Broca (1824 - 1880) provided
evidence for the localization and lateralization of language processing through
post-mortem autopsy of patients who had been able to pronounce individual words but
were unable to produce grammatically correct sentences, a condition later named
“Broca’s aphasia.” Further work in the language system by Karl Wernicke (1848
region identified by Broca. Through lesion analyses, Wernicke identified a
corti-cal region that when damaged prevented subjects from comprehending language.
The proposal that multiple functionally specific cortical regions work together to
perform complex tasks is the basis of functional integration. Additionally, this
proposal predicted the importance of structural connectivity as it recognized the
critical role of the biological connections between functional regions. Norman
Geschwind (1926 - 1984) expanded upon Wernicke’s model of the language
net-work and theorized the existence of a parallel pathway connecting Broca’s and
Wernicke’s areas that incorporates an additional cortical region. More recently,
additional evidence for functional segregation has been provided by a variety of
techniques including positron emission tomography (PET) [316],
electrophysiol-ogy [108] and functional MRI (fMRI) [141]. Neuroimaging continues to be used
extensively to study functional integration and functional connectivity [264] and
these methods are discussed in more detail in chapter 2.
1.3
Introduction to the dissertation
Here we present novel approaches for examining connectivity in the brain. We
focus on connectivity at the macro scale and how it may be studied with MRI.
To this end, we use diffusion tensor MRI along with fiber tractography to
ex-tract anatomical and structural information from white matter fiber bundles. We
demonstrate the ability of these methods to identify both local and gross white
matter properties. Atlas-based techniques are used to define geometric models of
white matter fiber pathways. These models are used to identify the white matter
communica-structural and functional connectivity are related to cognitive performance in a
language-based decision making task and in aging.
Chapter 2 presents background on methods for using neuroimaging to study
connectivity in the human brain. Chapter 3 focuses on the use of fiber tractography
to examine an a priori functionally-based hypothesis regarding localized structural
differences in a population of subjects whom have suffered a traumatic brain
in-jury (TBI). Chapter 4 describes an examination of both structural and functional
connectivity in a healthy young adult population and relates these measures to
cognitive performance. In chapter 5 we discuss a study of lateralization in the
brain and examine the influence of aging on both structure and function. Finally,
in chapter 6, we discuss the findings described in this dissertation and interesting
Chapter 2
Background: Neuroimaging for
the Examination of Anatomy,
Structure and Function in the
Human Brain
The modern development of methods for in-vivo imaging of the human brain has
proven indispensable for understanding brain function and malfunction. While
techniques such as positron emission tomography (PET) provide the ability to
im-age brain activation, the significantly better spatio-temporal resolution provided
by magnetic resonance imaging (MRI) has made it the technique of choice for
iden-tifying anatomy in studies of both structure and function in the brain. Different
tissue types may be distinguished with MRI based upon the levels of hydrogen
that they contain. Because white matter contains a large amount of tissue, while
distinguishing between these tissue types. The versatility of MRI has led to the
development of techniques to measure structure and function in the brain,
provid-ing a framework for examinprovid-ing the relationship between structural and functional
connectivity and their roles in modulating behavior.
2.1
Diffusion Tensor MRI
Of particular interest in this dissertation is the use of diffusion tensor MRI in the
examination of structural and anatomical connectivity. Diffusion tensor imaging
provides an in-vivo non-invasive measure of the local probability of self-motion of
water molecules and has proven useful in a number of applications for the study of
brain white matter [28]. The diffusion of water in white matter is highly anisotropic
due to cell walls and myelin which inhibit diffusion perpendicular to the fiber tracts
more so than diffusion parallel to the tracts. Both the shape and orientation of
the diffusion tensor provide important information regarding the structure of the
white matter. Scalar metrics derived from the diffusion tensor, such as fractional
anisotropy (FA) and mean diffusion (MD) are often used to quantify various
tis-sue properties. The structural information provided by the diffusion tensor has
been shown to be useful in a multitude of studies examining topics such as
neu-rodegenerative disorders, traumatic brain injury, development, and aging among
others [177, 273, 310].
2.1.1
Diffusion weighted MRI
The constant random motion of particles in liquids, known as Brownian motion,
particles move they collide with other particles and over time the path of any given
particle may be described by a random walk. In the presence of a concentration
gradient, a flux of the fluid is observed. If no concentration gradient is present it
becomes necessary to describe diffusion as the statistical probability that a particle
moved a certain distance in a given time. Einstein [85] showed that such a
proba-bility has a zero-mean Gaussian distribution with a variance that is proportional
to time:
< r2 >= 2N Dt,
wherer2 is the mean-squared displacement, Dis the diffusion coefficient,tis time, and N is the number of spatial dimensions over which distances are measured.
In the case of MRI, diffusion may only be measured in one direction at a time,
soN is equal to one. As spins in the presence of a magnetic field gradient diffuse, they accumulate phase shifts, thus reducing the intensity of the MR signal. This
effect may be magnified with the use of stronger gradients, and may be accurately
measured with a spin-echo sequence such as the one illustrated in Figure 2.1 that
includes equal rectangular gradient pulses both before and after the refocusing
pulse. During the first pulse, spins acquire different phase shifts based upon their
location. If the spins remain stationary, then these phase shifts are reversed during
the second pulse. Spins that diffuse will acquire a net phase shift resulting in a
signal attenuation,A, that is proportional to the diffusion coefficient,D, according to
A=e−bD (2.1)
Figure 2.1: An example diagram of a Stejskal-Tanner pulse gradient spin echo ex-periment used to measure diffusion (adapted from [37]). For further explanation on understanding pulse sequence diagrams, please see [126].
2.1.2
Measuring the diffusion tensor
In the case of isotropic tissue, diffusion may be described by a single scalar
param-eter, the diffusion coefficient. However, tissue such as white matter is anisotropic
and in order to more fully characterize the diffusion it is necessary to use a tensor
which describes diffusion along each direction and the correlations between these
directions [179]. Mathematically, a symmetric, second order tensor, D, is used to describe the three dimensional self-diffusion of water within a volume:
D=
Dxx Dxy Dxz
Dyx Dyy Dyz
Dzx Dzy Dzz
The principle directions of diffusivity may be used to define a reference frame
used to represent diffusion along [x0, y0, z0] and the attenuation becomes
A=e−bx0x0Dx0x0−by0y0Dy0y0−bz0z0Dz0z0 (2.2)
where bii are elements of the b matrix which expresses the b-factors for the direc-tions in the reference frame. However, measurements are actually made in a frame
of reference [x, y, z] defined by the scanner. This makes it necessary to incorporate the non-diagonal elements of the b matrix in order to incorporate the correlation
of diffusion in perpendicular directions, leading to
A=e−Pi=x,y,z
P
i=x,y,zbijDij (2.3)
Because the diffusion tensor is symmetric, Dij =Dji, the attenuation may also be written as
A=e−bxxDxx−byyDyy−bzzDzz−2bxyDxy−2bxzDxz−2byzDyz (2.4)
In order to determine the diffusion tensor it is necessary to obtain six or more
measures of attenuation, which requires a minimum of six diffusion weighted images
and one non-diffusion weighted image.
The eigensystem of D consists of three eigenvectors, e1, e2, e3 and their corre-sponding eigenvaluesλ1 ≥λ2 ≥λ3. The eigenvectors describe the principal axes of diffusion, and the eigenvalues are proportional to the mean squared displacements
along the corresponding eigenvector. The values may be used to define
visualiza-tion of tensor such as ellipsoids with orientavisualiza-tion determined by eigenvectors and
example is shown in figure 2.3.
In tissue, the diffusion of water may be anisotropic, i.e. it may vary with
direc-tion, due to the presence of obstacles that limit molecular movement. The axons
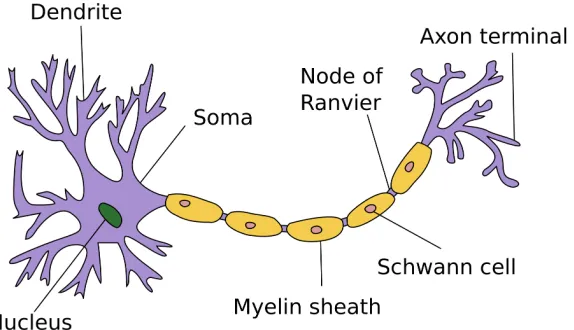
of white matter are insulated with a fatty protein called myelin which improves the
efficiency of signals that travel along the axon 2.2. In fibrous tissue, such as white
matter, the arrangement of nerve fibers into bundles results in a bias in which
diffusion parallel to the fibers is often 3-6 times faster than diffusion perpendicular
to the fiber bundle [178] due to the restriction of water diffusion caused by myelin
and the cell walls of the axons. This ability to estimate fiber bundle orientation
within a voxel led to the field of fiber tractography.
Figure 2.2: Diagram of a neuron with a myelinated axon (adapted from wikipedia).
2.1.3
Fiber tractography
A great deal of research focused upon methods for fiber tractography which use the
fiber orientation information provided by the diffusion tensor to estimate
trajecto-ries of white matter projections throughout the brain. Tractography may provide
a) b)
Figure 2.3: Properties of the diffusion tensor may be used to create images for
vi-sualization: a) fractional anisotropy measures how directionally-specific the diffusion of water is within a given voxel; b) directionally encoded colormaps may be calculated from the primary direction of diffusion, seen here as a color overlay on an anatomical MR image.
properties of the underlying white matter. Tractography methods can be grouped
into 3 categories: deterministic, probabilistic, and energy-minimizing.
Deterministic tractography
Deterministic tractography methods use a starting seed point, and then the
direc-tion informadirec-tion provided by the diffusion tensor is used to trace fiber trajectories
until the end of a fiber bundle is reached [29, 212]. These trajectories are referred
to as streamlines. Due to the limited spatial resolution of DTI, streamlines
repre-sent estimated pathways of large bundles of fibers and do not correspond to the
trajectories of individual axons. Methods for deterministic tractography typically
differ in the details of the methods used to infer fiber direction from the
adaptive step-size using the Runge-Kutta method [29, 275], and methods that
in-corporate a momentum term to account for previous steps [175]. To determine
when the end of a fiber bundle has been reached, various stopping conditions are
used, such as FA thresholds [61], local curvature thresholds [29], and measures of
local orientation dispersion [210]
All deterministic methods suffer from error propagation resulting from noise in
the DTI signal [29]. The extent of the error varies with the geometry of the fiber
bundle, the anisotropy in the white matter, the resolution of the data, and the
interpolation method [190]. Deterministic methods may fail when a single voxel
contains fibers from two or more distinct populations including fibers that cross,
“kiss”, branch or merge [29]. One approach to avoiding false-negative connections
incorporates brute-force seed selection and is known as whole-brain tractography
(illustrated in figure 2.4). In this approach, all points in the brain are used as
seeds for fiber tractography [61]. A lack of confidence measures for streamlines
makes the automatic identification of spurious streamlines difficult. The use of
user defined landmarks may reduce this problem but is time intensive and requires
existing knowledge of neuroanatomy [213, 294, 293].
Probabilistic tractography
Probabilistic tractography methods use the fiber orientation measurements
pro-vided by diffusion weighted MRI to estimate the likelihood of a connection
be-tween two points. This likelihood is the integral of all possible paths that connect
two points and is solved analytically by generating a set of “probabilistic
stream-lines”. At each point in the image, a local probability density function (PDF) of
a) b) c)
Figure 2.4: Whole-brain tractography uses all points in the white matter as seeds
for fiber tracking. Results in an individual subject are illustrated here with a) axial b) coronal and c) sagittal views.
orientation from the PDF at each point and advancing by a small step along that
direction. As with deterministic tractography, this advancement continues until a
stopping criteria determines that the end of the fiber bundle has been reached. A
final measure of connectivity between two points is then determined by
calculat-ing the probabilistic index of connectivity (PICo), a quantity that was introduced
independently by Parker et al. [225] and Lazar and Alexander [175]. Approaches
to probabilistic tractography differ in the approach to estimating the PDF and
include model-based approaches [225, 175] and a Bayesian approach [37].
Model-based approaches to estimating the PDF are limited by the sources
of uncertainty that may be included in the model. Uncertainty resulting from
patient motion and eddy-current distortion are not included in the estimates of
uncertainty. Additionally, these methods assume a Gaussian diffusion of water
which is not necessarily the case. Probabilistic tractography methods are also
for each seed (typically near 10,000) the whole-brain approach used in deterministic
tractography may not be a practical option for examining human data.
Energy-minimizing tractography
Energy-minimizing tractography approaches may be grouped into two categories,
fast-marching and simulated annealing. Fast-marching methods rely upon level-set
theory and the fast-marching algorithm. From a given seed point, the speed and
direction of a propagation front are defined from local tensor properties. The use
of local properties means that the propagation of the front will vary in different
regions of the brain. Time-of-arrival maps are then determined for the whole brain
and used to estimate the likelihood of a connection between a seed and any given
point in the brain. These methods differ in the details of how the tensor data is
used to define a speed and direction of the propagation front. Parker et al. [226]
relied upone1 while O’Donnell et al. [217] incorporated the whole diffusion-tensor. The simulated annealing approach considers two points, and attempts to identify
the most favorable path that connects these points. Local energies at points along a
potential path are determined based upon geometric properties of the path (short,
straighter paths are generally preferred) and upon agreement between the direction
of the path and the orientation of the underlying tensor field. Energy-minimizing
methods differ in the details of how a local energy is determined [283, 282].
Energy-minimizing approaches rely upon a priori knowledge of anatomy as they require
the selection of two end points to examine. False-positive connections are also a
problem as these methods are guaranteed to fine some level of connectivity between
any two points, even when that connection is not anatomically feasible. While
and branching, little has been done to evaluate the methods or demonstrate their
performance in clinical data.
2.2
Functional MRI
Brain activation may be mapped with MRI by exploiting the interrelationship
between physiological function, energy metabolism and localized blood supply.
In particular, the blood-oxygenation-level-dependent (BOLD) contrast mechanism
first demonstrated by Ogawa, et al. [220], has been employed extensively due to its
high sensitivity and accessibility. The BOLD contrast results from gradient echo
techniques that accentuate the susceptibility effects of deoxyhemoglobin (dHb) in
the venous blood and thus reflects the blood oxygen level. While increased neural
activity should result in a decreased BOLD signal due to field inhomogeneities
caused by dHb, brain activation causes an increased BOLD signal due to increased
cerebral blood flow that is not balanced by a commensurate increase in oxygen
consumption rate [96] thus resulting in lower dHb content per volume of tissue.
Additional research has revealed the BOLD contrast to be the complex result
controlled by many parameters. Despite this complexity, the BOLD signal has
been successfully used in hundreds of studies of human brain as well as a large
number of animal studies.
2.2.1
Functional connectivity
The use of BOLD fMRI for mapping human brain function has seen widespread
use for the past two decades. While earlier research focused upon the
Figure 2.5: BOLD fMRI may be used to infer functional activation. Here, the BOLD signal is displayed as a color overlay on an anatomical MR image in an individual subject.
paid to the examination of the interactions and coordination between different
parts of the brain [95, 121, 215]. Specifically, studies of functional connectivity
seek to identify ‘temporal correlations between spatially remote neurophysiological
events’ [97, 181]. Here we focus on methods for the study of functional connectivity
related to neurophysiological events as opposed to methods designed to examine
resting state functional connectivity. These methods may be grouped into two
cat-egories, model-based methods that incorporate a priori knowledge and data-driven
methods that do not require any prior knowledge.
Model-based functional connectivity
Model-based methods generally rely upon seed regions that are defined using prior
neuroanatomical knowledge. A metric of similarity is defined in order to generate
connectivity maps and a number of metrics have been proposed. Cross-correlation
analysis (CCA) has been used extensively since its introduction for use in functional
connectivity by Cao and Worsley [53]. This method measures correlations in the
correspond to a stimulus of interest. Additionally, CCA may examine correlations
at different time lags, though many studies only examine the zero lag scenario.
CCA is susceptible to artifacts caused by cardiac activity and blood vessel
activ-ity that may result in false-positive identification of correlations [98]. Coherence
analysis was introduced by Sun et al. [270] to try to address these shortcomings.
Coherence analysis is the spectral representation of correlation in the frequency
domain, a conversion that provides a natural framework for comparing time
sig-nals. The requirement of seed-selection limits these studies to the examination of
cortical regions that have been selected via prior knowledge and prevents studies
that fully explore functional connectivity throughout the brain [192].
Data-driven functional connectivity
To overcome the need for prior anatomical knowledge that is required for
model-based techniques, data-driven techniques were developed, allowing for explorative
studies of whole brain functional connectivity. Principle component analysis (PCA)
is a widely used technique and was introduced for functional connectivity analysis
by Friston et al. [97]. In PCA, the fMRI time-signals are represented by
orthogo-nal contributors in order to identify the vectors that most contribute to variance.
These methods have trouble identifying functional connectivity in the presence of
physiological noise [34] and are often used as a precursor to independent
compo-nent analysis (ICA). ICA is similar to PCA but identifies compocompo-nents that are as
statistically independent as possible [146] and was introduced into use for
func-tional connectivity by McKeown et al. [201]. Despite the wide use of ICA methods,
there are still no clear guidelines indicating when the data should be decomposed
connectivity maps, but the question of how to appropriately threshold these maps
is still an open issue [192].
2.3
Early neuroimaging studies of brain
connec-tivity
Extensive progress in neuroimage analysis techniques has resulted in a variety
of approaches to examining connectivity in the brain. At the most fundamental
level, these techniques are typically categorized into either studies of structural
connectivity, functional connectivity, or combined studies of both. Here we provide
a review of techniques in each of these categories that are relevant to the work
presented here.
2.3.1
Structural connectivity
The study of structural connectivity typically focuses upon the examination of the
myelinated axons that makeup white matter. Changes within white matter
prop-erties play an crucial role in brain aging [1, 9, 27, 169, 242, 243, 295, 306, 300].
Ad-ditionally, the structural integrity of white matter has been shown to influence
cog-nitive function in both health [305, 154, 284, 134, 94] and disease [71, 69, 299, 84].
Measures of structural connectivity may be inferred by measuring the size of white
matter structures, an approach that has been used extensively to study the
mid-sagittal cross-section of the corpus callosum [304, 60, 123]. Volumetric analysis
of white matter fiber tracts has been interpreted as a measure of structural
in-tegrity [242] and has been used to examine hemispheric asymmetry [54, 231].
and microstructure is still lacking for both health and disease and is an active topic
of research. In middle-age, FA has been shown to be more sensitive than white
matter volume to changes in white matter integrity, likely due to myelin reduction
with increasing age [92]. Additionally, the finding of a weak correlation between
FA and white matter volume suggests that these metrics are sensitive to different
characteristics of white matter [92]. Correlations have been found between FA and
voxel-based morphometry in select fiber tracts such as the corpus callosum and
corona radiata [144]. However an aging study examining FA and white matter
volume found that FA correlated negatively with age, but white matter volume
did not correlate with age [1]. These results suggest that while anatomical based
measures and microstuctural based measures of white matter integrity are related,
they are complementary and each provides a unique window onto the complex
nature of white matter integrity.
A great deal of research into structural connectivity has focused upon methods
that incorporate fiber tractography. Identifying the cortical regions to which these
fiber bundles extend provides the ability to examine the topography of specific
white matter pathways [38]. A typical use of fiber tractography is for defining
a region-of-interest by labeling all voxels that contain fibers for the tract of
in-terest and then performing standard ROI analysis. Work exploring the use of
fiber-tract oriented statistics presents methods for examining tract-features over
the length of tracts [156, 64, 193, 186, 218, 68, 116, 33], but the identification of
appropriate metrics and methods for statistical comparison is still an open issue.
The use of template, or representative, fibers is an active topic of research and is
sometimes referred to as tract-based morphometry [219], but there currently exists
large number of methods available for estimating white matter trajectories, little
has been done to rigorously characterize the differences between these methods or
define the hypotheses for which they are appropriate, although a study of
repro-ducibility in tract-based studies suggests that the reliability of fiber tractography
methods is of central importance to tract-based studies [58].
The use of DTI in tract-based studies has received much attention recently [64,
74, 156, 89]. Two methods for anatomical-based probing of local FA, the
tract-based spatial statistics (TBSS) method [260] and tract-specific analysis (TSA) [315],
have proven to be particularly useful in whole-brain analysis of FA. TBSS pioneered
the use of atlas-derived skeletons that are used to reduce dimensionality by
pro-jecting local white matter features onto the skeleton [260]. TBSS has been used
extensively for whole-brain voxel-wise analysis [169, 261, 10, 257, 244], but the
skeletonization approach does not account for the wide-spread connectivity that
may be assessed with DTI and lacks anatomical specificity [317]. TSA takes a
similar approach to TBSS, but focuses on the analysis of sheet-like white matter
structures and uses a 2D parameterization to achieve a reduction of
dimension-ality [315]. Additionally, TSA provides models of specific white matter tracts
al-lowing for studies that seek to examine an a priori hypothesis regarding structural
connectivity [317]. While TSA provides a framework for tract-specific analyses,
its implementation only provides the ability to examine six predefined fiber tracts.
It is often desirable to examine subcomponents of large fiber tracts (e.g. corpus
callosum), defined by connectivity to localized cortical regions, and neither TBSS
nor TSA address this concern.
Recently, a number of studies have sought to use DTI to measure whole brain
148]. Many of these studies have relied upon measures such as ”fiber counts” and
fiber length to estimate structural connectivity. These types of metrics are known
to be unreliable due to bias resulting from total brain volume, differences in size
between regions of the brain, noise, and partial voluming [64]. Additionally, they
fail to incorporate the geometric features provided by the tract model as well as
neglecting to incorporate the biophysical properties of the tissues that compromise
these fiber pathways. The use of metrics for structural connectivity that leverage
the anatomic framework provided by tractography to probe underlying tissue
ar-chitecture may provide more relevant insight regarding the physical integrity of
cortical connections.
2.3.2
Combined structural and functional connectivity
stud-ies
Current views in neuroscience suggest that different brain regions organize into
large-scale neural networks in order to achieve complex cognitive functioning for
vision, attention, memory, language and motor planning [241]. As described earlier,
much of the work examining these networks focuses on either structure or function.
While both are essential for a more complete understanding of the brain, when
used alone each suffers from an incomplete model. Combined analysis of both
functional and structural connectivity provides a system in which each type of
connectivity may guide the other, leading to a more reliable and concise depiction
of brain connectivity. Here we discuss current approaches to the study of combined
Qualitative comparison
In this approach, both structural and functional data are acquired in the same
pa-tient, analyzed independently, and then qualitatively compared. These studies use
DTI to examine anatomical or structural connectivity and fMRI to examine
func-tional connectivity. Studies that employ this approach seek to identify converging
evidence of structural and functional organization [151, 166, 214, 255, 296]. These
studies often take an approach similar to that of Wieshmann et al. [303] where DTI
is used to identify a white matter region exhibiting reduced integrity and fMRI
shows no activation in the cortical region to which the damaged white matter
connects. Because this strategy delays the combination of connectivity until the
discussion of the results, it lacks an underlying framework for combined analysis
and is of limited utility.
Superimposition
Here, the structural and functional data for a subject are mapped into a common
space via techniques for image registration. From the common space, overlays
are created from both structural and functional data for subsequent visual
analy-sis [39, 42, 133, 173, 203, 221, 227, 236, 253]. By mapping the data into a common
space these methods provide an enhanced method for interpretation but still fail to
quantitatively leverage the multi-modal connectivity information that is obtained.
One reason is that the structural connectivity is primarily related to white matter
while functional connectivity is primarily related to gray matter. Additionally,
these methods have relied upon deterministic fiber tractography methods that are
highly biased toward major myelinated pathways and may fail to recognize
the role of the short-range associative fibers. The dependence upon visual analysis
leaves the interpretation susceptible to imperfect visualization methods.
Statistical models of connectivity
Methods that utilize a quantitative model for modality integration hold the most
potential for obtaining informative results. One advantage is their ability to take
the large amount of information provided by the multiple measures of connectivity
and reduce it in order to summarize specific structural-functional relationships of
interest. A typical approach is to use the functional regions of activation provided
by fMRI to provide a set of seeds points to DTI on which fiber tractography is
performed [76, 125, 153, 163, 165, 250]. Alternatively, directly examining
corre-lations between structure and function provides a powerful form of analysis that
facilitates the incorporation of additional information such as measures of cognitive
performance, behavioral data or age [24, 194]. Studies have examined correlations
between FA and functional response to a task in a voxel-wise manner [230] as well
as averaged over regions of interest [281] to find positive correlations between level
of activation and FA. A study that included behavioral data found that
work-ing memory scores independently correlated with both FA and BOLD response in
children [222]
The use of graph-based network analysis techniques provides a natural, and
increasingly popular, framework for examining connectivity in the brain [128, 148,
149, 127, 137, 2]. The vertices of the graph correspond to functionally related
sets of neurons while the edges correspond to the physical connection or statistical
dependencies between these nodes. Early work used this concept to study resting
incorporating both structural and functional connectivity into a common network
for analysis [297, 298, 303, 138, 48, 168, 258]. Vertices may interact via multiple
connections with variable length or weights assigned to them as well as through
indirect paths that pass through other vertices. This representation provides a
mul-titude of methods for examining the data such as clustering, path lengths, vertex
degree and strength and many others [286]. This framework additionally provides
a natural basis for examination at multiple scales which is especially useful as it
allows for connectivity analysis that corresponds to the existing anatomical
hierar-chy of brain anatomy (figure 1.1). Recent work examining brain connectivity in the
context of network analysis suggests a small-world topolgy with clusters of densely
connected nodes and sparse long-range connections between these clusters [31],
a finding that supports the concept that the brain is arranged into functionally
Chapter 3
Multivariate Analysis of
Thalamo-Cortical Structural
Connectivity Loss in TBI
This chapter presents work that was presented at the Computer Vision and Pattern
Recognition workshop on Mathematical Methods in Biomedical Image Analysis
2008, Anchorage, AK [80]. The technical aspects of the multivariate registration
were completed in collaboration with Brian Avants and are discussed in greater
detail in two works on which I am second author, a manuscript that appeared in
Academic Radiology [22] and work presented at the 10th International Conference
on Medical Image Computing and Computer Assisted Intervention 2007, Brisbane,
Australia [21]. Diffusion tensor images (DTI) quantify connectivity patterns in the
brain while the T1 modality provides high-resolution images of tissue interfaces.
Our objective was to use both modalities to build subject-specific, quantitative
The health of the thalamo-cortical network is compromised by traumatic brain
injury, and we hypothesized that these effects are due to a primary injury to the
thalamus which results in subsequent compromise of radiating fibers. We first used
a population-specific average T1 and DTI template to label the thalamus and
Brod-mann areas (BA) 9,10 and 11 in each subject. We also built an expected connection
model within this template space that was transferred to subject-space in order to
provide a prior restriction on probabilistic tracking performed in subject space. We
evaluated the effect of traumatic brain injury on this prefrontal-thalamus network
by quantifying, in 10 subjects and 8 controls, the mean diffusion and fractional
anisotropy (FA) along fiber tracts, along with the mean diffusion within the
thala-mus and cortical regions. We contrasted results gained by a template-based tract
definition with those gained by performing analysis in the subject space. Both
approaches revealed structural connectivity effects of TBI, specifically a region of
reduced FA in the white matter connecting the thalamus to BA 10.
3.1
Introduction
Traumatic brain injury (TBI) is the most frequent cause of death and disability
in individuals ages 15 to 24 and is also prevalent in older adults [101]. TBI,
most commonly caused by automotive accidents and falls, occurs at a rate of
approximately 1 in 600 per year in the general population [101], whereas up to
10% of soldiers returning from Iraq may suffer from some form of TBI [136]. Even
mild TBI may lead to significant behavioral changes [172] and is very likely to be
under-reported, particularly by those who have experienced concussion [205, 57].
In consequence, up to 2% of individuals in the United States live with TBI-related
further development of sensitive tools for assessing axonal and cortical injury [172,
164], tracking recovery from these injuries [182] and predicting outcome [208, 256].
Traditional T1 imaging may be used to uncover in vivo effects of TBI in the
cor-tex and deep gray matter structures. Neuronal atrophy, from concussion, was
de-tected with T1 imaging and linked to ongoing depression [57], whereas TBI-related
reductions in gray matter concentration have also been correlated with attention
deficits [103]. Hippocampal volume may be reduced by TBI [279, 245], along with
the basal forebrain [245]. The thalamus appears to undergo injury during or after
TBI as assessed postmortem [118], through finite element models of TBI [205, 318]
and through large-deformation tensor-based morphometry of control and subject
populations [164]. An additional postmortem report has indicated involvement of
the mediodorsal thalamus, which has connections to the pre-frontal cortex [197].
This finding has also been validated at the cellular level through neuropathology [3]
and through histochemical staining and explicit neuronal counts [196]. TBI effects
in the hippocampus have also been verified neuropathologically [4].
Despite the value of T1 imaging for examining cortical atrophy, increasing
ev-idence suggests that traditional magnetic resonance imaging has limited ability to
detect TBI-related damage outside the cortex or deep gray matter, where diffusion
tensor imaging (DTI) may be more valuable [4, 36, 75, 180]. During TBI,
accel-eration of the head results in mechanical forces that compress frontal regions and
stretch posterior regions [35]. These forces result in microstructural damage to
brain tissue, known as diffuse axonal injury (DAI). Immediately after TBI, the
mi-crostructural effects of DAI manifest as disruptions in the cytoskeletal network and
axonal membranes [13, 41, 188]. This results in the formation of axonal ‘retraction
is followed by axonal disconnection. Pathological examinations of DAI have
sug-gested that small hemorrhages often accompany DAI [248]. Changes in diffusion
are hypothesized to relate to axonal swelling in TBI [36] or myelin loss [262]. Thus,
DTI is emerging as the preferred mechanism for revealing traumatic axonal injury
through a variety of diffusion-related measures.
Studies have analyzed DTI-based metrics to show that TBI leads to strong
effects in the corpus callosum [183, 86, 131, 147, 216, 310, 174, 187, 208, 240, 256,
274, 291], which may imply a disruption of brain connectivity [268, 176]. Brain
regions related to motor function are also affected [180, 311], but may also recover
over time [129]. White matter pathology caused by TBI may also appear in a
number of fascicles and may lead to cognitive deficits [172]. A few studies have
suggested that mean diffusion changes may imply cortical injury or pathology [11,
161, 56]. Increases in mean diffusion from mild cognitive impairment (MCI) have
been directly related to reductions in cognitive performance [235]. Only two DTI
studies have shown evidence of thalamic injury [246, 22], despite the ability of
DTI imaging to detect the subdivisions of thalamus into its nuclei [78, 302]. Such
divisions are not visible in T1.
Major depressive disorder (MDD) often results from mild TBI and negatively
impacts psychosocial function and cognitive performance [87, 88, 158]. Post-TBI
major depression inhibits recovery [117, 159] and, while variable, may occur in
as many as 77% of patients [8, 17, 70, 159, 288]. Evidence has linked structural
changes in the prefrontal cortex to both TBI [158] and depression [170].
Addi-tionally, structural changes in the thalamus have also been linked to TBI [118]
and depression [314]. The functional links between depression and TBI and the
![Figure 1.1: a) An image of an ex-vivo human brain in which the forebrain and hindbrainare visible (image adapted from [277]) b) Each hemisphere of the the forebrain is dividedinto four lobes as illustrated here (image adapted from [204]) c) Brodmann proposed alabeling of the brain surface based upon cytoarchitectural features of the brain (imageadapted from [276])](https://thumb-us.123doks.com/thumbv2/123dok_us/9257363.1463543/21.612.134.512.88.203/forebrain-hindbrainare-hemisphere-forebrain-dividedinto-illustrated-cytoarchitectural-imageadapted.webp)
![Figure 1.2: Cortical regions communicate via the white matter which consists of: a)the projection fibers that connect the cortex to the lower brain and spinal cord (imageadapted from [308]) b) the commisural fibers that connect the hemispheres of the brain(image adapted from [307]) c) the association fibers the provide both long and shortrange intra-hemispheric connections (image adapted from [308]).](https://thumb-us.123doks.com/thumbv2/123dok_us/9257363.1463543/22.612.126.521.83.247/communicate-projection-imageadapted-hemispheres-association-shortrange-hemispheric-connections.webp)
![Figure 2.1:An example diagram of a Stejskal-Tanner pulse gradient spin echo ex-periment used to measure diffusion (adapted from[37])](https://thumb-us.123doks.com/thumbv2/123dok_us/9257363.1463543/31.612.183.469.78.231/figure-example-diagram-stejskal-tanner-gradient-periment-diusion.webp)