SINUSOIDAL AND NON – SINUSOIDAL AIRY FUNCTIONS, NON
ROSE BENGAL WITH ITS SELECTIVE ORGANIC CHARGE TRANSFER COMPLEXES
*
Dr. Sagarkumar M. Agravat, Dr. Vishal Jain, Dr. Ketan Dodia and Prof.
Department of Physics, S.P. University, VallabhVidyanagar, India
ARTICLE INFO
ABSTRACT
Organic photoconductor Rose Bengal was studied with infrared spectroscopy. The spectra of charge transfer complexes of rose
that only one absorption edge is found. There is a mid
hopping mechanism of charge transport. The beta density is modulated by a fluctua
strength described with a cubic equation of state of imperfect gas or an arrival of a second precursor of a signal in dispersive medium described by an Airy function or a more generalized function. It is verified that Rose Bengal and its
photoconductors.
Copyright © 2018, Sagarkumar M. Agravat et al. This is an open access article distributed under the unrestricted use, distribution, and reproduction in any medium
INTRODUCTION
In the present work, infrared spectra of a
organic material called Rose Bengal and its CT complexes with standard acceptors such as chloranil, DDQ, TCNQ and TCNE have been studied. The spectra differ from those of ternary CT complexes and all other photoconductors. Only one absorption edge is found. There is a mid-IR half
density indicative of the hopping mechanism of charge transport. The beta density is modulated by a fluctuation in oscillator strength described with a cubic equation of state of imperfect gas or an arrival of a second precursor of a signal in dispersive medium described by an Airy function or a more generalized function. The low frequency spectrum (below 900 cm-1) either reveals a square-power beta density (as in chloranil and DDQ complexes) or a triangular distribution (as in TCNQ and TCNE complexes). It is verified that Rose Bengal and its CT complexes are non-linear optical media apart from being photoconductors.
Introduction to CT Complexes of Rose Bengal
Photogalvanic effect was studied in photogalvanic cells containing Rose Bengal as dyes and Mannitol as reductants (Mahesh Chandra et al., 2012).
*Corresponding author: Dr. Sagarkumar M. Agravat
Department of Physics, S.P. University, VallabhVidyanagar, India
ISSN: 0976-3376
Article History:
Received 13th September, 2018
Received in revised form 06th October, 2018
Accepted 21st November, 2018
Published online 20th December, 2018
Key words:
Organic Photoconductors, Charge transfer, Rose Bengal, Spectroscopy, Optoelectronic Devices, LEDs, Solar Cells.
Citation: Dr. Sagarkumar M. Agravat, Dr. Vishal Jain, Dr. Ketan Dodia and Prof. A.T.Oza linear optical behavior in rose bengal with its selective organic charge transfer complexes
RESEARCH ARTICLE
SINUSOIDAL AIRY FUNCTIONS, NON – LINEAR OPTICAL BEHAVIOR IN
ROSE BENGAL WITH ITS SELECTIVE ORGANIC CHARGE TRANSFER COMPLEXES
Dr. Sagarkumar M. Agravat, Dr. Vishal Jain, Dr. Ketan Dodia and Prof.
Department of Physics, S.P. University, VallabhVidyanagar, India
ABSTRACT
Organic photoconductor Rose Bengal was studied with infrared spectroscopy. The spectra of charge transfer complexes of rose Bengal differ to other ternary CT complexes and all other photoconductors, that only one absorption edge is found. There is a mid-IR half-power beta density indicative of the hopping mechanism of charge transport. The beta density is modulated by a fluctua
strength described with a cubic equation of state of imperfect gas or an arrival of a second precursor of a signal in dispersive medium described by an Airy function or a more generalized function. It is verified that Rose Bengal and its CT complexes are non-linear optical media apart from being photoconductors.
This is an open access article distributed under the Creative Commons Attribution License and reproduction in any medium, provided the original work is properly cited.
In the present work, infrared spectra of a photoconducting organic material called Rose Bengal and its CT complexes with standard acceptors such as chloranil, DDQ, TCNQ and TCNE have been studied. The spectra differ from those of ternary CT complexes and all other photoconductors. Only one IR half-power beta density indicative of the hopping mechanism of charge transport. The beta density is modulated by a fluctuation in oscillator strength described with a cubic equation of state of al of a second precursor of a signal in dispersive medium described by an Airy function or a more generalized function. The low frequency spectrum (below 900 power beta density (as in triangular distribution (as in TCNQ and TCNE complexes). It is verified that Rose linear optical media
Introduction to CT Complexes of Rose Bengal
hotogalvanic cells containing Rose Bengal as dyes and Mannitol as reductants
Dr. Sagarkumar M. Agravat,
Department of Physics, S.P. University, VallabhVidyanagar, India.
The Rose Bengal were used as
as reductant and sodium lauryl sulphate (NaLS) as surfactant for the enhancement of the conversion efficiency and storage capacity of photogalvanic cell (K.M.Gangotria
Optical properties were determined for spin
Rose Bengal derivative using variable angle of incidence spectroscopic ellipsometry in the visible and infrared wavelength regions (C. Akerlind
energetically matches the ZnO with usual KI
couple for dye-sensitized solar cell applications (Basudev Pradhan et al., 2007). The dopant dependent photocatalytic activity of polyaniline towards the degradation of Rose Bengal dye was studied by was characterized by FESEM images, FTIR and UV-Vis spectra
2016, Sadia Ameen et al., 2012). Fourier transform infrared spectroscopy (FTIR) was carried out to investigate the anchored groups on the catalyst surface which differ according to the concentration of Rose Bengal dye (RB) used (Sawsan A. Mahmood et.al.2016). Dye-sensitized solar c
by adopting Doctor Blade technique using RB dye for sensitization (M.S.Royet.al.2008).Solar cell mixed with xylenol orange and rose Bengal showed a higher conversion efficiency compared to solar cells with a single dye (Takeo OKU et al. 2011). The performance of the DSSC with the Rose Bengal dye sensitized TiO2 electrode was investigated (Supriya Bapurao Jambure et al.
Asian Journal of Science and Technology
Vol. 09, Issue, 12, pp.9116-9121, December,2018 Available Online at http://www.journalajst.com
SCIENCE AND TECHNOLOGY
Dr. Sagarkumar M. Agravat, Dr. Vishal Jain, Dr. Ketan Dodia and Prof. A.T.Oza, 2018. “Sinusoidal and non behavior in rose bengal with its selective organic charge transfer complexes”, Asian Journal of Science and Technology
LINEAR OPTICAL BEHAVIOR IN
ROSE BENGAL WITH ITS SELECTIVE ORGANIC CHARGE TRANSFER COMPLEXES
Dr. Sagarkumar M. Agravat, Dr. Vishal Jain, Dr. Ketan Dodia and Prof. A.T.Oza
Department of Physics, S.P. University, VallabhVidyanagar, India
Organic photoconductor Rose Bengal was studied with infrared spectroscopy. The spectra of charge Bengal differ to other ternary CT complexes and all other photoconductors, power beta density indicative of the hopping mechanism of charge transport. The beta density is modulated by a fluctuation in oscillator strength described with a cubic equation of state of imperfect gas or an arrival of a second precursor of a signal in dispersive medium described by an Airy function or a more generalized function. It is linear optical media apart from being
Creative Commons Attribution License, which permits
The Rose Bengal were used as photosensitizer with d-Xylose as reductant and sodium lauryl sulphate (NaLS) as surfactant for the enhancement of the conversion efficiency and storage capacity of photogalvanic cell (K.M.Gangotria et al. 2010). Optical properties were determined for spin-coated films of a Rose Bengal derivative using variable angle of incidence spectroscopic ellipsometry in the visible and infrared wavelength regions (C. Akerlind et al. 2011). The dye energetically matches the ZnO with usual KI I2 redox
sitized solar cell applications (Basudev The dopant dependent photocatalytic activity of polyaniline towards the degradation of Rose Bengal was characterized by FESEM spectra (Mukulika Chatterji et al., 2012). Fourier transform infrared spectroscopy (FTIR) was carried out to investigate the anchored groups on the catalyst surface which differ according to the concentration of Rose Bengal dye (RB) used (Sawsan A. sensitized solar cell is fabricated by adopting Doctor Blade technique using RB dye for 2008).Solar cell mixed with xylenol orange and rose Bengal showed a higher conversion efficiency compared to solar cells with a single dye (Takeo The performance of the DSSC with the Rose Bengal dye sensitized TiO2 electrode was investigated
al., 2014).
ASIAN JOURNAL OF
SCIENCE AND TECHNOLOGY
Sinusoidal and non – sinusoidal airy functions, non –
Recently we are studying the effect of charge transfer on the photoconducting properties of organic materials (P Trivedi et al., 2005). We find two types of material, the first calls of materials, those having absorption of transmission equal to constant above 1600 cm-1. The first category can be recognized as extrinsic photoconductors being insulators and the second category as intrinsic photoconductors having semiconducting behavior. In second class of materials, there is large dark current. Organic photoconductors are
from a long time (Gutman et al. 1982) but their CT complexes were never prepared and studied. Here we carry out infrared spectroscopy of the charge transfer complexes of organic photoconductors. Rose Bengal-a rosy colored agar based dye is known as a photoconductor. In the present work, FTIR spectra of CT complexes of Rose Bengal with standard organic acceptors such as Chloranil, DDQ, TCNQ and TCNE have been studied.
Experimental Details: Faintly pink coloured, almost white, Rose Bengal agar base was obtained from Sigma Chemical Company, USA. It was added yellow Chloranil, orange green TCNQ and black TCNE to form dark coloured, usually blue or black, charge transfer complexes when ground with the help of mortar and pastle. The CT complexes (5%) were ground with spectrograde KBr powder (95%) and semitransparent pallets were prepared using compressing machine. The circular discs prepared in this way were mounted in a dark chamber of a single beam, Perkin Co. made spectrophotometer. Spectra were recorded in full FTIR range between 400 cm-1 and 4000 cm-1.
RESULTS
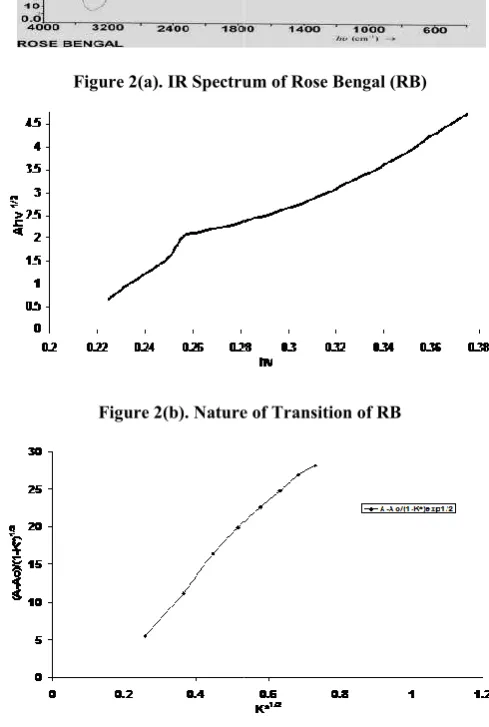
The molecular structures of Rose Bengal and the organic acceptors are shown (Figure 1). Rose Bengal being with a charge-wise neutral agar base is also not ionic and it is a considerably neutral molecule. The spectrum of Rose Bengal (Figure 2a) therefore differs from an organic radical cation or a charge transfer complex. The larger inter molecular average distance leads to a worsening of conditions for charge transport. However, a phonon drag or polaron mass enhancement can occur but the mechanism of conduction the hopping when the coupling with photon is strong or it does not hop when the coupling is weak. In one case the absorption coefficient increases and in the other case it decreases. Thus Bernoulli trials for hopping determine the absorption and lead to a half-power beta density (Larson et al.
probability is the geometric average of two complimentary probabilities - one for hopping and the other for not hopping. Thus in the spectrum of Rose Bengal for hv>
indirect transition which is a phonon-involving interband transition satisfying is found (Figure 2b). For hv>Eg (between K=1800 cm-1), a large beta density peak satisfying.
Where the normalized or reduced variable which is also dimensionless. =a and (K-a) = b, b being the base width (Figure 2c). This half-power beta density is also modulated by some sort of dispersion line shape. There is a dip in absorption near 1550 cm-1 and peak in absorption near 1400 cm-1. the dip and peak are not independent of each other.
2
( g p)
h A h E E
1 1
* * 2
(1
)
2AK
K
* (K A)
K b
*
K
9117 Asian Journal of Science and Technology,
Recently we are studying the effect of charge transfer on the photoconducting properties of organic materials (Parimal 2005). We find two types of material, the first calls of materials, those having absorption of transmission . The first category can be recognized as extrinsic photoconductors being insulators and second category as intrinsic photoconductors having semiconducting behavior. In second class of materials, there is large dark current. Organic photoconductors are well-known 1982) but their CT complexes and studied. Here we carry out infrared spectroscopy of the charge transfer complexes of organic a rosy colored agar based dye- is known as a photoconductor. In the present work, FTIR h standard organic acceptors such as Chloranil, DDQ, TCNQ and TCNE have
Faintly pink coloured, almost white, Rose Bengal agar base was obtained from Sigma Chemical Company, USA. It was added yellow Chloranil, orange DDQ, green TCNQ and black TCNE to form dark coloured, usually blue or black, charge transfer complexes when ground with the help of mortar and pastle. The CT complexes (5%) were KBr powder (95%) and pared using compressing machine. The circular discs prepared in this way were mounted in a dark chamber of a single beam, Perkin-Elmer Co. made spectrophotometer. Spectra were recorded in full
.
molecular structures of Rose Bengal and the organic acceptors are shown (Figure 1). Rose Bengal being with a wise neutral agar base is also not ionic and it is a considerably neutral molecule. The spectrum of Rose Bengal s from an organic radical cation or a charge transfer complex. The larger inter molecular average distance leads to a worsening of conditions for charge transport. However, a phonon drag or polaron mass enhancement can occur but the mechanism of conduction is the hopping when the coupling with photon is strong or it does not hop when the coupling is weak. In one case the absorption coefficient increases and in the other case it decreases. Thus Bernoulli trials for hopping determine the absorption and lead et al. 1982). The net probability is the geometric average of two complimentary one for hopping and the other for not hopping. Thus in the spectrum of Rose Bengal for hv>Eg an allowed involving interband is found (Figure 2b). ), a large beta density peak
(1)
the normalized or reduced variable which is a) = b, b being the base power beta density is also modulated by some sort of dispersion line shape. There is a dip and peak in absorption near 1400 e not independent of each other.
Figure 1. Molecular Structure of Rose and Organic Acceptors
Figure 2(a). IR Spectrum of Rose Bengal (RB)
Figure 2(b). Nature of Transition of RB
Figure 2(c). Half-Power Beta Density Below Eg Asian Journal of Science and Technology, Vol. 09, Issue, 12, pp.9116-9121, December
Molecular Structure of Rose-Bengal and Organic Acceptors
IR Spectrum of Rose Bengal (RB)
Nature of Transition of RB
Figure 2(d). Square Power Beta Density at Very Low Frequency
Figure 3(a). IR Spectrum of RB-Chloranil
Figure 3(b). Nature of Transition
Figure 3(c). Half-Power Beta Density Below Eg
Figure 3(d). Square-Power Beta Density at Very Low Frequency 9118 Asian Journal of Science and Technology,
Square Power Beta Density at Very Low Frequency
Chloranil
Nature of Transition
Power Beta Density Below Eg
Power Beta Density at Very Low Frequency
Figure 4(a). IR Spectrum of RB
Figure 4(b) Nature of Transition
Figure 4(c). Half-Power Beta Density Below E
Figure 4(d). Square-Power Beta Density at Very Low Frequency
Figure 5(a). IR Spectrum of RB Asian Journal of Science and Technology, Vol. 09, Issue, 12, pp.9116-9121, December
IR Spectrum of RB-DDQ
Figure 4(b) Nature of Transition
Power Beta Density Below Eg
Power Beta Density at Very Low Frequency
Figure 5(b). Nature of Transition
Figure 5(c). Half-Power Beta Density
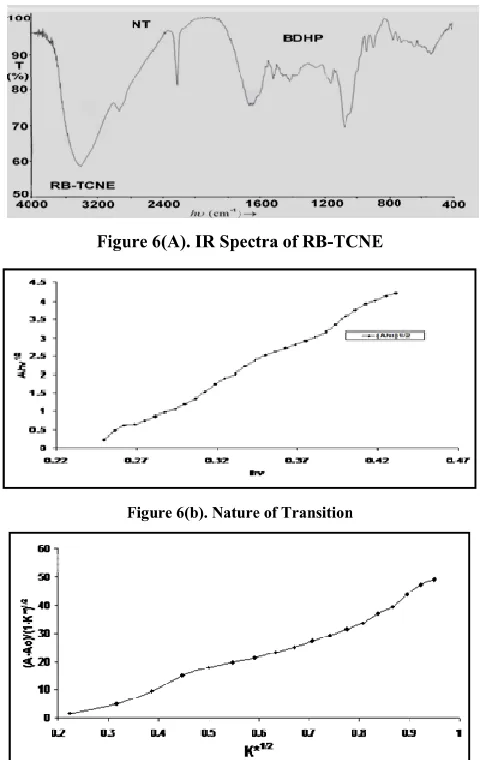
Figure 6(A). IR Spectra of RB-TCNE
Figure 6(b). Nature of Transition
Figure 6(c). Half-Power Beta Density Below Eg
This is a fluctuation in beta density arising from a non-linear equation of state for polarons as the polaron gas is an imperfect gas satisfying lever rule (A.T.Ozaet.al.1998). This is shown to be related to an equation such as.
(2)
for frequency-dependent dielectric constant (C.Kittel 1974). Other interpretation for this property for hv>Eg and hv<Eg comes from the Airy function; Eg being the saddle point. For hv>Eg and hv>>Eg,
(3)
as (A.D.Myskis 1975) is proportional h -(A.I.Anselm1981) as in the Franz-Keldysh or Redfield effect (Pankove 1971,L.V.Keldysh 1958) which is tunneling induced by external or internal electric field. Thus dispersion-shaped modulation of beta density is due to an arrival of a second precursor of an electromagnetic signal in a dispersive medium (Jackson 1975). Below 900 cm-1, there is a square-power beta density satisfying
(4)
Where, . This is related with hopping with involvement of optical phonons and usually found in ionic materials. Low-frequency vibrations like twisting, rocking, wagging and group vibrations are involved in this case. The above optical properties can be explained with a mixed phonon gas in insulators (Landau et al. 1981). Acoustic and optical phonons are mixed in a phonon gas. The acoustic phonons assist in the hopping conduction of charge carriers providing half power beta density. The optical phonons assist in the hopping transport and create square-power beta density. There is an imperfect (non-ideal) polaron gas determining the optical properties. Second is spectrum of Rose Bengal-Chloranil complex (Figure 3a). Here although the property is same as Rose Bengal for h >Eg, it is a forbidden direct transition
obeying law (Figure 3b). Below Eg, there are several precursors below 1600 cm-1 described by the generalized functions of the Airy function. The Airy function giving rise to oscillatory behavior below h <Eg is defined as
(5)
For , equation 3 is obeyed. For < 0, there is oscillatory behavior. This is found between 1600 cm-1 and 1200 cm-1. The line shape repeating several times however do not seem to be arising from integration of a cosine function. The bands are much sharper being more like a - function or resonance line shape (oscillator model). This seems to be like a generalization of the Airy function which is related with
Bessel functions like and which are special cases of confluent hyper geometric functions. Cosine as an integrand in equation 5 is too simple to explain the quantitative behavior of the oscillatory function.
2 2
2 2
( ) ( )
L
1 3
4 2
1 2
( ) exp( )
3 2
i
A K K K
K
K
E
g2 1
* * 2
(1
)
AK
K
* (K a)
K b
3 2( g)
h A h E
3
0
1
1
( )
cos(
)
3
i
A K
t
Kt dt
K K
1 3
J 1 3
J
Although there is overall half-power beta density below Eg the modulation leads to nonlinear optical property (Figure 3c). The oscillatory behavior markedly differs from those arising from complex band gap (Alexander 1977,A.T.Oza). Square-power beta density below 800 cm-1 arising from optical phonons is also fitted (Figure 3d). The spectrum of Rose Bengal-DDQ is also shown (Figure 4a). Here too, the oscillatory behavior is clearly revealed between 1700 cm-1 and 900 cm-1. The absorption dips are intense but broad while the absorption peaks are intense but sharp. This characteristic can be described by generalization of even the Airy function as discussed above. Egb is a saddle point. Acoustic phonon induced the half-power beta density is modulated by the generalized Airy function. Above Eg, the forbidden direct
transition is found following absorption function (Figure4b). Half-power beta density is fitted for the average points due to modulation by general Airy function (Figure4c). The spectrum of Rose Bengal-TCNQ shows similar profile of transmission (Figure 5a). Even within the oscillatory region, noise is observed between 1400 cm-1 and 1600 cm-1. This may be related with enhancement of photoconductivity of TCNQ complex. The oscillations around half-power beta density horizontal line are very similar to RB-DDQ.
The sharp dips in absorption becomes broad and broad peaks in absorption becomes sharp mainly to preserve the area under
the band which is nothing but oscillator strength. The charge not contributing to absorption at a high frequency does so at low frequency. These changes are occurring in such a way that the lever rule of thermodynamics is obeyed. Here it corresponds to conservation of charge under such oscillations. Above , a forbidden indirect transition is found fitting
(Figure 5b). The average transmission obeys half-power beta density in mid-IR range (Figure5c). The low-frequency envelope is not square-power beta density but a triangular distribution. This is clearly seen below 800 cm-1 (Figure 5a). The spectrum of Rose Bengal-TCNE is also shown (Figure 6a). For hv>Eg, the absorption coefficient follows an allowed indirect transition with
as a power law (Figure 6b). Below the saddle point at Eg, oscillatory function, which is related, with Airy function is found to follow. The average profile in the mid-IR range below Eg is found to fit half-power beta density (Figure 6c). The low frequency background envelope is again a triangular distribution. Similar to that in RB-TCNQ spectrum (Table 1 summarized salient optical properties of CT complexes).
Conclusion
Although Rose Bengal and its CT complexes are photoconductors like many other dyes and their CT complexes, the spectral features show very unique characteristic. For the first time, among many other organic semiconductors to compare with, we are finding modulation-sinusoidal oscillations described by the Airy function and the more generalized function. The later may be related with non-linear optical property of the medium.
Acknowledgement
The authors are indebtful to the Dean, Department of Physics, Sardar Patel University towards supporting the research work. We also acknowledge support and warmth received by fellow colleagues at the department and student friends.
REFERENCES
Akerlind, C., Arwin, H., Jakobsson, F.L.E., Kariis, 1, H., Jarrendahl. K. 2011. Thin Solid Films. “Optical properties and switching of a Rose Bengal derivative: A spectroscopic ellipsometry study”. 519, 11. (p. 3582–3586)
Alexander O.E. 1977. Animalu, Intermediate Quantum Theory of Crystalline Solids, Eaglewood Cliffs, New Jersey, Prentice Hall, 1977 (p.297). A.T.,Oza Communicated). Anselm, A.I. 1981. Introduction to Semiconductor Theory,
Mir Publishers, Moscow,(p.452).
Basudev Pradhan, Sudip K. Batabyal and Amlan J. Pal. 2007. Solar Energy Materials and Solar Cells. “Vertically aligned ZnO nanowire arrays in Rose Bengal-based dye-sensitized solar cells”. 91, 9, (p. 769–773)
Gangotria, K.M. and Mahesh Kumar Bhimwal. Solar Energy. “Study the performance of photogalvanic cells for solar energy conversion and storage: Rose Bengal–d-Xylose– NaLS system”. 84, 7, 2010. (p. 1294–1300)
Gutman F. and Lyons, L.E. 1982. Organic Semiconductors, John Wiley & Sons, New York, (p.206).
Jackson, J.D. 1975. Classical Electrodynamics, 2nd Edition, Wiley Eastern Ltd., New Delhi, (p.302).
Keldysh, L.V. 1958. Soviet Physics-JETP, 7, 788.
Kittel, C. 1974. Introduction to Solid State Physics, 4th Edition, Wiley Eastern, New Delhi,(p.)
Landau, L.D. and Lifshitz, E.M. 1981. Physica Kinetics, Course of Theor. Phys., Vol.10, Pergamon Press, (p.302). Larson, H.J. 1982. Introduction to Probability Theory and
Statistical Inference, 3rd Edition, John Wiley & Sons, New York, (p.206)
Mahesh Chandra, Anoop Singh and R. C. Meena. 2012. “Role of Rose Bengal-Mannitol system for generation of
3 2
( g)
h A h E
d
g g
K E
3
( g p)
h A h E E
2
( g p)
h A h E E
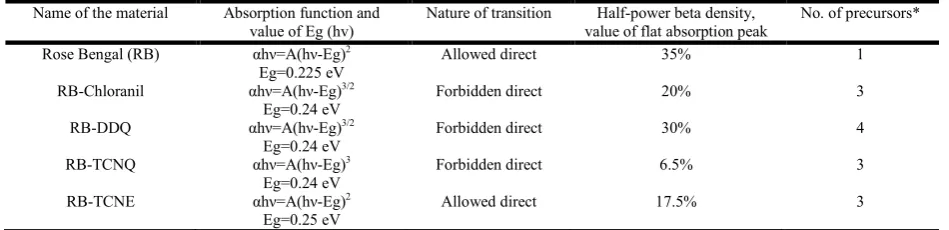
Table 1. Mid-IR analysis of infrared spectra of Rose Bengal & its CT complexes
Name of the material Absorption function and value of Eg (hv)
Nature of transition Half-power beta density, value of flat absorption peak
No. of precursors*
Rose Bengal (RB) αhν=A(hν-Eg)2 Eg=0.225 eV
Allowed direct 35% 1
RB-Chloranil αhν=A(hν-Eg)3/2
Eg=0.24 eV
Forbidden direct 20% 3
RB-DDQ αhν=A(hν-Eg)3/2
Eg=0.24 eV
Forbidden direct 30% 4
RB-TCNQ αhν=A(hν-Eg)3
Eg=0.24 eV
Forbidden direct 6.5% 3
RB-TCNE αhν=A(hν-Eg)2
Eg=0.25 eV
Allowed direct 17.5% 3
*Number of precursors reveals mechanical softness giving rise to non-linear optical properties.
electrical energy in photogalvanic cell”. International Journal of Physical Sciences. 7, 42,. (p. 5642-5647). Mukulika Jana Chatterjee, Dipali Banerjee, Amrita Ghosh
and Anup Mondal. 2016. AIP Conference Proceedings. “The dopant dependent photocatalytic activity of polyaniline towards the degradation of Rose Bengal dye”. 1728, 1.
Myskis, A.D. 1975. Advance Mathematics for Engineers, Mir Publishers, Moscow, (p. 644).
Oza A.T. and Vinodkumar, P.C. 1998. Ind. J. Physics. (India), 72A, 171.
Pankove, J.I. 1971. Optical processes in Semi-conductors, Prentice-Hall Inc., Eaglewood Cliffs, New Jersey.
Parimal Trivedi, Ashok Patel, R.G. Patel, V.A. Patel and A.T. Oza, 2005. Ind. J. Pure &Appl.Phys., 43,335.
Parimal, H. Trivedi, Ph.D. 2005. Thesis, Spectroscopic study of charge transfer complexes of organic photoconductors, S.P.University, VallabhVidyanager, Gujarat, India.
Roy, M.S., Balraju Manish Kumar P. and Sharma. G.D. 2008. Solar Energy Materials & Solar Cells. “Dye-sensitized solar cell based on Rose Bengal dye and nanocrystalline TiO2”. 92, (p. 909– 913).
Sadia Ameen, Hyung-Kee Seo, M. Shaheer Akhtar and Hyung Shik Shin. 2012. “Novel graphene/polyaniline nanocomposites and its photocatalytic activity toward the degradation of rose Bengal dye”. Chemical Engineering Journal. 210. (p. 220–228).
Sawsan A. Mahmoud, H. Atia and Samar H. Bendary. 2016. Solar Energy.“Synthesis of a high efficiency novel working electrode scandium/ HOMBIKAT in dye-sensitized solar cells”. 134, (p. 452–460).
Supriya Bapurao Jambure, Girish Sambhaji Gund, Deepak Prakash Dubal, 2014. Sujata SureshraoShinde and Chandrakant Dnyandev Lokhande. Electronic Materials Letters. “Cost Effective Facile Synthesis of TiO2 Nanograins for Flexible DSSC Application Using Rose Bengal Dye”. 10, 5,. (p. 943-950).
Takeo OKU, Nariaki KAKUTA, Kengo KOBAYASHI, Atsushi SUZUKI and Kenji KIKUCHI. 2011. Progress in Natural Science: Materials International. “Fabrication and characterization of TiO2-based dye-sensitized solar cells”.
21, 2. (p. 122–126).
*******