A New Over-sample Method Based on
Distribution Density
Kuoyi Shao
University of Science and Technology Beijing / School of Computer and Communication Engineering Department, Beijing, P.R.China
Yun Zhai
Chinese Academy of Governance / E-Government Research Center, Beijing, P.R.China
Haifeng Sui
University of Science and Technology BeijingSchool of Computer and Communication Engineering Department, Beijing, P.R.China
Changsheng Zhang
Wenzhou University / College of Physics & Electronic Information Engineering, Zhejiang, P.R.China Corresponding E-mail: [email protected]
Nan Ma
College of Information Technology, Beijing Union University, Beijing, 100101,China Corresponding E-mail: [email protected]
Abstract—A new method was proposed for leaning from the imbalanced dataset based the samples distribution density in this paper. In the proposed scheme, a model of samples distribution density was designed, followed by the improved smote progress SDD-SMOTE where we smoted the minority samples according to the samples distribution density. Cross-validation results show that proposed SDD-SMOTE method to some extent improves the minority prediction in both the recall and the precision metrics.
Index Terms—imbalanced dataset; knowledge discovery; over sample; distribution density
I. INTRODUCTION
Artificial intelligence techniques have been used in many real-world domains such as the scientific area, the business studies, the Internet mining and other applications. Learning from the imbalanced datasets are one of the popular domains of these applications [1], [2], [3], [4],[5]. When instances are inherently rare or hard to predict, the imbalanced data problem occurs.
In the classification problem field, the scenario of imbalanced data sets appears when the number of samples that represent the different classes is very different among them [6]. Class-imbalanced problems widely exist in the fields of medical diagnosis, fraud detection, network intrusion detection, science and engineering problems, and so on. A two-class data set is said to be imbalanced when one of the classes (the minority one) is heavily under-represented with regard to the other class (the majority one) [7][8][9]. This challenge comes from the fact that classifiers tend to predict the majority class in the presence of class imbalance. However, it is usually the minority class we
are most interested. As a result, addressing and solving imbalanced data problem is very critical for improving classification performance for the total dataset.
In this paper, we propose a novel scheme to solve the imbalanced data problem, a new over-sample method based on distribution density(SDD-SMOTE). The main part of our proposed scheme is the distribution density of samples (SDD) method. SDD-SMOTE builds a classifier by smote from a revised dataset from the original one according to the distribution density of samples.
This paper is organized as follows: in Section 2, we present related works. We present our SDD-SMOTE technique and overall SDD-SMOTE scheme in Section 3. Assessment metrics for imbalanced learning are reviewed in Section 4, which provides various suggested methods that are used to compare and evaluate the performance of different imbalanced learning algorithms. And then we show our empirical experiments and evaluate the results with other concerned method dealing with the imbalanced problem. Considering how learning from imbalanced data is a relatively new topic in data mining and knowledge discovery community, in Section 5, we present a detailed discussion on the opportunities and challenges for future research.
II.THE STATE-OF-THE-ART SOLUTIONS FOR IMBALANCED LEARNING
A. Random Oversampling Technology
oversampled samples from the minority class. This provides a mechanism for varying the degree of class distribution balance to any desired level. The oversampling method is simple to both understand and visualize, thus we refrain from providing any specific examples of its functionality[10].
Solberg considered the problem of imbalanced data sets in oil slick classification from SAR imagery. To better deal with this imbalance problem, he over-sampled (with replacement)100 samples from the oil slick, and then he randomly sampled 100 samples from the non oil slick class to create a new dataset with equal probabilities. He learned a classifier tree on this balanced data set and achieved a 14% error rate on the oil slicks in a leave-one-out method for error estimation; on the look alikes he achieved an error rate of 4%[11].
However, oversampling often involves making exact copies of samples which may lead to over-fitting [12]. B. SMOTE Method
To better address and solve the leaning problem from the imbalanced dataset, a combination of synthetic minority oversampling technique (SMOTE), a particular oversampling technique for the minority class, along with random undersampling for the majority class has been proposed in[6]. In this paper it is argued that regular oversampling by simple replication of minority cases affects the decision regions in feature space and may tend to overfitting, thus it is necessary to use sophisticated techniques in order to increase the number of samples in the minority classes [13]. The SMOTE algorithm is described as follows:
Algorithm SMOTE(T, N, k)
Input: Number of minority class samples T; Amount of SMOTE N%; Number of nearest neighbors k
Output: (N/100)* T synthetic minority class samples
(1) (∗ If N is less than 100%, randomize the minority class samples as only a random percent of them will be SMOTEd. ∗ )
(2) if N <100
(3) then Randomize the T minority class samples
(4)T = (N/100) ∗ T
(5)N = 100
(6) endif
(7)N = (int)(N/100)( ∗ The amount of SMOTE is assumed to be in integral multiples of 100. ∗ )
(8)k = Number of nearest neighbors
(9)numattrs = Number of attributes
(10)Sample[ ][ ]: array for original minority class samples
(11)newindex: keeps a count of number of synthetic samples generated, initialized to 0
(12)Synthetic[ ][ ]: array for synthetic samples
(13) for i ←1 to T
(14) Compute k nearest neighbors for i, and save the indices in the nnarray
(15) Populate(N, i, nnarray)
(16) endfor
Populate(N, i, nnarray) (∗ Function to generate the synthetic samples. ∗ )
(17) while N ≥ 0
(18) Choose a random number between 1 and k, call it nn. This step chooses one of the k nearest neighbors of i.
(19) for attr ←1 to numattrs
(20) Compute: dif = Sample[nnarray[nn]][attr] − Sample[i][attr]
(21) Compute: gap = random number between 0 and 1
(22)Synthetic[newindex][attr] = Sample[i][attr] + gap
∗ dif
(23) endfor
(24)newindex++
(25)N = N −1
(26) endwhile
(27) return (∗ End of Populate. ∗ )
End.
The SMOTE algorithm has shown better performance the the ordinary methods in many situations [12-13]. C. Advanced SMOTE Method
The SMOTE algorithm generates synthetic minority samples to over-sample the minority class. For every minority sammple, its k (which is set to 5 in SMOTE) nearest neighbors of the same class are calculated, then some samples are randomly selected from them according to the over-sampling rate. After that, new synthetic examples are generated along the line between the minority example and its selected nearest neighbors.
The SMOTE algorithm was modified several times, trying to generate more positive samples. Han proposed a Borderline-SMOTE algorithm [14] to improve the SMOTE method. Borderline-SMOTE copy only positive samples close to the decision boundary feature space, and these samples are the most likely to be misclassified. Experiments show that, Borderline-SMOTE obtained better classification performance the pure SMOTE. Alexander Liu proposed a generative oversampling technology [15], learning new data points from the data points and shows good performance in the text classification data set.
used the R-S method to increase the number of the minority randomly in the minority sample space until it is almost equal to the majority in data mining tasks. 5 UCI imbalanced data sets are balanced with the integrated data mining process. Log it algorithm is used for classification with these data sets. The result shows that the integrated use of R-S in data mining can improve the performance of the classifier significantly.
SMOTEBoost algorithm [17] combines SMOTE technique and the standard boosting procedure. It utilizes SMOTE for improving the accuracy over the minority class and utilizes boosting not to sacrifice accuracy over the entire data set. Wang et al. [18] propose an adaptive over-sampling technique based on data density (ASMOBD), which can adaptively synthesize different number of new samples around each minority sample according to its level of learning difficulty. Gao et al. [19] propose probability density function estimation based over-sampling approach for two-class imbalanced classification problems.
III. THE SDD-SMOTEIMPLEMENTATION
According to common sense, the bigger a sample distribution density is, the more other samples around it. For most classifiers, e.g., the decision tree classifier, they will produce more leaf nodes when it tends to over-fitting. Based on this, a new method of SDD-SMOTE algorithm based on sample distribution density (SDD) is proposed here. More details are described as follows.
The distance dxybetween sample xand
y
is defined as formula 1:dxy = 1
2 2 1 1 1 ( ) ( ) i i i i l x y i l l x y i i w w w w = = = ⋅ − ⋅
∑
∑
∑
(1)Where l is the length of the features of the samples,
i
x
w
andw
yj are the weights of the jth feature of the sample x and y.Definition 1. For ∀ ∈ Ωx ', if yi∈ Ω' is the ith nearest neighbor of sample x, the density matrix constructed by x and its k neighbors can be described as DM=( )dij t*k
Where k is the number of the neighbors of sample x ,t is the number of the total samples, and 1≤ ≤i k, then we get 1 1 k i j ij z d =
=
∑
(2)Then we normalized
z
i,'
1
( )i i
n i i z density z z = =
∑
(3)And we further calculate the SMOTEed samples for every sample x
( )i
SMOTEfactor x =(⎡⎢1−density x( )) *i k⎤⎥ (4) Now we can implement the SDD-SMOTE algorithm. More details are described as follows:
Algorithm SDD-SMOTE(TSMOTEfactor x( )i , k)
Input: Number of minority class samples T; Amount of SMOTE SMOTEfactor x( )i ; Number of nearest
neighbors k
Output: ( SMOTEfactor x( )i )* T synthetic minority
class samples
(1)k = Number of nearest neighbors
(2)numattrs = Number of attributes
(3) Sample[ ][ ]: array for original minority class samples
(4)newindex: keeps a count of number of synthetic samples generated, initialized to 0
(5)Synthetic[ ][ ]: array for synthetic samples
(6) for i ←1 to T
(7) Compute k nearest neighbors for i, and save the indices in the nnarray
(8) Populate(N, i, nnarray)
(9) endfor
Populate(SMOTEfactor x( )i , i, nnarray) (∗ Function
to generate the synthetic samples. ∗ )
(10) while SMOTEfactor x( )i ≥0
(11) Choose a random number between 1 and k, call it nn. This step chooses one of the k nearest neighbors of i.
(12) for attr ←1 to numattrs
(13) Compute: dif = Sample[nnarray[nn]][attr] − Sample[i][attr]
(14) Compute: gap = random number between 0 and 1
(15) Synthetic[newindex][attr] = Sample[i][attr] + gap ∗ dif
(16) endfor
(17) newindex++
(18) SMOTEfactor x( )i = SMOTEfactor x( )i −1
(19) endwhile
(20) return (∗ End of Populate. ∗ ) End.
IV.EXPERIMENTS AND RESULTS A. Datasets
TABLE I.
DESCRIPTION OF UCI DATA SETS
Data Set Attributes Concept/ Counter -concept Positive samples
Negative
samples Imbalance ratio
German 20 Bad/Good 300 700 2.33
Vehicle 18 Van/Remainder 199 647 3.25
Satimage 38 4/Remainder 626 5809 9.28
Nursery 8 Not-recom/Remainder 328 12632 38.51
B. Performance Measures
To evaluate the utility of the various feature selection methods, we use the F-measure, a measure that combines precision and recall. Precision is defined as the ratio of correct categorization of documents into categories to the total number of attempted classifications, namely,
True Positive Precision =
True Positive + False Positive (5)
Recall is defined as the ratio of correct classifications of documents into categories to the total number of labeled data in the testing set, namely,
True Positive Recall =
True Positive+ False Negative (6) F - measure is defined as the harmonic mean of precision and recall. Hence, a good classifier is assumed to have a high F - measure, which indicates that the classifier performs well with respect to both precision and recall, namely,
2* Precision* Recall F - measure =
Precision + Recall
(7)
*
TP TN
G - mean
TP FN TN FP
=
+ +
(8)
Kubat and Matwin electively under-sampled the instances in the majority class while keeping the original instances in the minority class. They have used the geometric mean as a performance measure for the classifier, which can be related to a single point on the ROC curve. The minority examples were divided into four categories: some noise overlapping the positive class decision region, borderline samples, redundant samples and safe samples[4].
Figur1. ROC curve
C. Performance Results
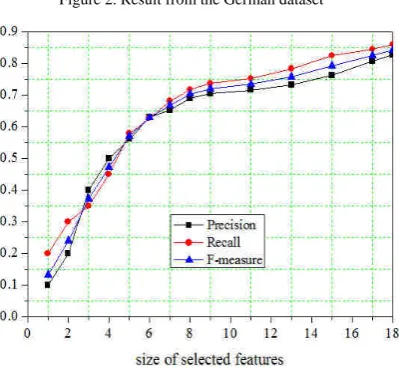
• Performance with the size of the selected features To evaluate the performance of the SDD-SMOTE algorithm, we firstly carry out the experiments with the different size of the selected features for the 4 UCI data sets with conspicuous discrimination in imbalance ratio and data distribution. For each of the 4 datasets, results are averaged over ten standard 10-fold cross validation (CV) experiments and we employ the SVM classifier. In each fold nine out of ten samples are selected to be training set, and the left one out of five samples is testing set. This process repeats 10 times so that all samples are selected in both training set and testing set.
Experimental results are shown as described in figure 2 to figure 5.
Figure 2. Result from the German dataset
Figure 3. Result from the Vehicle dataset
Figure 4. Result from the Satimage dataset
Figure 5. Result from the Nursery dataset
• Effect of noise to performance
To better test the SDD-SMOTE performance, we employed the different noise ratio as reference [21] in the four datasets Vehicle、German、Nursery and Satimage. We implied the four different noise
ratioγ=0%,γ=5%,γ=10% and γ=15%, the SVM as the base classifier, ten standard 10-fold cross validation, and the F - measure as the performance measure. CV results are described as follows:
TABLE II.
CV RESULT ON THE GERMAN DATASET
Noise rate Algorithm/Classifier
SDD-SMOTE ROR SMOTE RUR
γ=0%
SVM 2-2-6 3- 3- 4 3- 2- 5 2- 4-4
RUR 2- 4- 4 4- 2- 4 2- 3- 5
SMOTE 3- 3- 4 5- 3- 2
ROR 2- 4- 4
γ=5%
SVM 2-1-7 2- 3- 5 2- 2- 6 2- 4-4
RUR 2- 4- 4 4- 2- 4 2- 3- 5
SMOTE 3- 2- 5 5- 4- 1
γ=10%
SVM 1-2-7 2- 2- 6 2- 1- 7 2- 2-6
RUR 2- 3- 5 3- 4- 3 2- 2- 6
SMOTE 3- 3- 4 5- 3- 2
ROR 2- 1- 7
γ=15%
SVM 0-1-9 2- 1- 7 1- 2- 7 2- 2-6
RUR 1- 5- 4 4- 2- 4 2- 2- 6
SMOTE 3- 2- 5 6- 3- 1
ROR 0- 3- 7
TABLE III.
CV RESULT ON THE VEHICLE DATASET
Noise rate Algorithm/Classifier SDD-SMOTE ROR SMOTE RUR
γ=0%
SVM 2-1-7 3- 2- 5 3- 3- 4 3- 2-5
RUR 3- 1- 6 4- 2- 4 2- 4- 4
SMOTE 4- 1- 5 5- 3- 2
ROR 3- 2- 5
γ=5%
SVM 2-0-8 2- 3- 5 2- 2- 6 2- 4-4
RUR 2- 3- 5 4- 2- 4 2- 3- 5
SMOTE 3- 2- 5 6- 3- 1
ROR 2- 3- 5
γ=10%
SVM 1-1-8 2- 3- 5 2- 2- 6 2- 3-5
RUR 2- 3- 5 3- 4- 3 2- 2- 6
SMOTE 3- 3- 4 5- 3- 2
ROR 2- 3- 5
γ=15%
SVM 1-0-9 2- 1- 7 2- 0- 8 2- 1-7
RUR 2- 2- 6 3- 3- 4 2- 2- 6
SMOTE 3- 3- 4 6- 3- 1
ROR 0- 2- 8
TABLE IV.
CV RESULT ON THE SATIMAGE DATASET
Noise rate Algorithm/Classifier SDD-SMOTE ROR SMOTE RUR
γ=0%
SVM 4-1-5 3- 5- 2 3- 4- 3 2- 5-3
RUR 3- 3- 4 3- 3- 4 3- 4- 3
SMOTE 3- 4- 3 2- 5- 3
γ=5%
SVM 3-2-5 3- 3- 4 3- 2- 5 2- 6-2
RUR 3- 3- 4 3- 2- 5 2- 4- 4
SMOTE 3- 3- 4 3- 4- 3
ROR 3- 3- 4
γ=10%
SVM 2-2-6 3- 3- 4 2- 3- 5 2- 4-4
RUR 3- 2- 5 4- 2- 4 2- 4- 4
SMOTE 3- 3- 4 4- 2- 4
ROR 3- 2- 5
γ=15%
SVM 2-2-6 2- 3- 5 1- 2- 7 2- 4-4
RUR 2- 4- 4 4- 2- 4 2- 3- 5
SMOTE 4- 2- 4 5- 3- 2
ROR 2- 1- 7
From table 1 to table 4 we can find the CV results of SDD-SMOTE and other algorithms. Every number, e.g., 2-2-6 in the first place of the table 2, represents the times of performance results of the SVM and the SDD-SMOT, i.e., in the ten standard 10-fold cross validation, the performance times of the SVM better than the SDD-SMOTE is 2, equal to the SDD-SDD-SMOTE is 2, and worse than the SDD-SMOTE is 6. We can get the conclusion that the SDD-SMOTE shows better performance in all the four UCI data sets with different noise rate.
V.CONCLUSION AND FUTURE WORK
In this paper, we described our SDD-SMOTE learning method based on distribution density to solve the imbalanced data problem. Since some classes are not trained well when data are imbalanced, the imbalanced data cause serious performance degradation for the classification. To better address this issue, the SDD-SMOTE smoted special samples according to their distribution density.
Our method of SDD-SMOTE works to cause the classifier to build larger decision regions that contain nearby minority class points. The same reasons may be applicable to why SDD-SMOTE performs better than SVM, RUR, ROR and pure SMOTE. SDD-SMOTE provides density based minority class samples to learn from, thus allowing a learner to carve broader decision regions, leading to more coverage of the minority class.
To verify the effectiveness of our SDD-SMOTE, we experiment with for real-world UCI data sets with different feature sizes, and the empirical results show that the SDD-SMOTE performs better than concerned methods. We expect that our SDD-SMOTE can be applied to other real-world data mining applications, where we suffer from the imbalanced data problem.
Future work may consider additional learners, e.g., different variations of SVM or neural network classifiers.
SDD-SMOTE can also be compared to cost-sensitive learning in future work. Alternative measures of classifier performance can also be analyzed. Future work should also consider employing the SDD-SMOTE in the context of multi-class and one-class learning[22] even in the more complex environment[23].
ACKNOWLEDGMENT
We would also like to thank the anonymous reviewers for their various insightful comments and suggestions. This work was supported by grants from National Science Foundation of China under Grant No. 61300078, the Project of Chinese Academy of Governance under Grant No. 2012ZBKT016 and the Project of Zhejiang provincial Natural Science Foundation of China under Grant No. LY13F020024.
REFERENCES
[1] P. K. Chan and S. J. Stolfo, “Toward scalable learning with
nonuniform class and cost distributions: A case study in credit card fraud detection ,” Proceedings of the Fourth International Conference on Knowledge Discovery and Data Mining, p. 168,1998.
[2] C. Phua, D. Alahakoon and V. Lee, “Minority report in
fraud detection:Classification of skewed data,” SIGKDD Explore, vol.6, pp. 50-59,2004.
[3] D. Lewis and W. Gale, “A sequential algorithm for training
text classifiers,” Proceedings of the Seventh Annual International ACM SIGIR Conference on Research and Development in Information Retrieval. Dublin, Ireland, p.3, 1994.
[4] M. Kubat., R. C. Holte and S. Matwin,“Machine Learning
for the Detection of Oil Spills in Satellite Radar Images,” Machine Learning, vol. 30, pp. 195-215,1998.
[5] R. Pearson, G. Goney, and J. Shwaber, “Imbalanced
[6] N.V.Chawla,, K.W. Bowyer, L.O. Hall and W. P. Kegelmeyer, “SMOTE: Syntehetic Minority Over-sampling Technique,” Journal of Artificial Intelligence Research, vol.16, pp. 321-357, 2002
[7] N.Japkowicz and S. Stephen, “The class imbalance
problem: a systematic study,” Intelligent Data Analysis, vol.6, pp. 429–449 , 2002.
[8] H. He and E.Garcia, “Learning from imbalanced data,”
IEEE Trans. on Knowledge. and Data Engineering, vol.9, pp. 1263–1284, 2009.
[9] Y. Zhai and B. R. Yang, “Application of the Condensed
Set Based on Cooperative Coevolution in Imbalanced Datasets Classification,” International Journal of Advancements in Computing Technology, vol. 3, pp. 62-69, 2011.
[10]H.b. He and E. A. Garcia, “Learning from Imbalanced
Data,” IEEE Transactions on Knowledge and Data Engineering,vol. 21, pp. 1263-1284,2009.
[11]A.Solberg and R. Solberg, “A Large-Scale Evaluation of
Features for Automatic Detection of Oil Spills in ERS SAR Images,” In International Geoscience and Remote Sensing Symposium. Lincoln, p. 1484–1486, 1996.
[12].C. Drummond, R. C. Holte. “C4.5 decision tree, class
imbalance, and cost sensitivity: why under-sampling beats over-sampling,” in Workshop on Learning from Imbalanced Data Sets II, International Conference on Machine Learning, 2003.
[13]S. Daskalaki, I. Kopanas and N. Avouris, “Evaluation of
classifiers for an uneven class distribution problem,” Applied Artificial Intelligence, vol. 20, pp. 381-417, 2006.
[14]H. Han, W. Y. Wang and B. H. Mao, “Borderline smote: a
new oversampling method in imbalanced data sets learning,”Lecture Notes in Computer Science, vol. 3644, pp. 878-887, 2005.
[15]A. Liu, J. Ghosh and C. Martin, “Generative oversampling
for mining imbalanced datasets,” Proceedings of 2007 International Conference on Data Mining. LasVegas, Nevada, USA, p. 66-72, 2007.
[16]Jia Li, Hui Li and Jun Ling Yu, "Application of
Random-SMOTE on Imbalanced Data Mining," the Fourth International Conference on Business Intelligence and Financial Engineering , p.130-133, 2011.
[17]N. V. Chawla, A. Lazarevic, L. O. Hall, and K. W. Bowyer,
“Smoteboost: Improving prediction of the minority class in boosting,” In Knowledge Discovery in Databases: PKDD 2003, pp. 107–119, 2003.
[18] S. Wang, Z. Li, W. Chao, and Q. Cao, “Applying adaptive
over-sampling technique based on data density and cost-sensitive SVM to imbalanced learning,” The 2012 International Joint Conference on Neural Networks ,p.1-8, 2012.
[19]M. Gao, X. Hong, S. Chen and C. J. Harris, “Probability
density function estimation based over-sampling for imbalanced two-class problems” 2012 International Joint Conference on Neural Networks, p. 1-8,2012.
[20]http://svmlight.joachims.org/.
[21]T. G. Dietterich, “An experimental comparison of three
methods for constructing ensembles of decision trees: bagging,boosting,and randomization,” Machine Learning, vol.40, pp. 139-157,2000.
[22]Lin Li,Qi-zhi Zhang,Nurzat Rasol. “Time-Varying Sliding
Mode Adaptive Control for Rotary Drilling System,” Journal of Computers, vol.6, pp. 564-570, 2011.
[23]Kai Zhang, Jun Yao,Liming Zhang,Yajun Li. “Dynamic
Real-time Optimization of Reservoir Production”, Journal of Computers, vol.6, pp. 610-617, 2011.
Kuoyi Shao, born in Shandong province in China in 1970, senior engineer, Ph.D candidate. Kuoyi Shao obtained his bachelor studying in the famous Tsinghua University in 1993. Now he read his PhD studying in university of science and technology Beijing from 2010 year.
His interests include data mining and knowledge discovery from the complex systems.
Yun Zhai, born in Shandong province in China in 1979, Ph.D.,Yun Zhai obtained his Ph.D. degree in 2012 from university of science and technology Beijing. His current research interests include knowledge discovery and e-government intelligence.
Haifeng Sui, born in 1977, post Ph.D candidate,his current research interests include knowledge discovery and business intelligence.