CODEN (USA)-IJPRUR,e-ISSN: 2348-6465
Original Article
Dualwavelength & Q-Absorption Ratio Spectrophotometry
Methods Development and Validation for Simultaneous
Estimation of Metoprolol Succinate and Chlorthalidone in
Bulk and Dosage Form
Raval Kashyap1, *, U Srinivasa2
1
Research Scholar, Department of Pharmacy, Pacific University, Udaipur, India
2
Head of Department, Srinivas College of pharmacy, Mangalore, India
A R T I C L E I N F O A B S T R A C T
_______________________________________________________________________________
1. INTRODUCTION
Metoprolol succinate is a beta1-selective (cardio
selective) adrenoceptor blocking agent, for oral
International Journal of Pharma Research and Health Sciences
Available online atwww.pharmahealthsciences.net
Received: 10 Nov 2014
Accepted: 22 Dec 2014 To develop and validate a simple & accurate Spectrophotometry methodsfor simultaneous estimation of Metoprolol Succinate and Chlorthalidone in their combined pharmaceutical dosage form. Two simple, accurate, precise U.V Spectroscopy methods have been developed. First method was based on Dual wavelength method. Here 297 nm & 267.22 nm selected for the estimation of Metoprolol Succinate where Chlortahlidone show same absorbance. Other 281 nm & 268.96nm selected for estimation of Chlorthalidone where Metoprolol Succinate show same absorbance. The second method was the Q-Absorption method, where 263.51 nm (Isoabsorptive point) was selected as λ1 and λ2 was selected any one form other two components (275nm Metoprolol Succinate). Metoprolol Succinate and Chlorthalidone showed linearity in the range of 20-100μg/ml and 5- 25μg/ml respectively in both methods. Both methods were validated by validation parameters and it show result where lie within its acceptance criteria as per ICH Q2 (R1) guideline. Hence, it can be successfully used for the routine analysis of Metoprolol Succinate and Chlorthalidone in their combined pharmaceutical dosage forms.
Keywords: Metoprolol Succinate, Chlorthalidone, Methanol and Validation parameter
Keywords:Ambroxol, HPLC, Salbutamol.
Corresponding author *
Raval Kashyap, Research Scholar, Department of Pharmacy, Pacific
administration, available as extended-release tablets.
TOPROL-XL has been formulated to provide a
controlled and predictable release of Metoprolol for
once-daily administration. The tablets comprise a
multiple unit system containing Metoprolol succinate
in a multitude of controlled release pellets. Each pellet
acts as a separate drug delivery unit and is designed to
deliver Metoprolol continuously over the dosage
interval. Its chemical name is (±)1(isopropyl
amino)-3-[p-(2-methoxyethyl) phenoxy]-2-propanol succinate
(2:1) (salt). Its Molecular formula and Molecular
weight are (C15H25NO3)2 • C4H6O4 and 652.8
respectively. With structural formula is:
Metoprolol succinate is a white crystalline powder. It
is freely soluble in water, soluble in methanol,
sparingly soluble in ethanol, slightly soluble in
dichloromethane and 2-propanol, practically insoluble
in ethyl-acetate, acetone, diethyl ether and heptane. It
is indicated for the treatment of hypertension, to lower
blood pressure. Lowering blood pressure lowers the
risk of fatal and non-fatal cardiovascular events,
primarily strokes and myocardial infarctions. These
benefits have been seen in controlled trials of
antihypertensive drugs from a wide variety of
pharmacologic classes including Metoprolol.
Chlorthalidone is an antihypertensive/diuretic tablets
for oral use. It is a monosulfamyl diuretic that differs
chemically from thiazide diuretics in that a double ring
system is incorporated in its structure. It is a racemic
mixture of
2-chloro-5-(1-hydroxy-3-oxo-1-isoindolinyl) benzene sulfonamide, with the following
structural formula:
Its Molecular formula and Molecular weight are
C14H11ClN2O4S & 338.766 respectively.1
Chlorthalidone is practically insoluble in water, in
ether and in chloroform, soluble in methanol, slightly
soluble in alcohol. Chlorthalidone is a long-acting oral
diuretic with antihypertensive activity. Its diuretic
action commences a mean of 2.6 hours after dosing and
continues for up to 72 hours. The drug produces
diuresis with increased excretion of sodium and
chloride. The diuretic effects of Chlorthalidone and the
Benzothiadiazine (thiazide) diuretics appear to arise
from similar mechanisms and the maximal effect of
Chlorthalidone and the thiazides appear to be similar.
The site of the action appears to be the distal
convoluted tubule of the nephron. The diuretic effects
of Chlorthalidone lead to decreased extracellular fluid
volume, plasma volume, cardiac output, total
exchangeable sodium, glomerular filtration rate, and
renal plasma flow. Still now some methods publish on
Metoprolol succinate and Chlorthalidone 1-6 but no
Dual wavelength and Q-absorption method was
publish. So here its aim to be publish these methods
and to validated them as per the ICH guideline.2
2. MARTIALS AND METHODS
Instrumentation, Reagents and Material
Jasco UV-1800 UV spectrophotometer, Metoprolol
Succinate, Chlorthalidone, Methanol
Dual wavelength method
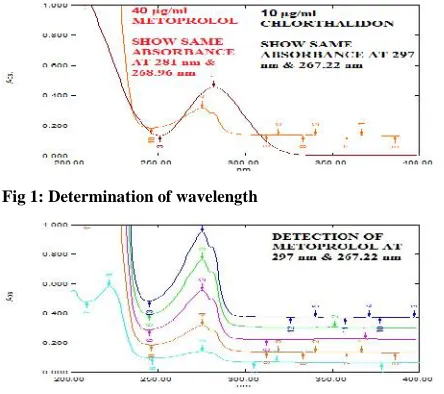
Determination of wavelength for measurement
4 ml of working standard solution of Metoprolol
Succinate (100 μg/ml) and 1ml of working standard of
Chlorthalidone (100 μg/ml) was diluted to 10 ml with
10 μg/ml of Chlorthalidone. Each solution was scanned
between 200-400 nm. The spectra of each solution
were obtained. Here 297 nm & 267.22 nm selected for
the estimation of Metoprolol Succinate where
Chlortahlidone show same absorbance. Other 281 nm
& 268.96nm selected for estimation of Chlorthalidone
where Metoprolol Succinate show same absorbance.
Absorption differences were calculated which shown in
figure no. 1.
Preparation of Calibration Curve:
Calibration STD curve for Metoprolol Succinate
(20-100μg/ml)
Calibration curve for Metoprolol Succinate consisted
of different concentrations of standard Metoprolol
Succinate solution ranging from 20-100 μg/ml. The
solutions were prepared by pipetting out 2,4,6,8, & 10
ml of the working standard solution of Metoprolol
Succinate (100 μg/ml) into series of 10 ml volumetric
flasks and the volume was adjusted to mark with
Methanol. Here 297 nm & 267.22 nm selected for the
estimation of Metoprolol Succinate where
Chlortahlidone show same absorbance. The
straight-line equation was determined by putting graph con VS
abs. And data was recorded in table no. 1 and figure
no. 2- 3.
Calibration STD curve for Chlorthalidone
(20-100μg/ml)
Calibration curve for Chlorthalidone consisted of
different concentrations of standard Chlorthalidone
solution ranging from 5-25 μg/ml. The solutions were
prepared by pipetting 0.5, 1, 1.5, 2 & 2.5ml of the
working standard solution of Chlorthalidone (100
μg/ml) into series of 10 ml volumetric flasks and the
volume was adjusted to mark with Methanol. Here 281
nm & 268.96nm selected for estimation of
Chlorthalidone where Metoprolol Succinate show same
absorbance The straight-line equation was determined
by putting graph con VS abs. And data was recorded in
table no. 1 and figure no. 4- 5.
Validation of proposed method
Linearity
The linearity response was determined by analyzing
independent levels of concentrations in the range of
20-100and 5-25μg/ml for Metoprolol Succinate and
Chlorthalidone respectively six times. Absorbance of
each solution was measured at selected wavelength.
The correlation coefficient and regression line
equations for Metoprolol Succinate and Chlorthalidone
were determined. Linearity of 6 concentrations was
measured six times.
Precision:
Repeatability
6 replicates of 40 μg/ml concentrations of Metoprolol
Succinate and 10 μg/ml of Chlorthalidone were
prepared and absorbance was measured at selected
wavelength. SD and RSD were calculated and recorded
in table no. 1.
Intraday Precision
Standard solutions containing 40, 60 & 80 μg/ml
Metoprolol Succinate and 10, 15 & 20 μg/ml
Chlorthalidone were analyzed 3 times on the same day.
Absorbance was measured at selected wavelength. SD
and RSD were calculated and recorded in table no. 1.
Interday Precision
Standard solutions containing 40, 60 & 80 μg/ml
Metoprolol Succinate and 10, 15 & 20 μg/ml
Chlorthalidone were analyzed 3 times on the three
different days. Absorbance was measured at selected
wavelength. SD and RSD were calculated and recorded
in table no. 1.
Accuracy
Accuracy is the closeness of the test results obtained by
the method to the true value. Recovery studies were
carried out by addition of standard drug to the pre
100 and 120 %) taking into consideration percentage
purity of added bulk drug samples. It was determined
by calculating the recovery of Metoprolol Succinate
and Chlorthalidone Sodium by standard addition
method. Absorbance of spiked samples was measured
and total amount of drug was calculated and from
which % recovery was calculated and recorded in table
no. 1.
Limit of Detection (LOD) & Limit of Quantification
(LOQ)
The LOD & LOQ are estimated from the set of 6
calibration curves used to determine method linearity.
LOD = 3.3 x (SD / Slope)
LOQ = 10 x (SD / Slope)
Where, SD = the standard deviation of Y- intercept of
6 calibration curves.
Slope = the mean slope of the 6 calibration curves.
Which are shown in table no 1
Analysis of marketed formulation:
The absorbance of the sample solution was measured at
selected wavelength. The concentration of each drug
was calculated. This is shown in table no. 2.
Q-ABSORPTION RATIO METHOD
Determination of wavelength for measurement
4 ml of working standard solution of Metoprolol
Succinate(100 μg/ml) and 1 ml of working standard of
Chlorthalidone (100 μg/ml) was diluted to 10 ml with
Methanol to get 40 μg/ml of Metoprolol Succinate and
10 μg/ml of Chlorthalidone. Each solution was scanned
between 200-400 nm. From the overlay spectra two
wavelengths 263.51 nm & 275 nm was selected as λ1
and λ2 for measurement. Where 263.51 nm
Isoabsorptive point of two components. Shown in
Figure no.6
Preparation of Calibration Curve
Calibration curve for Metoprolol Succinate at
263.51nm and 275 nm (20-100μg/ml)
Calibration curve for Metoprolol Succinate consisted
of different concentrations of standard Metoprolol
Succinate solution ranging from 20-100μg/ml. The
solutions were prepared by pipetting out 2,4,6,8, & 10
ml of the working standard solution of Metoprolol
Succinate (100 μg/ml) into series of 10 ml volumetric
flasks and the volume was adjusted to mark with
Methanol. Then spectra were measured at 263.51 nm &
275nm which show in Figure 7& figure 8 show
respectively.
Calibration curve for Chlorthalidone 263.51nm and
275 nm (5-25 μg/ml)
Calibration curve for Chlorthalidone consisted of
different concentrations of standard Chlorthalidone
solution ranging from 5-25 μg/ml. The solutions were
prepared by pipetting 0.5, 1, 1.5,2 & 2.5ml of the
working standard solution of Chlorthalidone (100
μg/ml) into series of 10 ml volumetric flasks and the
volume was adjusted to mark with Methanol. Then
spectra were measured at 263.51 nm & 275nm which
show in Figure 9 & figure 10 show respectively.3
Validation of proposed method
Linearity
The linearity response was determined by analyzing
independent levels of concentrations in the range of
20-100 and 5-25μg/ml for Metoprolol Succinate and
Chlorthalidone respectively six times. Absorbance of
solution was measured at 275nm and 263.51nm for
Metoprolol Succinate and Chlorthalidone. The
correlation coefficient and regression line equations for
Metoprolol Succinate and Chlorthalidone were
determined. Linearity of 6 concentrations was
measured six times.
Precision:
Repeatability
6 replicates of 40μg/ml concentrations of Metoprolol
Succinate and 10 μg/ml of Chlorthalidone were
263.51 nm. SD and RSD were calculated and recorded
in table no. 3.
Intraday Precision
Standard solutions containing 20, 40 &60μg/ml
Metoprolol Succinate and 5, 10 and 15μg μg/ml
Chlorthalidone were analyzed 3 times on the same day.
Absorbance was measured at 275 nm & 263.51. SD
and RSD were calculated and recorded in table no. 3.
Interday Precision
Standard solutions containing 20, 40 &60μg/ml
Metoprolol Succinate and 5, 10 and 15μg μg/ml
Chlorthalidone were analyzed 3 times on the three
different days. Absorbance was measured at 275 nm &
263.51 nm. SD and RSD were calculated and recorded
in table no. 3.4, 5
Limit of Detection (LOD) & Limit of Quantification
(LOQ)
Which are shown in table no 3
Analysis of marketed formulation:
The absorbances of the sample solution i.e. A1 and A2
were recorded at 275 nm (λ-max of Chlorthalidone)
and 263.51nm (isoabsorptive point) respectively. The
concentration of each drug was calculated using
equation below. This is shown in table no. 4.6
The concentration of two drugs in the mixture can be
calculated using following equations.
CX = [(QM–QY) / (QX -QY)] × A1/ax1... (1)
CY = [(QM – QX) / (QY -QX)] × A1/ay1 …………
(2)
Where, A1 and A2 are absorbance of mixture at 275
nm and 263.51 nm; ax1 and ay1 are absorptivity of
METOPROLOL SUCCINATE and
CHLORTHALIDONE at 275 nm, ax2 and ay2 are
absorptivity of METOPROLOL SUCCINATE and
CHLORTHALIDONE respectively at 263.51 nm; QM
= A2 / A1, QX = ax2 / ax1 and QY = ay2 / ay1.
3. RESULT AND DISCUSSION
DUAL WAVELENGTH
Fig 1: Determination of wavelength
Fig 2: STD curve for Metoprolol Succinate at 297nm & 267.22
nm
Fig 3: STD curve for Metoprolol Succinate
Fig 4: STD curve for Chlorthalidone at281nm & 268.96 nm
Fig 5: STD curve for Chlorthalidone
Table 1: Summary for Metoprolol Succinate and Chlorthalidone for dual wavelength
PARAMETER METOPROLOL SUCCINATE
CHLORTHALIDONE Wavelength (nm) Absorption diff measure at
297nm & 267.22 nm
Absorption diff measure at 281nm & 268.96 nm
Beer’s law limit (μg/ml)
STD CURVE
20-100 5-25
Regression equation
y = 0.0048x -0.0439 y = 0.0088x + 0.0307
r2
0.9982 0.9929
Intercept (c) 0.0006919 0.0007581 PRECISION INTRA DAY
0.139±0.001732 0.252±0.001 0.340±0.002 INTERDAY 0.136±0.002 0.248±0.003055 0.339±0.004041 INTRA DAY 0.122±0.001155 0.172±0.001155 0.202±0.001528 INTER DAY 0.122±0.001732 0.173±0.002 0.203±0.002517 Repetability 40μg/ml
0.139±0.001472
10 μg/ml
0.122±0.001211
LOD 0.474 0.2859
LOQ 1.43 0.8664
Analysis of marketed formulation
Table 9: Analysis of marketed formulation
Drugs Label Claim
(mg)
Amount Found
(mg)
% Label Claim*
Metoprolol Succinate
50 mg 50.10 100%
Chlorthalidone 12.5 mg 12.40 99.2%
Q-ABSORPTION RATIO METHOD
Fig 6: Determination of Iso absorptive point
Fig 7: Graph for Metoprolol Succinate at Iso absorptive point
263.51 nm
Fig 8: Graph for Metoprolol Succinate at 275 nm
Fig 9: Graph for Chlorthalidone at Iso absorptive point263.51
nm
Fig 10: Graph for Chlorthalidone at 275 nm
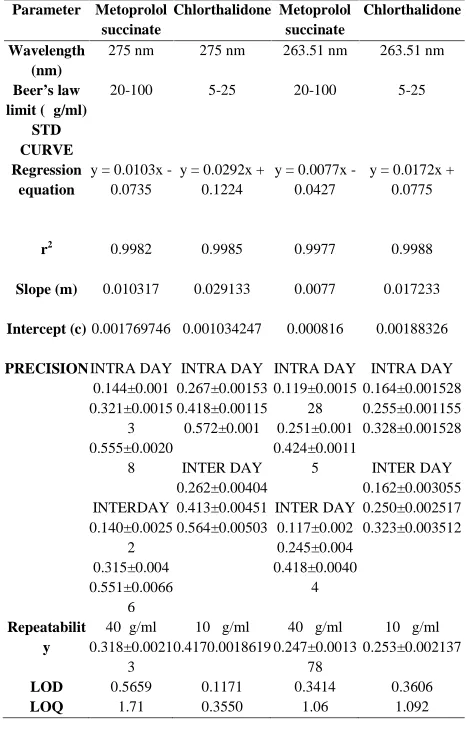
Table 3: Summary of Q-absorption ratio method
Parameter Metoprolol succinate Chlorthalidone Metoprolol succinate Chlorthalidone Wavelength (nm)
275 nm 275 nm 263.51 nm 263.51 nm
Beer’s law limit (μg/ml)
STD CURVE
20-100 5-25 20-100 5-25
Regression equation
y = 0.0103x -0.0735
y = 0.0292x + 0.1224
y = 0.0077x -0.0427
y = 0.0172x + 0.0775
r2
0.9982 0.9985 0.9977 0.9988
Slope (m) 0.010317 0.029133 0.0077 0.017233
Intercept (c) 0.001769746 0.001034247 0.000816 0.00188326
PRECISION INTRA DAY
0.144±0.001 0.321±0.0015 3 0.555±0.0020 8 INTERDAY 0.140±0.0025 2 0.315±0.004 0.551±0.0066 6 INTRA DAY 0.267±0.00153 0.418±0.00115 0.572±0.001 INTER DAY 0.262±0.00404 0.413±0.00451 0.564±0.00503 INTRA DAY 0.119±0.0015 28 0.251±0.001 0.424±0.0011 5 INTER DAY 0.117±0.002 0.245±0.004 0.418±0.0040 4 INTRA DAY 0.164±0.001528 0.255±0.001155 0.328±0.001528 INTER DAY 0.162±0.003055 0.250±0.002517 0.323±0.003512 Repeatabilit y 40μg/ml 0.318±0.0021 3 10 μg/ml 0.4170.0018619 40 μg/ml 0.247±0.0013 78 10 μg/ml 0.253±0.002137
LOD 0.5659 0.1171 0.3414 0.3606
LOQ 1.71 0.3550 1.06 1.092
Table 4: Analysis of marketed formulation
Drugs Label
Claim
(mg)
Metoprolol Succinate 50 mg 49.8 99.6% Chlorthalidone 12.5 mg 12.68 101.44%
4. CONCLUSION
Two simple & precise UV Spectrophotometric
methods have been developed and validated for the
estimation of Metoprolol Succinate and Chlorthalidone
pharmaceutical dosage form. All method validation
parameters lie within its acceptance criteria as per ICH
Q2 (R1) guideline so we can conclude that methods are
specific, linear, accurate and precise. Hence, it can be
successfully used for the routine analysis of Metoprolol
Succinate and Chlorthalidone pharmaceutical dosage
forms.
5. ACKNOWLEDGEMENT
The author wishes to thanks mates who helped me lot
for my work. And how can I forget U. Srinivas, my
guide who suggested me in all way.
6. REFERENCES
1.
Metoprolol-Succinate:http://dailymed.nlm.nih.gov/dailymed/dr
ugInfo.cfm?id=16753#nlm34089-3
2. Chlorthalidone:http://dailymed.nlm.nih.gov/dailym
ed/drugInfo.cfm?id=49283
3. Suhas PP, Nishant DJ et al. A derivative
uv-spectrophotometric method for the simultaneous
determination of metoprolol succinate and
chlorthalidone in combined dose tablet
Formulation. Int J of Analy and Bioanal chemistry
2014; 4(1): 33-41
4. Mayur M, Rikin S et al. Development and
validation of Spectrophotometric methods for
simultaneous estimation of Metoprolol succinate
and Telmisartan in combined Pharmaceutical
formulation. Int J Pharm Sci and Res 2012; 3(5):
1348-1354.
5. Shital P, drashti P. Simultaneous determination of
metoprolol succinate and Chlorthalidone by UV
spectrophotometric method. Pharma Gene 2013;
1(3): 39-43.
6. Raval HR, Patel DM Et al. Estimation of
metoprolol tartrate and chlorthalidone in combined
dosage form by uv-spectrophotometric methods.
Res J of Pharmacy and Tech 2011; 4(8):