Optical 3D Surface Reconstruction by a
Multi-Period Phase Shift Method
Erik Lilienblum, Bernd Michaelis
Institute for Electronics, Signal Processing and Communications Otto-von-Guericke University Magdeburg
P.O.Box 4120, 39106 Magdeburg, Germany
{erik.lilienblum, bernd.michaelis}@e-technik.uni-magdeburg.de http://iesk.et.uni-magdeburg.de/TI/TI.html
Abstract— One problem of classical phase shifting for optical 3D surface reconstruction is the occurrence of ambiguities due to the use of fringe projection. We generally derive a number-theoretical approach to calculate absolute phase measurements which can be used as a base for a reliable surface reconstruction without any ambiguity. The essence of our method is the application of pattern sequences with different periods whereby we homogeneously use all pictures which were taken for the measurement. This leads to a higher average accuracy in the surface reconstruction. Fur-thermore we propose a technique to avoid typical calculation errors that are produced in classical phase shifting caused by discontinuities, occlusions and reflections on the surface.
Index Terms — surface reconstruction, phase shifting, 3D shape measurement, structured light, fringe projection
I. INTRODUCTION
The reconstruction of 3D surfaces is one of the most important tasks in computer vision. Due to the fast devel-opment of the computer technique and the high relevance for industrial applications a multitude of different methods were investigated in the last years. The method which is used for a specific application depends on requirements concerning the measurement accuracy as well as on the resolution in time and space. Overviews are given in [1], [2]. Some examples of industrial applications are range sensoring, industrial inspection of manufactured parts (e.g. in [3]) and reverse engineering [4].
The high accuracy reconstruction of smooth and non-textured surfaces usually requires methods with projection of structured light [5], [6]. Moreover, if non-moving objects are measured, the accuracy can be substantially in-creased by the use of pattern sequences [7]. An overview and classification of pattern codification strategies is pre-sented in [8].
An important representative of methods based on coded light is phase shifting. There are a lot of papers (e.g. [9]– [12]) presenting different approaches for 3D measurement based on this technique. The basic idea of the phase shift method consists of capturing several images of
This paper is based on ”Unambiguous 3D Measurements by a Multi-Period Phase Shift Method” by Erik Lilienblum and Bernd Michaelis which appeared in A. Levi et al. (Eds.): Computer and Information Sciences - ISCIS 2006, LNCS 4263, pp. 85-94, 2006. cSpringer 2006.
phase shifted sinusoidal fringe patterns projected on the measuring object. The images are processed pixel by pixel, whereby for each pixel exactly one phase value is computed. That phase value is used as a measure for the calculation of the height information of the object.
The surface reconstruction can take place via triangu-lation methods [13], [14]. In classical phase shifting one uses a setup with one fringe projector and one matrix camera. But because of errors due to inaccuracies of the sinusoidal fringe patterns and difficulties in calibrating the projector a setup with a projector and two cameras leads to more exact 3D results. In case of two cameras the phase values are used to solve the correspondence problem [15], which is the basis to apply stereo vision.
However, the periodicity of the fringe pattern leads directly to the periodicity of the computed phase values. This entails ambiguities with the reconstruction of the object surface. So far, either approximate values of the object surface have been used or additional methods like the Gray code technique have been applied [16], [17] in order to tackle this problem in practice. A disadvantage of combined solutions based on an additional method is loss of information. Generally, additional pictures must be taken, which increase the measuring time, but not the measuring accuracy. Besides, a second method is always a source for additional errors.
In this paper we present a new number-theoretical approach, which is the basis for a simple implementation of a multi-period phase shift algorithm. Moreover, we investigate the proposed method concerning a stereo vi-sion application in 3D surface reconstruction. Preliminary results of our work can be found in [25].
The paper is structured as follows: firstly, the basics for phase shifting and for optical 3D measurement with stereo photogrammetry are presented in section II and section III respectively. Secondly, in section IV, we derive and explain our approach for the calculation of absolute phase measurements. Next, in section V, we explain the implementation of the suggested theory and we present experimental results obtained with the new technique. Finally, in section VI, the conclusion contains an overview about the advantages and problems of the proposed method.
II. PHASE SHIFTING
Basic principle for the classical phase shifting is the computation of a phase valueϕ(u, v)on the pixel(u, v) from the phase shifting sequenceG1, G2, . . . , Gmof grey tone images. For constant numbersmof images different computation methods were suggested in [26]–[28]. A general approach for arbitrary numbers of images is given by Surrel in [29]. In our work we use a similar approach with
ϕ(u, v) =21π arctan2(x, y) + 0.5 (1)
and
x =
m
i=1
cos2πi m
Gi(u, v),
y =
m
i=1
sin2πi m
Gi(u, v),
whereby arctan2(x, y) calculates the arc tangent angle of x/y in the correct quadrant and without undefined (singular) values. In contrast to the actual classical phase value within the borders between −π and π we have a range of values in the interval [ 0,1). Thereby, the use of the phase value is simplified significantly, which is important for the derivation of our theory.
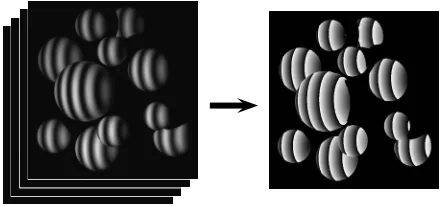
As an example figure 1 shows the phase measurements of a test object composed of some spheres. On the left side we see one original grey tone image with a fringe pattern from the phase shifting sequence. The phase values which we computed of this sequence are shown as a so-called phase image on the right side.
The phase image contains for each pixel of the camera sensor a phase value, which is illustrated in figure 1 by a normalized grey tone value between 0 (white) and 1 (black). In contrast to the original grey tone images the phase image does not directly depend on textures or shading effects on the surface of the measurement object. Thus, the phase image is a well-suited basis for surface reconstruction by photogrammetric methods.
Figure 1. Sphere objects: original gray tone images (left) and the computed phase image (right)
III. 3D SURFACERECONSTRUCTION
For optical 3D measurement of surfaces many different procedures exist. The focus of this paper is phase shifting. Thus, for surface reconstruction we limit our treatment to photogrammetry and a common stereo vision setup. Fundamentals can be found amongst others in [30]–[32]. Our experimental setup for taking measurements is shown in figure 2. The surface coordinates of the measure-ment object are determined from the images recorded by two cameras which are mounted at different locations. A projector situated between the cameras projects the phase shifted fringe patterns onto the surface of the body.
Figure 2. Experimental setup for the 3D measurement
A requirement for getting exact 3D surface points from the calculated phase images by photogrammetry is the geometric calibration of the measurement system. Due to the use of two cameras the system calibration does not include a projector calibration. Hence, we are not constrained to an accurate sinusoidal fringe projection. Our calibration method is based on a photogrammetric technique known as bundle adjustment [33]. It yields the parameter of a pinhole camera model [34] augmented with a lens distortion model. A world coordinate system is defined by a calibration chart and gives a relationship between the images of both cameras and the 3D object coordinates.
R3 to subpixel image coordinates(u, v)∈R2. Based on
bilinear interpolation in the phase image we get for a subpixel coordinate(u, v)a phase value ϕ(u, v)and we define for the 3D object pointϕ(x, y, z) =ϕ(θ(x, y, z)). By projecting an assumed 3D surface point(x∗, y∗, z∗)in the left and in the right camera we get two phase values ϕl(x∗, y∗, z∗) and ϕr(x∗, y∗, z∗). The assumed surface point is true if
ϕl(x∗, y∗, z∗) =ϕ
r(x∗, y∗, z∗). (2) This is a simple conclusion of the well known correspon-dence problem.
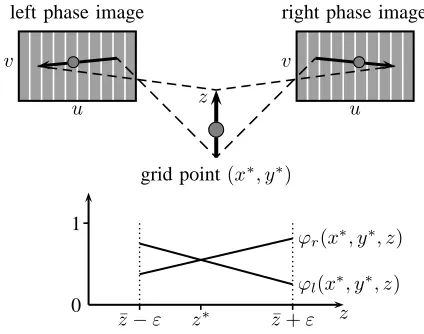
To compute the complete surface we define an equidis-tant grid of measuring points in the xy-plane. Then, for each grid point(x∗, y∗)we search the proper surface point by varying the z-coordinate. A schematic representation is shown in figure 3. The upper part shows the mapping of the 3D measurement point to the left and right phase image. The lower part shows the computation of the z -coordinatez∗ near an approximate value z¯.
grid point(x∗, y∗) z
left phase image right phase image
u v
u v
0 1
¯
z−ε z¯+ε
ϕr(x∗, y∗, z)
ϕl(x∗, y∗, z)
z∗ z
Figure 3. Schematic representation of the 3D measurement algorithm
Because the discontinuity of the phase value functions ϕl(z)andϕr(z)the algorithm works only if we know an approximate value of each measuring point. To avoid the problem of getting approximate values we need continu-ous phase values, which are absolute phase measurements.
IV. ABSOLUTE PHASE MEASUREMENTS
A. Function of projector coordinates
A way to acquire absolute phase measurements in fringe pattern images is to find out the origin of a measured fringe. However, the patterns that we are using are sent from the projector. Hence, we consider the fringe patterns from the projector view first.
A fringe pattern is characterized by a one-dimensional brightness function which we define with g(ξ). The parameter ξ ∈ R we call projector coordinate. Due to the projection of the fringe pattern the brightness in a surface point of the measured object is always determined by exactly one projector coordinate. This of course also applies to the pixel of the camera, which ”sees” this point
of surface. Thus we can defineξ(u, v), which gives the projector coordinate as a function of the image coordinate. Figure 4 gives a representation of this relationship.
1D pattern 2D image
projector
u
v ξ
g(ξ)
ξ(u, v)
Figure 4. Function to get the projector coordinate
Because this function is not periodic, the projector coordinate is the very value we are looking for. In the fol-lowing subsections we will develop a number-theoretical approach to get a powerful and efficient method for acquiring projector coordinates as a form of absolute measurements.
B. Unambiguous pattern sequences
Because the phase values of classical phase shifting are periodical and thus not unambiguous, the compu-tation of projector coordinates normally implies more information then a single pattern sequence can hold. For this reason we project in our proposed method a set S = {M1, M2, . . . , Mn} of different pattern sequences. TheMi differ in their period, which we appoint withλi. We need to clarify, which sets of pattern sequences lead to unambiguous measurements.
According to the definition of the fringe patterns, a pattern sequenceMi is given bym brightness functions gi,1(ξ), gi,2(ξ), . . . , gi,m(ξ). Using these functions in our phase shift calculation from equation 1 we can define a phase value functionϕi(ξ)∈[0,1), which depends on the projector coordinate. In addition, we assign a sequential natural number to each fringe of a pattern which we call fringe number and which we write asηi(ξ)∈N. We get the fringe number of a projector coordinate by simply counting the fringes of the pattern from left to right.
Mn .. .
M2
M1
0 1 2 3 4 5 6 7 . . . ηn(ξ) ϕn(ξ)
0 1 2 3 4 5 6 . . . η2(ξ)
ϕ2(ξ)
0 1 2 3 4 . . . η1(ξ)
ϕ1(ξ)
0 ξ∗ ξ∗∗ ξ
Figure 5. Interdependence between projector coordinate, phase value and fringe number for pattern sequences with different periods
patterns. The fringe numbers η1(ξ), η2(ξ), . . . , ηn(ξ) are shown as numerals.
Since the phase value is a pure fractional part and the fringe number is a pure integer part we can recognize from figure 5 a direct mathematical relation between the pattern sequences. For each ξ and all i = 1,2, . . . , n applies
ξ=ηi(ξ) +ϕi(ξ)λi. (3)
This system of equations obviously becomes ambiguous, if the projector coordinate and the fringe numbers are unknown. Because in a real measurement we only receive the phase values, we have to derive additional constraints to get unambiguous pattern sequences.
Concerning set S the ambiguity is generated exactly if two different projector coordinates ξ∗ = ξ∗∗ yield the same phase values ϕi(ξ∗) =ϕi(ξ∗∗) for all pattern sequencesMi∈S. If we solve equation 3 forϕi(ξ∗)and ϕi(ξ∗∗)resp., we receive through equating the right sides for all i= 1,2, . . . , n
ξ∗
λi −ηi(ξ∗) = ξ∗∗
λi −ηi(ξ∗∗). (4) and by further transforming we finally obtain
ξ∗−ξ∗∗=η
i(ξ∗)−ηi(ξ∗∗)λi. (5)
According to our assumption ξ∗ = ξ∗∗ the difference between the projector coordinates ∆ξ=ξ∗−ξ∗∗ is not 0. Since ∆ξ is constant over all i in equation 5 and the difference of two fringe numbers always results in an integer, there must be natural numbersx1, x2, . . . , xn >0 with
xi=|ηi(ξ∗)−η
i(ξ∗∗)|, (6) which fulfill the equations
|∆ξ|=x1λ1=x2λ2=· · ·=xnλn. (7) These equations form the basis of the computation of the least common multiples (LCM), which we can apply w.l.o.g. to the set of rational numbersQ. If we postulate λi∈Qfor all periods, then for the setS there is always a maximum projector coordinate
ξmax(S) =LCM(λ1, λ2, . . . , λn), (8)
up to which we can exclude ambiguity. Thus, with the condition ξ < ξmax(S) the system of equation 3 becomes unambiguous. Using this condition we can generate unambiguous pattern sequences for any kind of fringe projectors.
C. The theoretical approach
We now consider our pattern sequencesMi ∈S from the view of the camera. For a pixel (u, v) we assume, that we not only know the phase values ϕi(u, v) but also the fringe numbers ηi(u, v). According to equation 3, a projector coordinate can be computed from a fringe number and a phase value. The projector coordinate is obviously identical over all pattern sequences, because the camera ”sees” on this pixel always the same point of
surface independently of the projected pattern. Thus we get a projector coordinate
ξ(u, v) =ηi(u, v) +ϕi(u, v)λi, (9)
which is independent of Mi. If we equate the right sides from equation 9 for pairs of pattern sequences (Mi, Mj)∈S2, then we obtain for alli andj
ηi(u, v) +ϕi(u, v)λi =ηj(u, v) +ϕj(u, v)λj (10)
and after rearrangement
λiηi(u, v)−λjηj(u, v) =λjϕj(u, v)−λiϕi(u, v). (11) With reference to the right part of the equation 11 we introduce a phase difference vectorΦ(u, v) =awith the components
ai=λ1ϕ1(u, v)−λiϕi(u, v). (12) Note, for the phase difference vector we use only the pairs(M1, Mj)of pattern sequences. If we again provide λi∈Q, then we can define a mapH :P→T with
H(a) = (
h1, h2, . . . , hn) : ∀i{λihi< ξmax(S),
ai=λihi−λ1h1}
undefined: otherwise
,
(13) wherebyP ⊂Rn is the set of all phase difference vectors andT ⊂Nn is the set of all tuples of fringe numbers.
The map H is well-defined, since ambiguities are excluded with the constraint
λihi< ξmax(S) (14)
similar as shown for the derivation of the maximum projector coordinate. Assumed there is an ambiguity for at least one componentai of the phase difference vector, it holds true
λih∗i −λ1h∗1=λih∗∗i −λ1h∗∗1 (15) withh∗i < h∗∗i andh∗1 < h∗∗1 . Since h∗1 =h∗∗1 equation 15 holds true for alli= 1,2, . . . , n. After rearrangement of equation 15 we obtain
(h∗∗
1 −h∗1)λ1= (h∗∗i −h∗i)λ1. (16) Since equation 16 also holds true for alli= 1,2, . . . , n, we can conclude
LCM(λ1, λ2, . . . λn) = (h∗∗i −h∗i)λi . (17) Because h∗i > 0 it follows h∗∗i > LCM(λ1, λ2, . . . λn) which is a contradiction to the constraint 14.
By ruling out ambiguities in the projection of the fringe patterns according to subsection IV-C the correctness of mapH leads with equation 11 to
HΦ(u, v)=η1(u, v), η2(u, v), . . . , ηn(u, v). (18)
D. Calculation of real world measurements
It is clear that on basis of equation 1 we can compute the phase difference vectorΦ(u, v) =ain a simple way. For the computation of the fringe number tuples with map H this is obviously not the case. However, from the definition of H in equation 13 it follows that both the range of arguments P and the range of values T must be a finite set, which depends only on the periods λ1, λ2, . . . , λn. Thus we can already compute all possible function values ofH before the actual measurement. By storingH(a)for alla∈P efficiently we can construct a lookup table to compute the fringe numbers very fast and direct.
However, the theory only works with accurate measure-ments. In real world measurement we always get errors through noise. This means that in practice equation 11 is only approximately correct and the phase difference vector yields
Φ(u, v)≈a. (19)
witha∈P is accurately computed from mapH accord-ing to equation 13.
In order to be able to use our lookup table, we need an additional rule of assignment for mapping the measured valuesΦ(u, v)to the accurate valuesa∈P. For this, we defineλi ∈N to all i= 1,2, . . . , n. With the definition of mapH it leads toP ⊂Zn, where Zis the set of all integers. For the additional rule we choose rounding from real numbers to integers.
Practically seen we first compute a real vector Φ(u, v) =a ∈Rn according to equation 1 and 12, and
afterwards we compute an integer vectorΦZ(u, v) =b∈ Zn by rounding the components of the real vector with
bi = max{x|x∈Z, x < ai+ 0.5}. (20) According to equation 18 we are now able to compute with
HΦZ(u, v)=η1(u, v), η2(u, v), . . . , ηn(u, v) (21)
the unknown fringe numbers from the measured phase values only. An example taken by a real measurement of the sphere objects is given as follows.
Example 1: By projecting the pattern sequences of set
S = {M1, M2, M3} with the periods λ1 = 7, λ2 = 8 and λ3 = 9 we measured at pixel (u, v) = (591,401) the phase valuesϕ1(u, v) = 0.369,ϕ2(u, v) = 0.193and ϕ3(u, v) = 0.727. According to equation 12 we obtain the real phase difference vector
Φ(u, v) = 1.0400
−3.955
(22)
and the rounded phase difference vector
ΦZ(u, v) =
01
−4
. (23)
Concerning the conditions of mapH it applies 0 = 25·λ1−25·λ1, 1 = 22·λ2−25·λ1,
−4 = 19·λ3−25·λ1
(24)
and
19·λ3<25·λ1<22·λ2< ξmax(S) (25) with
ξmax(S) =LCM(λ1, λ2λ3) = 504. (26)
Hence, we get from mapH the fringe numbers
HΦZ(u, v)= (25,22,19). (27)
For the computation of the fringe numbers the rounding of the phase difference vector implicitly gives a cer-tain signal-to-noise ratio. Measurement errors lower than signal-to-noise ratio do not have any relevance for the computation of the fringe numbers, since incorrect phase vectors are corrected due to rounding. The efficiency of the signal-to-noise ratio depends on the number of pattern sequences and their periodsλi.
With equation 3 we get for each pattern sequence the appropriate projector coordinate. To obtain a unique value over all pattern sequences we define an average projector coordinate by
ξ(u, v) = n1 n
i=1
ηi(u, v) +ϕi(u, v)λi. (28)
Since the setT of fringe number tuples is completely contained in the entries of the lookup table, we execute part of the computations needed in equation 28 before-hand. For this we define the map
E(h1, h2, . . . , hn) = 1n n
i=1
λihi (29)
and transform equation 28 to
ξ(u, v) =EHΦZ(u, v)+ n1 n
i=1
λiϕi(u, v). (30)
Thereby we have to dynamically compute only the last part of the equation. The front part can be stored as a static constant in the lookup table. This results in a very fast computation of projector coordinates.
E. The lookup table
Basis of the implementation of the represented theory is the generation of the lookup table. We take a(n−1) -dimensional array which is indexed by the components a2, a3, . . . , anof the phase difference vectora. The reason for skipping the first component follows from equation 12, becausea1= 0always holds true. Withϕi(u, v)∈[ 0,1) the expansion of our array is limited in each dimension by the inequations
The memory usage of the lookup table amounts to
n
i=2
(λi+λ1−1). (32)
This is hardly a problem for smallnandλi. For example for n= 4andλi<50, we need not more than 4MB of memory.
More important is the issue of filling the components of the lookup table array. A direct method is to try all possible n-tuples (h1, h2, . . . , hn) of fringe numbers according to constraint 14 used in the definition of map H. In each step we have to calculate the inverse of H being a phase difference vector a. If all compo-nents of a fulfill inequality 31, we accept the n-tuple. According to equation 29 we calculate the static value E(h1, h2, . . . , hn) and store it in the lookup table array at position [a2][a3]. . .[an].
This method is quite inefficient. A better way is to chose only those n-tuples which fulfill inequality 31 anyway. Our algorithm starts in step 0 with the n-tuple H(0) = (0,0, . . . ,0). It results in the phase difference
vector a(0) = (0,0, . . . ,0), which obviously fulfills inequality 31. For the following steps there is an easy iter-ations scheme. If the tuple H(k)= (h(k)1 , h(k)2 , . . . , h(k)n ) is given from stepk, we build in stepk+ 1the new tuple H(k+1) with
h(k+1)i =
h(k)i + 1 :λi(hi(k)+ 1)≤λj(h(k)j + 1) ∀j with1≤j≤n
h(k)i :sonst
.
(33) The iteration ends if the maximum projector coordinate is reached withλih(k)i ≥ξmax(S)for at least onei. Through induction it can be proven, that we get by our proposed iteration scheme all possible validn-tuples of the lookup table. By calculating the phase difference vector a(k) in each stepkwe can store the static valueE(H(k))defined in equation 29 to the lookup table accordingly.
F. Error recognition
In the field of optical reconstruction of surfaces cor-rectness is very important. Due to influences like surface reflections, object movements, external light or camera noise there are many sources of errors. In this subsection we will point out some options and properties of our approach that help to avoid errors.
The simplest case of error reduction is the use of mul-tiple measurements. Since our proposed method rests on several independent phase shift measurements we already utilize that fact in the average operation of equation 28. But our approach has more potential to reduce errors.
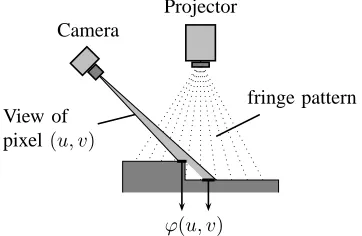
In regions of sharp edges with partial occlusions there are many problems with phase shifting. Because in real applications the pixel mapping represents an integral we get a mixture of different phase measurements on edges with partial occlusions. That leads to large errors and outliers. An illustration of this problem is schematically shown in figure 6.
Camera
Projector
View of pixel(u, v)
fringe pattern
ϕ(u, v)
Figure 6. Mixed phase values on edges with occlusions
In case of a mixture of phase values on one pixel the result depends both on the distribution and on the phase values itself. Because the phase values themselves differ in each different pattern sequence the result of the mixture differ also. This means, that the phase difference vector will be wrong. In most cases the wrong phase difference vector is not defined by the mapH. But if it is defined at random, then the whole measurement of the pixel is wrong. A simple method to detect those errors is an outlier recognition.
A safer method is using equation 11 completely for all pairs of pattern sequences (Mi, Mj). That means we get instead of the phase difference vector a phase difference matrix. Similar to the components of the phase difference vector defined in equation 12 we can form a phase difference matrixAnnwith the components
aij=λjϕj(u, v)−λiϕi(u, v). (34) By the use of this matrix it is possible to verify the result of map H, because the phase difference matrix is also computable from the fringe numbers with
aij =λiηi(u, v)−λjηj(u, v). (35) Since an error due to mixed phase measurements leads with high probability to a phase difference matrix which is non-defined by fringe numbers, this method works quite well. Two examples taken by a real measurement based on three different pattern sequences with the periodsλ1= 7, λ2= 8 andλ3= 9 are given as follows.
Example 2: We obtained at pixel (u, v) = (774,348) correct values. The fringe numbers on this pixel we calculated through our lookup table are η1(u, v) = 22, η2(u, v) = 19andη3(u, v) = 17. The comparison
Aϕ≈Aη (36)
between the phase difference matrix
Aϕ=
−20.013 2.0130 −10.074.939
−1.074 0.939 0
(37)
computed by the phase values and the phase difference matrix
Aη=
−02 02 −11
−1 1 0
computed by the fringe numbers shows the correctness of the measurement.
Example 3: We obtained at pixel (u, v) = (841,501) wrong values. The fringe numbers we calculated through our lookup table are η1(u, v) = 28, η2(u, v) = 24 and η3(u, v) = 21. The same comparison as in example 1 based on the matrices
Aϕ=
−40.292 4.2920 62..686393
−6.686 −2.393 0
(39)
and
Aη =
−04 40 73
−7 −3 0
(40)
leads here with
Aϕ≈Aη (41)
to a contradiction, which indicates an incorrect measure-ment.
The reliability of this method is accentuated if the signal-to-noise ratio is set to a value that is smaller than the maximal rounding distance of 0.5. But this value should be set carefully. Due do an incorrect sinusoidal form of the projector patterns there may be also normal aberrations.
The validation of the phase difference matrix is not only usable for errors caused on sharp edges. Similarly we can recognize errors due to object movements, light reflections and other reasons. Generally regards, if we obtain an implausible value in the phase difference matrix we are able to react.
V. IMPLEMENTATION ANDRESULTS
The proposed method is realized in our lab at the Uni-versity of Magdeburg following the experimental setup described in section III. The software is modularly imple-mented in C++. It is structured in the parts ’3D surface reconstruction’ and ’absolute phase measurement’. The absolute phase measurement, actually the calculation of projector coordinates, works independent from the other part. In principle we also can use the projector coordinates as an input for any other 3D calculation method. For this reason the focus of our comments in this section will be on absolute phase measurements.
First, we have to clarify a practical problem while using our method. Real measurements show that false computations can occur caused by measuring noise at the jumps of the phase value function. It happens in points where the phase value function of at least two different pattern sequences have a jump in the same projector coordinate. To solve this problem on a pixel (u, v) we virtually shift the measured phase values of all pattern sequencesMi with
ϕ
i(u, v) =ϕi(u, v) +ϕi(∆ξ), (42)
whereby the offset values correspond to a constant shift ∆ξof the projector coordinate. Through this operation the
position of the phase value jumps shift in different ways. The effect is that at the problematic point the jumps of the problematic phase value functions disappear. Hence, an error free computation can take place, whereby we obliviously get a modified projector coordinate ξ(u, v). To get the actual projector coordinate we have to undo the virtual shifting with
ξ(u, v) =ξ(u, v)−∆ξ . (43) The implementation of our method does not demand sophisticated algorithms. Preliminary, we have to generate the lookup table according to the iteration scheme given in equation 33. Regarding the actual measurement we just have to implement a set of equations. Ifnis the number of fringe patterns with different periods, then for each pixel one has to compute
• nphase values according to equation 1,
• n−1 components of the phase difference vector according to equation 12,
• the summation of n addends according to equation 30
• and one access to the lookup table.
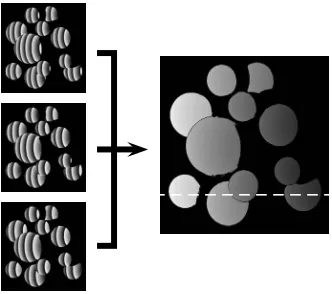
The computational cost of the implementation to get the absolute phase measurements is obviously very good. The operation to get the phase values (step 1) is the most expensive. It is the only one that depends on the number of images. However, all computations are linear. With a Pentium 4 standard PC the running time for computing projector coordinates using a one mega pixel camera and 24 images is less than one second. Compared with other implementations based on phase shifting that is a good value. An example of a complete computation of projec-tor coordinates from three different pattern sequences is shown in figure 7. The projector coordinates are presented as normalized grey tone values betweenξ = 50 (white) andξ= 250(black).
Figure 7. Computation of absolute phase measurements (projector coordinates) from three different pattern sequences
coordinate function is much clearer than the gradients of the phase value functions. Generally, this leads to very good results concerning the 3D reconstruction.
0 1
ϕ1(u,816)
u
0 1
ϕ2(u,816)
u
0 1
ϕ3(u,816)
u
100 200
ξ(u,816)
u
Figure 8. Graphs of phase value functions versus the calculated projector coordinate function on a constant vertical image coordinate
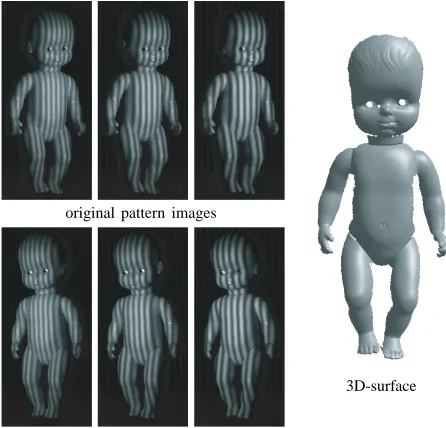
Even for tricky surfaces we get usable measurements without any additional correction. Figure 9 shows on the right side the surface of a dolly and on the left side the three applied fringe patterns with different periods. Figure 10 represents the surface measurements of a printer device and the image view of both cameras. Many holes and edges with occlusions in at least one of the cameras make this surface especially difficult. Our method produces only few measuring errors that were not caused by noise. The lack of surface points, both in figure 9 and in figure 10, are due to occlusions and the different view points of the cameras.
original pattern images
3D-surface
Figure 9. Reconstruction of a dolly
left camera right camera
3D-surface
Figure 10. Reconstruction of a of a printer device
We compared our multi period method with a method based on the combination of Gray code and phase shifting. For this we used the same measurement setup with a projector and two cameras as we already described in section III. For statistical investigations we used a plane as a test object and computed the standard derivation of the measuring error in a volume of 0.3×0.3 m2. For example by using 10 images for Gray code and 6 images for phase shift we get a standard derivation of 10.2 µm. Using all 16 images for phase shifting with three different pattern sequences we get 8.6 µm. The increase of the accuracy is due to the equivalent use of all images and the average operation in equation 28. We can confirm improvements in that range for other objects and measurement setups, though. A systematic investigation we didn’t realize because the support of the research project was finished.
From our point of view, a more important advantage of the proposed method is the avoidance of typical phase shift errors. Discontinuities, occlusions and reflections on the surface of the object normally lead to large deviations of the measured phase values. It is difficult to reduce errors like these automatically through mathematical oper-ations. Using the lookup table in our method most of these bad phase values are not computed at all. Additionally, we can validate the measurements by testing the phase difference matrix as described in subsection IV-F. For the absolute phase measurement this leads to a demarcation in the areas of discontinuity as already shown in figure 7 and figure 8, respectively.
new method classical method
Figure 11. Comparison of 3D measuring results for the sphere objects
90 110 130 150 170 65 80 95 110 125 x(mm) z (mm)
90 110 130 150 170 65 80 95 110 125 x(mm) z (mm)
Figure 12. Surface measurements from the new method (left) and the classical method (right) on a constant coordinatey= 96.5mm
To consolidate our results in respect of the above men-tioned avoidance of phase shift errors we present some statistics. For the sphere objects and the printer device we consider the error reduction of calculated projector coordinates of both the left camera view and the right camera view. Table I shows at first the total number of measurements with and without a defined entry in the lookup table, respectively. Thereby, the lookup table based on the phase difference vector. Secondly, Table I shows for all defined measurements the standard deviation between the real values of the measured phase differences and the expected integer values of the differences cal-culated by the corresponding fringe numbers. Therefor we consider all values from the phase difference matrix. The lower part of table I shows the total number of pixel measurements, which we can exclude as an error due to a deviation higher then a fixed value between the real phase differences and the expected integer differences. This value we use as a signal-to-noise-ratio to define the reliability of our measurement.
TABLE I.
EXCLUSION OF ABSOLUTE PHASE MEASUREMENTS
sphere objects printer device left right left right defined entries 153894 162329 1736636 1765881 undefined entries 3552 1279 7793 6201 standard deviation 0.117 0.085 0.076 0.079 deviation>0.5 4101 1433 11015 7989 deviation>0.4 5521 1995 15864 11996 deviation>0.3 7504 2933 21149 17761 deviation>0.2 10912 4695 29062 27722 deviation>0.1 23343 11728 85087 110879
From table I we can see, that the wrong measurements are rejected in the first step, because there is no entry in the lookup table for the phase difference vector calculated from the measured phase values. But this way we cannot
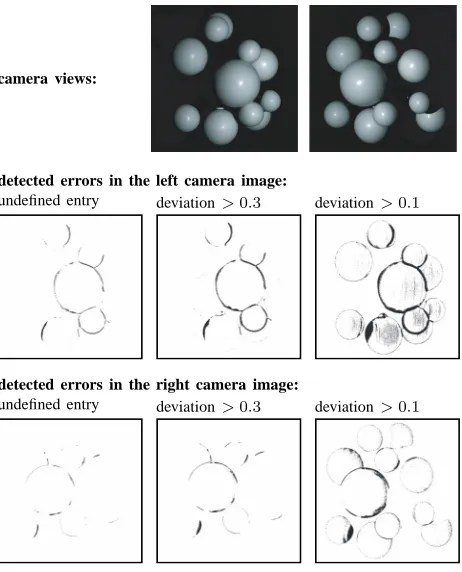
catch all errors. Using the phase difference matrix with a signal-noise-to-ratio lower than 0.5 we can extinguish some more errors. Figure 13 presents the distribution of detected errors in respect to a measurement of the sphere objects, which are additional illustrated as a bright image from the left and the right camera view.
camera views:
detected errors in the left camera image:
undefined entry deviation>0.3 deviation>0.1
detected errors in the right camera image:
undefined entry deviation>0.3 deviation>0.1
Figure 13. Distribution of detected errors
As already mentioned, a too small signal-to-noise-ratio leads to the exclusion of correct measurements. This can be seen well in the left camera with a deviation constraint of 0.1. The difference between both cameras concerning the amount of rejected pixels is due to the different points of view and different optical settings.
A signal-to-noise-ratio lower than 0.3 leads to the exclusion of weak measurements. It is difficult to say which of them are actually phase shift errors. However, weak measurements are due to strong shading effects at the object boundaries. This means they are bad values anyway. Important for our method is the fact, that we exclude nearly all absolute phase measurements, which are definitely wrong, before the surface reconstruction is going to start.
VI. CONCLUSION
two cameras and an implementation of our object based algorithm provides us with very good results even for tricky objects. By homogeneously using all images which were taken, the average accuracy of the 3D measurements can be increased.
Our method rests on a number theoretical approach which we generally derived in this paper. That means, the composition of the phase shift sequences we are using are not limited. Depending on the properties of the projector and the requirements of the application we can create optimal pattern sequences. This is an important basis to achieve a high performance of the 3D measurement.
Furthermore, we introduced new options to avoid er-roneous phase measurements. This brings us consider-able advantages for the 3D reconstruction of objects with surfaces being jagged and less homogenous. We explained the problem of mixed phase values on edges with occlusions. Even though this is one of the main reasons for errors, there are a lot of other sources of errors, for example surface reflections or unintentional object movements. To reduce errors we derived a powerful measurement test by simply comparing the real phase difference matrix with the integer phase difference matrix. The results that we obtain are convincing.
The implementation of the proposed theory to calculate absolute phase measurements is less complex due to the lack of involved iterations. It is only based on a few equa-tions which are solvable in linear time. Through the use of a lookup table the computation is even very fast. Together with the implementation of our 3D method we receive a very powerful tool for optical surface reconstruction.
ACKNOWLEDGEMENTS
This work was supported by LSA/Germany grants (FKZ: 3386A/0021B and XI3968A/0304D). Special thanks to Roger Klein.
REFERENCES
[1] F. Chen, G. M. Brown, and M. Song, “Overview of three-dimensional shape mesurement using optical methods,” Opt. Eng., vol. 39, no. 1, pp. 10–22, 2000.
[2] F. Blais, “A review of 20 years of range sensor develop-ment,” Journal of Electronic Imaging, vol. 13, no. 1, pp. 231–243, 2004.
[3] T. Lilienblum, P. Albrecht, R. Calow, and B. Michaelis, “Dent detection in car bodies,” in 15thInternational Con-ference on Pattern Recognition (ICPR), vol. 4, 2000, pp. 775–778.
[4] J. Burke, T. Bothe, W. Osten, and C. F. Hess, “Reverse engineering by fringe projection,” in Proc. SPIE Vol. 4778, Interferometry XI: Applications, 2002, pp. 312–324. [5] R. J. Valkenburg and A. M. McIvor, “Accurate 3d
measure-ment using a structured light system,” Image and Vision Computing, vol. 16, no. 2, pp. 99–110, 1998.
[6] E. Horn and N. Kiryati, “Toward optimal structured light patterns,” Image and Vision Computing, vol. 17, no. 2, pp. 87–97, 1999.
[7] P. Albrecht and B. Michaelis, “Improvement of the spa-tial resolution of an optical 3-d measurement procedure,” IEEE Transactions on Instrumentation and Measurement, vol. 47, no. 1, pp. 158–162, 1998.
[8] J. Salvi, J. Pag`es, and J.Batlle, “Pattern codifcation strate-gies in structured light systems,” Pattern Recognition, vol. 37, pp. 827–849, 2004.
[9] T. Strutz, “Ein genaues aktives optisches Triangula-tionsverfahren zur Oberfl¨achenvermessung,” Ph.D. disser-tation, University Magdeburg, 1993.
[10] C. Quan, X. Y. He, C. F. Wang, C. J. Tay, and H. M. Shang, “Shape measurement of small objects using lcd fringe projection with phase shifting,” Optics Communications, vol. 189, pp. 21–29, 2001.
[11] G. Wiora, “Optical 3d-metrology : Precise shape measure-ment with an extended fringe projection method,” Ph.D. dissertation, University Heidelberg, 2001.
[12] W. Wang, Y. Wong, and G. Hong, “3d measurement of crater wear by phase shifting method,” WEAR, vol. 261, no. 2, pp. 164–171, 2006.
[13] O. Faugeras, Three-dimensional computer vision. MIT Press, Cambridge, MA, 1993.
[14] R. Jarvis, “Range sensing for computer vision,” in Three-Dimensional Object Recognition Systems, A. Jain and P. Flynn, Eds. Elsevier Science Publishers, Amsterdam, 1993, pp. 17–56.
[15] J. Batlle, E. Mouaddib, and J. Salvi, “Recent progress in coded structured light as a technique to solve the correspondence problem: A survey,” Pattern Recognition, vol. 31, no. 7, pp. 963–982, 1998.
[16] F. M. Wahl, “A coded light approach for 3-dimensional (3d) vision,” IBM, Tech. Rep. RZ 1452, 1984.
[17] K. Sato and S. Inokuchi, “Three-dimensional surface mea-surement by space encoding range imaging,” Journal of Robotic Systems, vol. 2, pp. 27–39, 1985.
[18] A. Baldi, F. Bertolino, and F. Ginesu, “On the performance of some unwrapping algorithms,” Optics and Lasers in Engineering, vol. 37, pp. 313–330, 2002.
[19] X. Su and W. Chen, “Reliability-guided phase unwrapping algorithm: a review,” Optics and Lasers in Engineering, vol. 42, pp. 245–261, 2004.
[20] W. Nadeborn, P. Andr, and W. Osten, “A robust procedure for absolute phase measurement,” Optics and Lasers in Engineering, vol. 24, no. 2-3, pp. 245–260, 1996. [21] V. Gushov and Y. Solodkin, “Automatic processing of
fringe patterns in integer interferometers,” Optics and Lasers in Engineering, vol. 14, no. 4-5, pp. 311–324, 1991. [22] J. Zhong and Y. Zhang, “Absolute phase-measurement technique based on number theory in multifrequency grat-ing projection profilometry,” Applied Optics, vol. 40, pp. 492–500, 2001.
[23] M. G. L¨ofdahl and H. Eriksson, “Algorithm for resolving 2πambiguities in interferometric measurements by use of multiple wavelengths,” Optical Engineering, vol. 40, pp. 984–990, 2001.
[24] K. Wolf, “Schnelle absolute 3D-Messung,” 7. ABW-Workshop 3D-Bildverarbeitung, Technische Akademie Esslingen, 2002.
[25] E. Lilienblum and B. Michaelis, “Unambiguous 3d mea-surements by a multi-period phase shift method,” in Com-puter and Information Sciences - ISCIS 2006, ser. LNCS, vol. 4263, 2006, pp. 85–94.
[26] K. Creath, “Comparison of phase-measurement algo-rithms,” in Surface Characterization and Testing. SPIE Proceedings, Vol. 680., 1986, pp. 19–28.
[27] J. Schmit and K. Creath, “Extended averaging technique for derivation of error-compensating algorithms in phase-shifting interferometry,” Applied Optics, vol. 34, pp. 3610– 3619, 1995.
[29] Y. Surrel, “Design of algorithms for phase measurements by the use of phase stepping,” Applied Optics, vol. 35, pp. 51–60, 1996.
[30] R. Klette, A. Koschan, and K. Schl¨uns, Computer Vision. Vieweg, 1996.
[31] E. Trucco and A. Verri, Introductory Techniques fo 3-D Computer Vision. New Jersey: Prentice Hall, 1998. [32] T. Luhmann, Nahbereichsphotogrammetrie. Heidelberg:
Wichmann, 2000.
[33] B. Triggs, P. McLauchlan, R. Hartley, and A. Fitzgibbon, “Bundle adjustment – A modern synthesis,” in Vision Algorithms: Theory and Practice, ser. LNCS 1883, 2000, pp. 298–375.
[34] J. Heikkila, “Geometric camera calibration using circular control points,” IEEE Transactions on Pattern Analysis and Machine Intelligence, vol. 22, no. 10, pp. 1066–1077, 2000.
Prof. Bernd Michaelis was born in Magdeburg, Germany in
1947. He received a Masters Degree in Electronic Engineering from the Technische Hochschule Magdeburg in 1971 and his first Ph.D. in 1974. Between 1974 and 1980 he worked at the Technische Hochschule Magdeburg and was granted a second doctoral degree in 1980. Between 1980 and 1984 he was senior scientist at the Joint Institute for Nuclear Research Dubna. Since 1984 he was senior lecturer in Magdeburg. In 1993 he became Professor of Technical Computer Science at the Otto-von-Guericke University Magdeburg. His research work concentrates on the field of image processing, artificial neural networks, pattern recognition, processor architectures, and mi-crocomputers. Professor Michaelis is the author of more than 150 papers.
Erik Lilienblum was born in Magdeburg, Germany in 1970.