CODEN (USA)-IJPRUR,e-ISSN: 2348-6465
Original Article
Method Development for the Simultaneous Estimation of
Ospemifine by using RP-HPLC
Mitta chaitanya*, Kalepu Swathi, P Narayan raju, Koduru swathi
Department of Pharmaceutical analysis, Bojjam Narsimhulu Pharmacy College for Women, Hyderabad- 500088, India.
A R T I C L E I N F O A B S T R A C T
_______________________________________________________________________________
1. INTRODUCTION
The gathering and interpretation of qualitative, quantitative and structural information is essential to many aspects of human endeavour, both terrestrial andextra-terrestrials. The maintenance of an improvement in the quality of lifethroughout the worldand the management of resources heavily onthe informationprovidedbychemicalanalysis.Manufacturin
International Journal of Pharma Research and Health Sciences
Available online atwww.pharmahealthsciences.net
Received: 12 Apr 2015
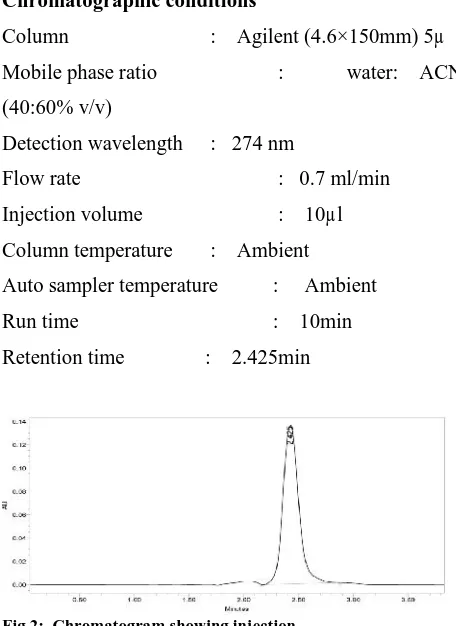
Accepted: 29 Apr 2015 A selective and sensitive stability-indicating high-performance liquidchromatographic method was developed and validated for the determination of Ospemifine. 10 mg of Ospemifine was dissolved in mobile phase. The solution was scanned from 200-400 nm the spectrum was obtained. The overlay spectrum was used for selection of wavelength for Ospemifine. The isobestic point was taken as detection wavelength. The separation was good, peak shape was good, so we conclude that there is no required for decrease the retention times of peak, so it is taken as final method. Mix a mixture of 40 ml water (40%) and 60 ml of Acetonitrile (60%) and degassed in ultrasonic water bath for 5 minutes. Filter through 0.22 µ filter under vacuum filtration.10 mg of Ospemifine working standard was accurately weighed and transferred into a 10 ml clean dry volumetric flask and add about 2 ml of diluent and sonicate to dissolve it completely and make volume up to the mark with the same solvent (Stock solution).Further pipette out 1.0 ml from the above stock solution into a 10 ml volumetric flask and was diluted up to the mark with diluent. The chromatographic method development for the estimation of Ospemifine were optimized by several trials for various parameters as different column, flow rate and mobile phase, finally the following chromatographic method was selected for the separation and quantification of Ospemifine in API and pharmaceutical dosage form by RP-HPLC method. The retention time of Ospemifine was found to be 2.425 mins. The system suitability parameters for Ospemifine such as theoretical plates and tailing factor were found to be 4146, 1.2.The % purity Ospemifine in pharmaceutical dosage form was found to be 99.56%.
Keywords:Ospemifine, RP-HPLC, Acetonitrile (30:70) and Retention time.
Corresponding author *
g industries useanalytical data to monitor the quality of raw materials, intermediates and finished products. Progress and research in many areas is dependent on establishingthe chemical composition of man-made or natural materials, and the monitoring of toxic substances in the environment is of ever increasing importance. Studies of biological and other complex systems are supported by thecollection of large amounts of analytical data.Analytical data are required in a wide range of disciplines and situations thatinclude not just chemistry and most other sciences, from biology to zoology, butte arts, such as painting and sculpture, and archaeology. Space exploration andclinical diagnosis are two quite desperate areas in which analytical data is vital. Important areas of application include the following.
Quality control (QC) inmany manufacturing industries, the chemicalcomposition of raw materials, intermediates and finished products needs tobe monitored to ensure satisfactory quality and consistency. Virtually allconsumer products from automobiles to clothing, pharmaceuticals and foodstuffs, electrical goods, sports equipment and horticultural products rely, in part, on chemical analysis. The food, pharmaceutical and water industries inparticular have stringent requirements backed by legislation for major componentsand permitted levels of impurities or contaminants. The electronic industry needs analyses at ultra-trace levels (parts per billion) in relation to themanufacture of semi-conductor materials. Automated, computer-controlledprocedures for process-stream analysis are employed in some industries. Ospemifene is a next generation SERM (selective estrogen receptor modulator) that selectively binds to estrogen receptors and either stimulates or blocks estrogen's activity in different tissue types. It has an agonistic effect on the endometrium.
Fig 1: Structure of Ospemifine
2. EXPERIMENTAL WORK
2.1 Materials and Methods
Selection of wavelength: 10 mg of Ospemifine was dissolved in mobile phase. The solution was scanned from 200-400 nm the spectrum was obtained. The overlay spectrum was used for selection of wavelength for Ospemifine. The isobestic point was taken as detection wavelength.
2.2 Chromatographic trials for simultaneous
estimation of Ospemifine by RP- HPLC.
Chromatographic conditions
Column : Agilent (4.6×150mm) 5µ Mobile phase ratio : water: ACN (40:60% v/v)
Detection wavelength : 274 nm
Flow rate : 0.7 ml/min Injection volume : 10µl Column temperature : Ambient
Auto sampler temperature : Ambient Run time : 10min Retention time : 2.425min
Fig 2: Chromatogram showing injection
Mix a mixture of 40 ml water (40%) and 60 ml of Acetonitrile (60%) and degassed in ultrasonic water bath for 5 minutes. Filter through 0.22 µ filter under vacuum filtration.
Preparation of the individual Ospemifine standard preparation
10 mg of Ospemifine working standard was accurately weighed and transferred into a 10 ml clean dry volumetric flask and add about 2 ml of diluent and sonicate to dissolve it completely and make volume up to the mark with the same solvent (Stock solution).Further pipette out 1.0 ml from the above stock solution into a 10 ml volumetric flask and was diluted up to the mark with diluent.
Preparation of the Ospemifine standard and sample solution
2.3 Sample solution preparation
10 mg of Ospemifine tablet powder was accurately weighed and transferred into a 10 ml clean dry volumetric flask, add about 2ml of diluent and sonicate to dissolve it completely and making volume up to the mark with the same solvent(Stock solution). Further pipette 10ml of the above stock solution into a 100ml volumetric flask and was diluted up to the mark with diluent.
2.4 Standard solution preparation
10 mg Ospemifine working standard was accurately weighed and transferred into a 10ml clean dry volumetric flask and add about 2ml of diluent and sonicate to dissolve it completely and make volume up to the mark with the same solvent (Stock solution).Further pipette out 1ml of the above stock solution into a 10ml volumetric flask and was diluted up to the mark with diluent.
Repeatability
2.5 Preparation of stock solution
10 mg of Ospemifine working standard was accurately weighed and transferred into a 10ml clean dry
volumetric flask add about 2ml of diluent and sonicate to dissolve it completely and make volume up to the mark with the same solvent. Further pipette out 1ml of the above stock solution into a 10ml volumetric flask and was diluted up to the mark with diluent.
Procedure: The standard solution was injected for five times and measured the area for all five injections in HPLC. The %RSD for the area of five replicate injections was found to be within the specified limits.
3. RESULTS AND DISCUSSIONS
3.1 Method Development
The detection wavelength was selected by dissolving the drug in mobile phase to get a concentration of 10µg/ml for individual and mixed standards. The resulting solution was scanned in U.V range from 200-400nm. The overlay spectrum of Ospemifine was obtained and the isobestic point of Ospemifine showed
absorbance’s maxima at 274 nm.
The chromatographic method development for the estimation of Ospemifine were optimized by several trials for various parameters as different column, flow rate and mobile phase, finally the following chromatographic method was selected for the separation and quantification of Ospemifine in API and pharmaceutical dosage form by RP-HPLC method. Optimized chromatographic conditions for simultaneous estimations of Ospemifine by RP-HPLC method
Column : Agilent (5µm,4.6x150mm) Column temperature : Ambient Wavelength : 274 nm
Mobile phase ratio : Water: ACN (40:60% v/v)
Flow rate : 0.7 ml/min Auto sampler temperature : Ambient Injection volume : 10µl
Run time : 10.0 minutes
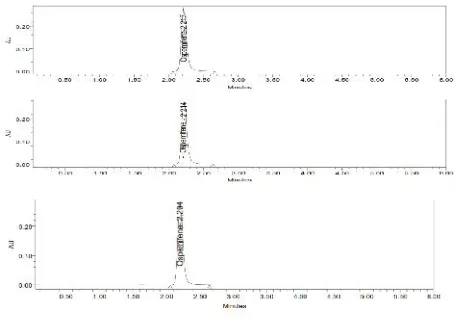
3.3 Specificity
S. No Linearity Level Concentration Area
1 I 50 ppm 201932
2 II 100 ppm 338071
3 III 150 ppm 597859
4 IV 200 ppm 740654
5 V 250 ppm 950396
Correlation Coefficient 0.999
The system suitability for specificity was carried out to determine whether there is any interference of any impurities in retention time of analytical peak. The study was performed by injecting blank. The chromatograms are shown in Fig.No.23-25.
3.4 Linearity
The linearity study was performed for the concentration of 20-100 ppm Ospemifine. Each level was injected into chromatographic system. The area of each level was used for calculation of correlation coefficient.
Fig 3: Showing calibration graph for Ospemifine
Ospemifine r2 = 0.999
The linearity study was performed for concentration range of 10µg-30µg Ospemifinee and the correlation coefficient was found to be 0.999 (NLT 0.999).
3.5 Accuracy
The accuracy study was performed for 50%, 100% and 150 % for Ospemifine. Each level was injected in triplicate into chromatographic system. The area of each level was used for calculation of % recovery. Chromatograms are shown in
Fig 4: Accuracy
3.6 Repeatability
The precision study was performed for five injections of Ospemifine. Each standard injection was injected into chromatographic system.
The Method precision study was performed for the %RSD of Ospemifine was found to be 0.5 (NMT 2). Intermediate precision/Ruggedness
The intermediate precision study was performed for five injections of Ospemifine. Each standard injection was injected into chromatographic system. The area of each standard injection was used for calculation of % RSD.
4. CONCLUSION
analytical method was validated according to ICH guidelines (ICH, Q2 (R1)). The linearity study of Ospemifine was found in concentration range of 10µg-50µg and correlation coefficient (r2) was found to be 0.999, % recovery was found to be 98.96%, %RSD for repeatability was 0.5, % RSD for intermediate precision was 1.0. The precision study was precision, robustness and repeatabilty.LOD value was3.67 and LOQ value was 8.87.
Hence the suggested RP-HPLC method can be used for routine analysis of Ospemifine in API and Pharmaceutical dosage form.
5. REFERENCES
1. Becket and Stenlake, Practical Pharmaceutical Chemistry, Part 24thEdition Cbs Publications And Distributors, 2005, 157-168.
2. P.D. Sethi, Hplc Quantitative Analysis Of Pharmaceutical Formulations Cbs Publications And Distributors, 1stEdition, 2001, 69-70.
3. B.K Sharma, Instrumental Method Of Chemical Analysis, 23rdEdition, Goal Publishers 2004. 4. Practical Hplc Method Development Lloyd
R.Snyder, Joseph J. Kirkland, Joseph L. Glajch, Second Edition, 1, 420-430,686-704.
5. Validating Chromatographic Methods, David M.Bliesner. 1-4.
6. International Conference on Harmonization: Ich Q 2 (R1) Validation of Analytical Procedures: Text And Methodology 1995.
7. Indian Pharmacopeia 2007 Vol–I Pg.No-715. 8. British Pharmacopeia 2007 Vol-I Pg.No-136. 9. Martindale. The Complete Drug Reference, Thirty
Sixth Edition.
10. Merck Index, 12th Edition.
11. Swarup Suresh PRABHUNE et al, (*Sci Pharm. 2014; 82: 777–785.
12. Pursley J et al,Bioanalysis. 2014 Aug;6(15):2071-82.
Conflict of Interest: None