Methods
Birgit Elias
Institute of Cartography and Geoinformatics University of Hannover
Appelstr. 9a 30161 Hannover, Germany [email protected]
Abstract. The navigation task is a very demanding application for
mo-bile users. The algorithms of present software solutions are based on the established methods of car navigation systems and thus exhibit some in-herent disadvantages: findings in spatial cognition research have shown that human users need landmarks for an easy and successful wayfinding. Typically, however, an object is not a landmark per se, but can be one relative to its environment. Unfortunately, these objects are not part of route guidance information systems at the moment.
Therefore, it is an aim of research to make landmarks for routing in-structions available. In this paper we focus on a method to automatically derive landmarks from existing spatial databases. Here a new approach is presented to investigate existing spatial databases and try to extract landmarks automatically by use of a knowledge discovery process and data mining methods. In this paper two different algorithms, the classi-fication method ID3 and the clustering procedure Cobweb, are investi-gated, whether they are suitable for discovering landmarks.
1
Introduction
The wayfinding process in unknown environments is a very difficult and chal-lenging task. Consequently, the interest to solve this problem by automated computed routing is enormous. Route guidance systems for vehicles are an es-tablished technology that are available even in middle class cars today.
Automatically produced routing directions are based on the data and concepts of current car navigation systems: the user gets turning instructions and met-ric distance measures. This concept works quite well, because of the restmet-riction of automobiles to the road network. Currently, to improve usability navigation databases are enriched with additional information. Locations of petrol stations, pharmacies, public buildings and restaurants - so called points of interest - are part of the database. Another recent development is to transform the presenta-tion of the route in the car into 3D-portrayals with models of historic buildings merged into the database to satisfy the touristic interest of the user.
The increasing amount of small and mobile technologies leads to a new group of user: the pedestrian. This evokes new problems for the automatic, computer driven navigation: pedestrians are not tied to the road network.
It makes no sense to simply adopt the current concepts of car navigation to a mobile application for pedestrians. The discipline of spatial cognition investi-gates the human wayfinding concepts. Findings reveal, that humans need salient objects in the environment - so calledlandmarks - to orient and navigate them-selves through space. But these objects are not per se a landmark, because being a landmark is a relative property depending on the local environment. Besides all that the capability of humans to estimate metric distances correctly are very poor.
Many research approaches in the field of spatial cognition have been undertaken about the wayfinding process and theory of landmarks, but only a few deal with the practical procedure to extract landmarks automatically from existing databases. In this approach it is investigated, whether the salient objects in the environment can be extracted from spatial databases with methods of spatial data mining.
This paper is organized as follows: the basic theory and related work of nav-igation with landmarks and the principles of data mining are presented. The approach using knowledge discovery with data mining methods for discovering landmarks in the data is outlined. After that the existing database which is used for the extraction process is introduced and examined. The extraction approach is presented including the data preparation and preprocessing steps. Finally the applicability of the approach to discover landmarks by use of automatic proce-dures is evaluated.
2
Related Work
2.1 Basic Theory of Navigation with Landmarks
There are two different kinds of route directions to convey the navigational in-formation to the user: either in terms of a description (verbal instructions) or by means of a depiction (route map). According to (Tversky & Lee 1999) the structure and semantic content of both is equal, they consist of landmarks, ori-entation and actions. Using landmarks is important, because they serve multiple purposes in wayfinding: they help to organize space, because they are reference points in the environment and they support the navigation by identifying choice points, where a navigational decision has to be made (Golledge 1999). Accord-ingly, the term landmark stands for a salient object in the environment that aids the user in navigating and understanding the space (Sorrows & Hirtle 1999). In general, an indicator of landmarks can be particular visual characteristic, unique purpose or meaning, or central or prominent location.
Furthermore landmarks can be divided into three categories: visual, cognitive and structural landmarks. The more of these categories apply for the particular object, the more it qualifies as a landmark (Sorrows & Hirtle 1999).
formally the landmark saliency of buildings: the strength or attractiveness of landmarks is determined by the components visual attraction (e.g. consisting of fa¸cade area, shape, colour, visibility), semantic attraction (cultural and his-torical importance, explicit marks (e.g. shop signs)) and structural attraction (nodes, boundaries, regions). The combination of the property values leads to a numerical estimation of the landmarks’ saliency.
A study of (Lovelace, Hegarty & Montello 1999) includes an exploration of the kinds and locations of landmarks used in directions. It can be distinguished be-tween four groups: choice point landmarks (at decision points), potential choice point landmarks (at traversing intersections), on-route landmarks (along a path with no choice) and off-route landmarks (distant but visible from the route). A major outcome of the study is that choice point and on-route landmarks are the most used ones in route directions of unfamiliar environments.
2.2 Principles of Data Mining
With the increasing amount of digital data stored, the demand raises to interpret and derive useful knowledge from these ‘data mountains’. Therefore, a new gen-eration of tools and techniques for automated and intelligent database analysis has been developed, called knowledge discovery in databases (KDD). This term can be defined as the discovery of interesting, implicit, and previously unknown knowledge from large databases (Frawley, Piatetsky-Shapiro & Matheus 1991). This research field combines topics from machine learning, pattern recognition, databases, statistics, artificial intelligence, knowledge acquisition for expert sys-tems and data visualization. An overview about the topic is given in (Fayyad, Piatetsky-Shapiro & Smyth 1996a).
The term ‘knowledge discovery in databases’ comprises the overall process of finding and interpreting patterns from data, while ‘data mining’ only refers to the stage of data analysis without the additional steps. So the KDD process includes preprocessing of data, data mining itself and postprocessing, as well as the interpretation of potentially discovered patterns. The KDD process is in-teractive, iterative and consists of the following steps (according to (Fayyad et al. 1996a)):
Selection: developing prior knowledge, goals of end-user, creating a data set
Preprocessing: data cleaning (removal of noise), deciding on strategies for handling missing data, data reduction (find the representing features), data transformation (harmonize different scales and attribute types)
Data mining: choose the data mining method, choose the data mining
algo-rithm, data mining process
Interpretation: interpretation of mined patterns, verifying discovered know-ledge
Data mining methods are algorithms designed to analyse data or to extract from data patterns into specific categories (Fayyad, Piatetsky-Shapiro, Smyth & Uthurusamy 1996b). Basic models of data mining are clustering, regression mod-els, classification, summarization, link and sequence analysis. The algorithms
used are taken from the fields of machine learning, neural networks, rough set and fuzzy set theory or statistics (Cios, Pedrycz & Swiniarsky 1998).
Theses procedures can be applied to data sets consisting of collected attribute values and relations for objects. Attribute types can be nominal (values are cat-egories with no ranking), ordinal (values have meaningful ordering) and numeric (values can be continuous, discrete, interval). Potential problems to be solved in the preprocessing stage are either incomplete or missing data in the data set or different attribute types to be handled.
In the last years the scope of data mining from relational databases has been extended to spatial databases. The knowledge discovered through spatial data mining can be of various forms: providing characteristic and discriminant rules, extraction and description of prominent structures or clusters, spatial associa-tions, and others (Koperski, Adhikary & Han 1996), (Anders & Sester 2000).
The algorithms can be devided in two basic techniques. According to the terminology of the machine learning community, there are methods for:
– learning from examples (supervised learning)
– learning from observation (unsupervised learning)
One very prominent example for supervised learning techniques is the ID3 al-gorithm by Quinlan (Quinlan 1986). It needs a set of classified examples and counter-examples and generates a decision tree, which can be used for classifica-tion of unknown examples. The method only deals with complete and nominal data sets and subdivides the training set of examples into homogeneous groups using discriminating attributes, whose selection is based on information gain cal-culation (Koperski et al. 1996). There are also extensions that enable the treat-ment of quantitative values as well. An application of knowledge acquisition for automatic interpretation of spatial data using ID3 is given in (Sester 2000). The incremental conceptual clustering algorithm Cobweb is an example for un-supervised learning: clustering procedures divide examples in natural groups with similar features depending on a specific neighborhood concept. The chosen approach used here divides the examples into hierarchical groups. It is able to process data records in the form of symbolic attribute-value lists and builds up a decision tree (Witten & Eibe 1999).
3
An Approach of Extracting Landmarks
The above mentioned approach to enrich wayfinding instructions with landmarks (Raubal & Winter 2002) follows the categories visual, semantic or structural at-traction, introduced by (Sorrows & Hirtle 1999) (see Sect. 2.1). Additionally, for grouping the structural elements the acknowledged structure elements of a city (nodes, boundaries, regions) named by (Lynch 1960) are used. The result is a catalogue of properties for each attraction element, which has to be filled with real data to make an automatic identification of landmarks possible. A prob-lem could lie of course in data retrieval. Either there exists no database with
the needed information or it is not available for greater areas. Maybe it is dis-tributed over different databases and the collecting of all is too time-consuming and expensive like in the case of points of interest.
One way is to investigate existing topographic data sets: we investigate the infor-mation of available digital databases and extract the salient objects by analysing the real data. A first study to use existing databases for landmark extraction is given in (Elias 2002). In that study a set of specific feature types have been characterized as landmarks and have subsequently been extracted from the data sets. The problem is, however, that the quality as a landmark is relative: a multi-stored building may be an excellant landmark in a small city with only one such building - in New York however, it would be useless as a navigation aid. There-fore, in this paper the relative uniqueness of an object in its environment is taken into account. Thus, we start to investigate data mining methods for discovering landmarks.
The idea is that objects, which have a unique attribute in a certain environ-ment, qualify as landmarks. Therefore, the underlying model is to compare the attribute values of all data records: These objects with distinct or even unique values differing from the global mean have to be something special. The pro-cedure will also lead to an attribute ranking according to their importance for the model. If the chosen attributes are suitable for developing a global object schema and outliers from this schema present something particular, it is possible to determine landmarks through statistics and data mining methods.
Consequently, our approach passes through the stages of a knowledge discovery process introduced by Sect. 2.2. As the goal is to extract the landmarks from a database, we need a data set. In this case we concentrate on the building objects. We enrich our explicit given information about buildings by deriving attributes and relations with the help of spatial analysis. The combination of different attribute-values leads to derived attributes, e.g. building length to width ratio. The data have to be preprocessed to unify the different attribute types, missing values have to be handled.
There are several open-source data mining and statistics tools available in the internet, for our investigation we use the WEKA implementation (Witten & Eibe 1999). This tool provides different data mining modules including prepro-cessing options.
4
Landmarks discovery in building data
4.1 Data Source and Selection
In this paper we focus on the digital cadastral map of lower saxony to use the benefits of an object oriented vector database of area-wide availability. This digital map includes buildings, parcels and their land use. Besides the geometry of the objects, the following attributes are available:
– land use types: public purposes, residential, commerce and service, industrial, mixed land uses, traffic, park, garden, sports, etc.
– building labels: name or function of building (e.g. town hall, kindergarten, church)
– special building parts with a roof: winter garden, car port etc.
To keep the first approach on a simple level, we simplify the conditions. We assume that for this analysis process the objects present a homogeneous group with predominantly identical attributes and that it is not possible to compare buildings with roads for example, because they have both important attributes not existing in the other group (building use: residential, official, etc.; road clas-sification: highway, community road, etc.). In this first step, we decide to investi-gate the group of buildings and compose a complete attribute-value list for each building object.
The derived attribute values are calculated by combining all explicit given in-formation of the used data sets. In most cases the provided attributes describe geometric or topologic properties of the buildings, additionally some semantic information is given.
The next step is to determine the situation, in which a landmark is needed for the wayfinding process and to convey the spatial cognition findings to our study. According to (Michon & Denis 2001) pedestrians simply progress along a route by directing themselves towards a landmark, thus landmarks are espe-cially needed, when a turn on the route is required. Therefore, we try to provide a landmark at every (potential) choice point (or close to it) on the route. At every turning point of the route we start an examination, whether there is an applicable object in our data sets.
The amount of data makes it necessary to select the affected data sets with respect to the users perspective and visibility within a predefined neighborhood. An overview is given in Fig. 1 showing a city situation with two different neigh-borhoods. The inner circle represents a distance of 50 m from the point of view and contains in this case nearly 20 buildings, the outer circle stands for a 100 m radius and more than 30 buildings, which can be used for searching for a salient one. Depending on the built-up area situation different kinds of visibility zones or neighborhoods can be established. If there is a dense, cropped situation a nar-row neighborhood (for example the 50 m distance) is sufficient for the analysis. In this scenario we disregard the fact that a user usually move towards a certain direction and therefore wants a landmark in front of him, not behind him. We only investigate the situation, that the user is standing in the middle of the road and searches for landmarks to support his current decision and guide his next movements.
4.2 Preprocessing: Providing Attribute-Value Lists
With respect to the formerly mentioned cadastral data set, the attribute-value table has to be composed for the selected buildings. All existing information
12 10 11 7 13 16 18 14 22 20 18 16 13 11 8 6 22 14 12 10 14A 15A 15 14 13 18 5 7 9 14 9A 22 23 18 20 16 23 1 9 24 2 30 31 5 7 3 29 2 3 4 5 27 6 9 11 13 4 28 6 7 26 7 13 9 19 27 14 21 23 15 25 16 19 21 20 2 4 6 8 3 17 12 12A 10 13A 16 17 18 8 20A 25 17 15 5 9 19 20 7A 10 12 12 8 #
Fig. 1.Selected buildings: neighborhood 50 m and 100 m
about the objects has to be extracted from the database: information about semantics and geometry of the object itself, but also information about the topology, in this case neighborhood relations to other buildings and other object groups (for examples the distance to roads, to the parcel boundary etc.) are collected.
The derived attributes available from the digital cadastral map are shown in Tab. 1. One profound disadvantage of the database content is the lack of height values for the buildings.
Table 1: Attributes and relations of buildings
no attribute description graphic
1 building use public, residential, outbil-dung . . .
2 building label name or function of build-ing
4 elongation derivation to typical building form; ratio length/width
5 number of corners counting quoins (normal: 4 or 6)
6 single building all alone, single in a row, one neighbour, two neigh-bours
7 building moved away from road
closest distance [m]
8 ratio of building area to par-cel area
building ground area parcel area
9 density of buildings (direct neighbourhood)
number of buildings
area(100∗100m) [m12]
10 density of buildings (district) number of buildingsarea(500∗500m) [m21 ]
11 orientation to road along (length towards road), across (width), an-gluar, building at corner [grad]
12 orientation to north angle building length to north t [rad]
13 orientation to neighbor difference angle to neigh-bour (t1 - t2) [rad] 14 perpendicular angle in
build-ing
derivation of angles to normal [rad]
15 parcel land use public, residential, com-merce and service, indus-trial, traffic, . . .
16 number of buildings on parcel counting buildings
17 special building objects on parcel
number of car ports, win-ter garden etc.
18 neighbor parcel land use difference yes, no
19 form of parcel area number of corners, num-ber of neighbors
4.3 Data Preprocessing
Table 1 provides values in different units: there is information in nominal cate-gories (building use: public, residential, . . . ) or ordinal values (number of neigh-bors: 0, 1, 2) or even different metric values (distance to road [m], orientation to north [rad]). Depending on the chosen data mining algorithm different attribute types and units are needed, so the data has to be transformed. One procedure is for example the changeover from metric values to categories: the size of the buildings can be given in squaremetres or size classes can be set up (small, large). We have to take care with the transformation of different attribute types, be-cause the type of transformation may influences the results of the whole analysis process. The specifications of needed attribute types change from algorithm to algorithm, but in data mining software automatic transformation operations are available (Witten & Eibe 1999). To avoid the above mentioned problems and make the interpretation of the results easier, we simplify our approach in this first study by creation and use of a synthetic data set, which relies mostly on the existing data model of cadastral data. We build up a data set with limited attributes of the fictitious situation given in Fig. 2. As described in Sect. 4.1, we assume that the user stands at a decision point and searches for a landmark in the immediate environment. In this case the next neighborhood in a speci-fied radius consists of 10 buildings used for the extraction procedure. The single objects are characterized by the following features with nominal values:
– building use: residential, public, outbuilding
– number of immediate neighbors: 0, 1, 2
– orientation towards road: parallel, across, angular, corner
– distance from road: 0 or 3 metres
– building height: 12, 15 or 17 metres
1 2 3 4 5 6 7 8 9 10 1 2 3 4 5 6 7 8 9 10
no building use size neigh. orientat. dist. height 1 residential small 2 parallel 0 15 2 residential small 2 corner 0 15 3 residential large 0 corner 0 15 4 residential small 2 parallel 0 15 5 residential small 2 parallel 0 15 6 residential small 2 parallel 0 15 7 residential small 1 parallel 3 15 8 residential small 1 parallel 3 15 9 residential small 1 corner 3 15 10 residential small 1 corner 3 15
Fig. 2.Synthetic test data
Obviously, building number 3 is somehow singular and different to all other buildings: it has no direct contact to neighbored buildings and is the only large sized object. Thus, in the local environment this building is something particular and we expect the data mining methods to reveal this knowledge.
4.4 Data Mining
We apply our test data set to the introduced data mining algorithms in Sect. 2.2: a classification method using ID3 and a clustering approach using Cobweb. The used software WEKA is described in (Witten & Eibe 1999). Both procedures process the attribute values as nominal categories, thus no transformation is needed.
Classification with ID3. This algorithm is a method for supervised learning and therefore needs classified examples. The result is a decision tree provid-ing the shortest optimal description possible for a classification into the given classes. As in our study there are no classified examples, we use this procedure iteratively and enhance our data set with the class landmark (values: yes, no). Therefore, we iteratively hypothesize each building to be a landmark, whereas all the other buildings are no landmarks. ‘Real’ / true landmarks then are identified by yielding the most simple / shortest description.
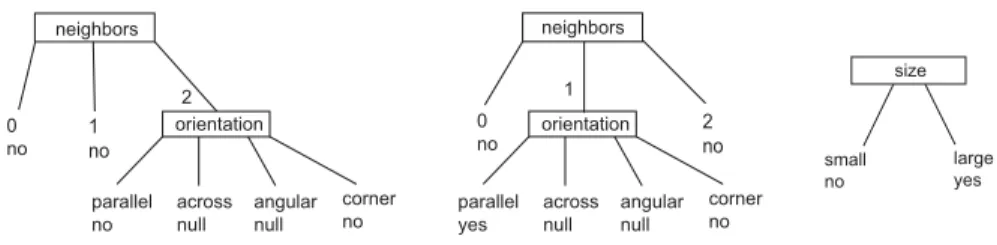
In Fig. 3 the results for three different buildings (1, 8, 3) are shown. In the boxes the discriminating attribute (e.g. neighbors) is shown, at the branches and leafs the attribute values (0, 1, 2) and the decision (landmark yes, no or null) are
given. ‘Null’ indicates that no existing examples with such values are existing in the training data set.
The decision tree for identifying building number 8 as landmark (see middle of Fig. 3) reads as follows: If the number of neighbors is 1 and the orientation is parallel, then the object is a landmark.
On the left hand side of Fig. 3 the first building is determined being a land-mark, but the decision tree provides no decision rule to determine a landmark positively at all. Consequently, this decision tree makes no sense and building number one is no landmark.
In contrast the result for building 3 (given at the right hand side of Fig. 3) shows the discriminating attribute ‘size’, which immediately distinguishes be-tween landmark and no landmark. It needs only a very short description corre-sponding to less branching in the tree to detect that a landmark discriminates from all other objects by only one attribute. And in fact, in our synthetic data set this record holds the only attribute-value being singular.
neighbors 2 0 no 1 no orientation parallel no across null angular null corner no neighbors 1 0 no 2 no orientation parallel yes across null angular null corner no size small no large yes
Fig. 3.ID3 - results of records 1, 8 and 3
The remaining data records provide decision trees comparable to the left and the middle parts of Fig. 3, each providing either no positive landmark decision rule at all or only a longer desription with more branchings in the tree than the decision tree of record number 3. The software provides standard deviations for the calculation, admitting that in most cases no complete classification of all examples was possible.
The conclusion can be drawn that a landmark is characterized by a short decision tree with only a few levels that leads to positive landmark decision. From this result, the guiding instruction for that junction would be e.g. ‘pass the large building’ (or ‘turn left at large building’).
Clustering with Cobweb. This is a hierarchical clustering algorithm and
thus an unsupervised learning method. Using this technique needs no explicit examples. Unclassified examples are parted in a hierarchy of natural groups by this procedure.
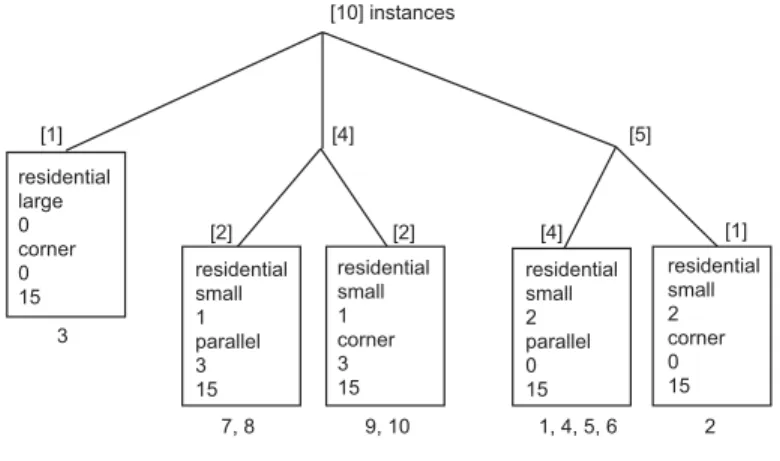
The results of our data set computed with Cobweb are given in the decision tree in Fig. 4. The depicted tree shows the discrimination of the 10 instances in different branches. On the first level the records are diverted in three clusters
consisting of 1, 4 and 5 instances. The latter two were further separated in two clusters containing only instances containing completely identical examples, where all attributes have the same values. The boxes enumerate the values of all attributes in the given cluster, below the boxes the corresponding instances are referenced to make a comparison with Fig. 2 possible.
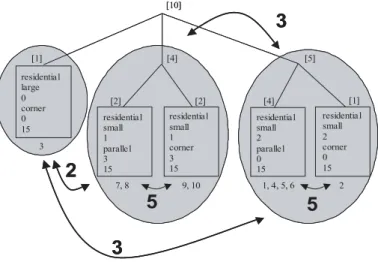
As it is clearly visible, the procedure aggregates similar instances into clusters. The more deviations in attribute values exist, the greater the distance in the hierarchical tree gets. Considering the cluster of the first level (see Fig. 5) the grey circles reveals the similiarity of the instances within the clusters. The groups built with 4 and 5 instances on the first level have 5 of 6 attribute values in common. Comparing the clusters of level one to each other, decreasing similiarity becomes clear. There are 2 or 3 attribute values identical, respectively this difference leads to the subdivision into 3 branches. The attributes of building number 3 differ very clearly from the other instances and therefore this record is isolated from the other clusters in one of the first levels.
Since the algorithm subdivides the records into similar groups, an instance with strongly different attribute values is separated from the others at a very high level in the decision tree. Because of its singularity, it is all alone in its group.
residential large 0 corner 0 15 residential small 1 parallel 3 15 residential small 1 corner 3 15 residential small 2 parallel 0 15 residential small 2 corner 0 15 [10] instances [1] [4] [5] [2] [2] [4] [1] 3 7, 8 9, 10 1, 4, 5, 6 2
Fig. 4.Results of Cobweb
5
Conclusion and Future Work
This paper presented an approach to automatically discover landmarks in spatial databases. In this study we concentrate on a building database. Based on two different data mining methods - classification and clustering - the algorithms ID3 and Cobweb are used to analyse synthetic test data of a spatial situation. The results reveal the potential of the methods for discovering landmarks: they are
residential large 0 corner 0 15 residential small 1 parallel 3 15 residential small 1 corner 3 15 residential small 2 parallel 0 15 residential small 2 corner 0 15 [10] [1] [4] [5] [2] [2] [4] [1] 3 7, 8 9, 10 1, 4, 5, 6 2
5
5
3
3
2
residential large 0 corner 0 15 residential small 1 parallel 3 15 residential small 1 corner 3 15 residential small 2 parallel 0 15 residential small 2 corner 0 15 [10] [1] [4] [5] [2] [2] [4] [1] 3 7, 8 9, 10 1, 4, 5, 6 25
5
3
3
2
Fig. 5.Coweb decision tree: attribute values in common
characterized by being salient in their environment and the procedures reveal such singularity of objects either by the shortest possible decision tree (ID3) or by a cluster separated at a very high level containing only one element (Cobweb). Both methods seem to be suitable for the discovering process. To check the find-ings, whether they can be generalized for more applications, they have to be verified by applying it to real data basing on the proposed attributes in Tab. 1. The results with these data mining methods look very promising. Both lead to the desired result of identifying locally salient objects, that are likely to be dis-tinguishable by (a set of) simple attributes. The advantage of the ID3 algorithm is the fact, that the discriminating attributes are directly identified in the pro-cess and can directly be used as guiding instruction. Another option is to merely present a depiction, where the landmark objects are highlighted (Sester 2002). With Cobweb, in contrast, only the landmark object is identified. Its (visually) characterizing attributes have still to be extracted.
These methods provide a mechanism to fully automatically extract objects with a relative uniqueness in a given environment. It is very flexible as it allows the introduction of arbitrary objects with arbitrary attributes - and still leads to the identification of the most unique object adapted to a given situation. It could even be used to accommodate to certain external conditions like seasons (limited visibility because of dense vegetation in the summer) or day-light, which leads to a pre-selection of certain attributes and thus to different landmarks.
Further investigations on the procedure to select the users appropriate neigh-borhood have to be done. The moving direction of the user will be taken into account. In addition, the analysis process has to be extended to different
ob-ject types (traffic constructions, parks, sporting facilities . . . ). Methods for data processing of different object types and categories has to be developed. The re-liability of the extracted landmarks has to be determined by a quality measure to avoid ambiguous landmarks misleading the user.
The long-term objective is to provide an approach to discover the needed land-marks within spatial databases in one single step.
References
Anders, K.-H. & Sester, M. [2000], Parameter-Free Cluster Detection in Spatial Databases and its Application to Typification,in:‘International Archives of Pho-togrammetry and Remote Sensing’, Vol. 33(Part B4/1), ISPRS Congress, Ams-terdam, pp. 75–82. Comm. IV.
Cios, K., Pedrycz, W. & Swiniarsky, R. [1998], Data Mining Methods for Knowledge
Discovery, Kluwer Academic Publishers.
Elias, B. [2002], Automatic Derivation of Location Maps,in:‘GeoSpatial Theory, Pro-cessing and Applications’, Vol. 34/4, Ottawa, Canada.
Fayyad, U. M., Piatetsky-Shapiro, G. & Smyth, P. [1996a],Advances in Knowledge
Dis-covery and Data Mining, AAAI Press/The MIT Press, Menlo Park, Californien,
chapter From Data Mining to Knowledge Discovery: An Overview, pp. 1–34. Fayyad, U. M., Piatetsky-Shapiro, G., Smyth, P. & Uthurusamy, R., eds [1996b],
Ad-vances in Knowledge Discovery and Data Mining, AAAI Press/The MIT Press,
Menlo Park, Californien.
Frawley, W. J., Piatetsky-Shapiro, G. & Matheus, C. [1991], Knowledge Discovery in
Databases, AAAI Press/The MIT Press, Menlo Park, Californien, chapter
Knowl-edge Discovery in Databases: An Overview, pp. 1–27.
Golledge, R. D. [1999], Wayfinding Behavior, John Hopkins Press, chapter Human Wayfinding and Cognitive Maps, pp. 5–45.
Koperski, K., Adhikary, J. & Han, J. [1996], Spatial Data Mining: Progress and Chal-lenges,in:‘Research Issues on Data Mining and Knowledge Discovery’, Montreal, pp. 55–70.
Lovelace, K., Hegarty, M. & Montello, D. [1999], Elements of Good Route Directions in Familiar and Unfamiliar Environments,in:C. Freksa & D. Mark, eds, ‘Spatial Information Theory: Cognitive and Computational Foundations of Geographic Information Science’, Springer Verlag, pp. 65–82.
Lynch, K. [1960], The Image of the City, The MIT Press, Cambridge.
Michon, P.-E. & Denis, M. [2001], When and Why Are Visual Landmarks Used in Giving Directions?,in:D. Montello, ed., ‘COSIT 2001’, Springer Verlag, pp. 292– 305.
Quinlan, J. R. [1986], ‘Induction of Decision Trees’,Machine Learning.
Raubal, M. & Winter, S. [2002], Enriching Wayfinding Instructions with Local Land-marks,in:M. Egenhofer & D. Mark, eds, ‘Geographic Information Science’, Vol. 2478 ofLecture Notes in Computer Science, Springer Verlag, pp. 243–259. Sester, M. [2000], ‘Knowledge acquisition for the automatic interpretation of spatial
data’,International Journal of Geographical Information Science14(1), 1–24. Sester, M. [2002], Application Dependent Generalization - The Case of Pedestrian
Nav-igation,,in:‘GeoSpatial Theory, Processing and Applications’, Vol. 34/4, Ottawa, Canada.
Sorrows, M. & Hirtle, S. [1999], The Nature of Landmarks for Real and Electronic Spaces, in: C. Freksa & D. Mark, eds, ‘Spatial Information Theory: Cognitive and Computational Foundations of Geographic Information Science’, Springer Verlag, pp. 37–50.
Tversky, B. & Lee, P. [1999], Pictorial and Verbal Tools for Conveying Routes, in:
C. Freksa & D. Mark, eds, ‘Spatial Information Theory: Cognitive and Computa-tional Foundations of Geographic Information Science’, Springer Verlag, pp. 51– 64.
Witten, I. H. & Eibe, F. [1999], Data Mining: Practical Machine Learning Tools and