Structural and Functional Effects of KRas
Monoubiquitination at Lysine 104
By Jerry Zhang
Senior Honor’s Thesis Department of Chemistry
University of North Carolina at Chapel Hill
27 April 2018
Approved:
Dr. Sharon Campbell, Thesis Advisor
Dr. Erik Alexanian, Reader
Abstract
:
K-Ras, a member of the Ras superfamily GTPases, plays a key role in regulating cellular growth, and single point mutations in this protein that promote chronic activation are found in
approximately 30% of human cancers.1 Recent findings have suggested that post translational modifications such as monoubiquitination of KRas can alter its intrinsic activity.2 This project invstigated the effects of mUbRas104, the minor site of native in vivo modification, in the context of its impact on protein structure and activity relative to that of WT KRas and mUbRas147. The structural changes of mUbRas104 were characterized using NMR techniques and Rosetta
modeling, and the protein’s activity was characterized through various biochemical assays. From the NMR data, chemical shift perturbations, broadening, and changes in secondary structure were observed throughout the protein. Perturbations in the switch regions are consistent with a slightly disturbed binding affinity to downstream effector proteins, but are more localized in switch II and helix 3, contrary to the predominant switch I perturbations found in mUbRas147. These findings suggest that mUbRas104, as a minor site of monoubiquitination, does not cause the same magnitude of functional disturbances as does mUbRas147. From these experiments, a
protocol was also developed to irreversibly ligate the ubiquitin molecule, and this protocol can now allow this system to be studied in vivo for future work.
Introduction:
Ras GTPases function as molecular switches by cycling between inactive GDP- and active GTP-bound states to regulate cellular growth control. They are part of a large (>150 member)
superfamily of proteins that bind guanine nucleotides, GDP and GTP, with high affinity and hydrolyze bound GTP to GDP.3 When GTP is bound, Ras undergoes a conformational change that promotes higher affinity binding to downstream targets relative to the GDP-bound state. These changes in conformation occur in two distinct switch regions, switch I (residues 30–37) and switch II (60–76). Both of these switch regions engage downstream effector proteins.4 The Raf kinase is a key downstream effector of Ras that promotes MAP Kinase regulation to alter gene transcription.1 It contains Ras binding domain (RBD) used in this work and binds strongly to the switch I region in the active Ras-GTP state with 105 fold higher affinity relative to the GDP bounds state.4 Ras has a low intrinsic ability to hydrolyze its own bound GTP, however, hydrolysis is greatly stimulated by GTPase Activating Proteins (GAPs).2 These proteins help Ras hydrolyze its bound GTP into GDP, rendering the Ras inactive. The process of activating the protein involves regulation using Guanine nucleotide Exchange Factors (GEFs), to facilitate exchange of bound GDP with GTP, thus activating the Ras molecule. Mutations that interfere with this GEF/GAP mechanism can lead to Ras becoming constitutively active. The hyper activation of GEF or inhibition of GAP can lead to deregulated cell proliferation and cancer.2
Extensive research has been conducted in the past to investigate common single residue mutations and their effects on Ras activity. These single point mutations have been well documented to inhibit nucleotide exchange and/or catalysis, promoting Ras signaling and cell proliferation. However, in recent years, surface lysine post translational modifications (PTMs) have been found to also significantly alter Ras function.5 These modifications include
a single ubiquitin protein through a linker, of HRas affects its association with endosomes whereas modification of KRas at 117 and 147 can promote Rasopathies and cancer.6 Previous research from our lab investigated the functional consequences of monoubiquitination on KRas at residues 104, 117, and 147 (mUbRas104, mUbRas117 and mUbRas147).2,7 Our work concluded that post translational modification at 147 caused an increased in the accumulation of GTP bound Ras despite not affecting Ras stability or intrinsic catalytic activity. The accumulation was
instead caused by inhibition of GAP mediated hydrolysis due to a decreased binding affinity of GAPs to Ras.
Lysine 104 is a hot spot for PTMs such as acetylation or monoubiquitination, but its functional effects are less understood than modification at other sites.7 Contrary to the modification at Ras147, investigations into mUbRas104 previously showed that Ras retains normal GEF/GAP activity.7 However, activity tests conducted on the non-ubiquitinated K104C Ras showed a decrease in GEF activity due to the absence of a key electrostatic interaction between the surface lysine that stabilizes two helices within Ras. This electrostatic interaction occurs between the side chain of K104 and the backbone carbonyl groups of R73 and G75 in switch II, which helps stabilize the orientations of helix 2 (H2) and helix 3 (H3), and any mutation at this lysine 104 has been shown to cause a GEF defect.8 As ubiquitylation at 104 will also perturb this interaction, likely destabilizing interactions between H2 and H3, a known binding interface for GEFs, we hypothesize that ubiquitylation at 104, stabilizes this key Ras-GEF interface through a crowding mechanism.
This project expands on the previous research and aims to characterize the effects of
monoubiquitination at Ras104 through the ligation of a ubiquitin protein to KRas with a disulfide bond. We will use NMR 2D and 3D studies to characterize chemical shift changes and quantify changes in secondary structure between WT KRas and mUbRas104 using isotopically enriched protein. In addition, we will perform biochemical activity assays using fluorescent nucleotides to measure the relative effector binding strength of ubiquitin-modified Ras and measure the GEF exchange rates using a real time NMR approach. To test our hypothesis that crowding by ubiquitin will restore RasK104C GEF function through an occlusion effect, we will use TMAO, a protein crowding agent and measure its effects on RasK104C activity through the aforementioned assays. Our characterization studies aim to reveal how ubiquitination of KRas at lysine 104 promotes conformational/dynamic changes in the switch regions and helix 3 to retain GEF activity to RasK104C.
Experimental Methods:
Constructs:
The human cDNA sequence that encodes the G-domain of each Ras mutant (C118S and K104C residues 1-169) was subcloned into a pET21 vector. The human cDNA that encodes the SOS1 gene (SOScat) was subcloned into a pQlinkH vector. The human cDNA that encodes the
DNA Transformation for expression in bacteria:
The main proteins of interest were RasC118S (1-166), RasK104C (1-166), UbiquitinG76C, bRaf, and the GEF Soscat. RasC118S has a surface cysteine at 118 modified to a serine to limit possible dimerization or oxidation. Previous research had shown that this modification did not alter any structure or function compared to true wildtype KRas, so RasC118S was used as the wildtype control for the rest of the experiments.2 The DNA for these proteins had previously been created through recombination and were sequence confirmed. The desired DNA (1µL) was mixed with competent cells. BL21DE3 RipL was used for the expression of Ras and other effectors while BL21DE3 pLysS was used for the expression of ubiquitin. The cells were incubated on ice for 25 minutes, heat shocked at 42°C and then placed back on ice for two minutes. They were then plated on LB Agar plates containing antibiotic and incubated at 37°C for 16-24 hours.
Protein Expression:
LB media (1L) was autoclaved (10 g Trypton powder, 10 g NaCl, 5 g Yeast extract), and 40 mLs of LB was used to make the starter cultures. The proper antibiotic was added along with a single colony from the plate of interest using a flame sterilized inoculating loop. These starter cultures were grown overnight at 280 rpm at 25°C. Optical density (OD) at 600 nm was checked the next day, and if it reached a growth greater than 1.0, the culture was spun down to a pellet. The pellet was resuspended in 1L of LB containing Ampicillin and Chloramphenicol. This was incubated in the shaker at 225 rpm at 37°C. When OD reached 0.55, the flasks were placed on ice to slow growth and the shaker was cooled to 18°C. (Ubiquitin growth did not involve cooling and continued overnight at 37°C). Once cooled, the flasks were placed back into the shaker and each culture was induced with 800 µL of 0.5 mM IPTG. Growth was allowed to continue overnight and the culture was collected the next day by spinning the culture down at 4000 RPM for 25 minutes. The pellet was suspended in 40 mLs of the respective wash buffer (20 mM Hepes, 300 mM NaCl, 5 mM MgCl2, 20 mM imidazole, 10 µM GDP, 5% glycerol, pH 7.75 for KRas/SosCat and 30 mM Hepes, 150 mM NaCl, 5mM MgCl2, 10 mM imidazole, pH 8.0 for Ubiquitin/bRaf) used for purification and stored.
If isotopically labeled proteins (15N or 15N/13C-enriched Ras) were needed for NMR, M9 minimal media was used for growth instead of LB. M9 media was prepared by adding 2.0 mL 1.0 M MgSO4, 500 µL 1.0 M CaCl2, 168 µL 0.3 M ZnSO4, 10 mL of 100x sterile filtered vitamins (5 mg biotin, 5 mg choline chloride, 5 mg folic acid, 5 mg niacinamide, 5 mg D-pantothenate, 5 mg pyridoxal, 0.5 mg riboflavin, 50 mL H2O), 90 mg thiamine and 1X of the proper antibiotics to 100 mL of autoclaved 10x M9 salts (pH 7.4) and 885 mL ddH20. Depending on the labeling, 1 g of 15N NH4Cl, and/or 2 g 13C Glucose were added. The steps for overnight cultures, induction and collection remain the same.
Protein Purification:
desired cell culture was sonicated with cOmplete ULTRA Tablet protease inhibitor cocktail and spun down.
KRas/SosCat purification - The nickel column was equilibrated with buffer A (20 mM Hepes, 300 mM NaCl, 5 mM MgCl2, 20 mM imidazole, 10 µM GDP, 5% glycerol, pH 7.75). The supernatant was then added to the column. The protein on the column was washed with buffer A, followed by buffer B (20 mM Hepes, 1M NaCl, 5mM MgCl2, 40 mM imidazole, 10 µM GDP, 5% glycerol pH 7.75), then another wash using buffer A, before eluting with buffer C (15 mM Hepes, 50 mM NaCl, 5 mM MgCl2, 250 mM imidazole, 10 µM GDP pH 7.75). Fractions were collected for each wash phase, and samples were mixed with reducing dye for an SDS-PAGE gel run later to confirm expression and yield.
Ubiquitin/bRaf purification – The nickel column was equilibrated with wash buffer (30 mM Hepes, 150 mM NaCl, 5mM MgCl2, 10 mM imidazole, pH 8.0 ). The supernatant was then added to the column and a gradient elution was applied using wash buffer and elution buffer (20 mM Hepes, 1M NaCl, 5 mM MgCl2, 250 mM imidazole, pH 8.0). The gradient ran from 100% wash 0% elution to 85% wash and 15% elution for 160 mL. The protein was then eluted using 100% elution buffer. Fractions were collected for each wash phase, and samples were mixed with reducing dye for an SDS-PAGE gel run later to confirm expression and yield.
The collected protein fraction was then transferred into a dialysis membrane. The Ras or Soscat proteins were placed in membranes with cutoffs at 8.0 kDa whereas Ubiquitin or bRaf proteins were placed in 3.5 kDa cutoff membranes. Once transferred, an excess of TEV protease was added to the dialysis membrane. The membrane was then sealed, placed in dialysis buffer, and allowed to undergo dialysis overnight in the cold room. The next day, a gel was run of sample to determine TEV cleavage efficiency along with the wash fractions from the previous day. The protein was collected by running it through the nickel column again if the protein successfully had its His-tags cleaved.
If needed, protein was further purified by size exclusion on a Sephadex G-75 column using fast protein liquid chromatography, FPLC buffer (50 mM Hepes, 150 mM NaCl, 5 mM MgCl2, 15 µM GDP pH 7.75).
Concentration Determination
The concentration of proteins was determined by measuring the absorbance using a Shimadzu UV-2501 PC UV-Vis Spectrophotometer at A280 in a 500 µL quartz cuvette with a path length of 1 cm. The protein was first spun down at on a high-speed tabletop centrifuge to pellet any debris. Protein concentration was then determined using Beers law with the molar extinction coefficient for Ras at 19920 M-1cm-1 and for Ubiquitin at 1420 M-1cm-1.
Ubiquitination Reaction using Reversible Disulfide:
mixture is mixed with non-reducing loading dye and kept as a control. Two liters of
ubiquitination buffer were split into two 1L beakers, and the dialysis bag was placed into one of them. Dialysis was allowed to occur for 3-4 hours, at which point, the ubiquitination buffer was switched out for the other liter and allowed to dialyze overnight at 4°C. Two samples were taken the next day and one is mixed with reducing dye while the other is mixed with non-reducing. These were run on an SDS-PAGE gel to check if the reaction occurred successfully and all of the Ras had reacted. If not, more ubiquitin was buffer exchanged and added to the reaction mixture until all of the Ras had successfully ligated.
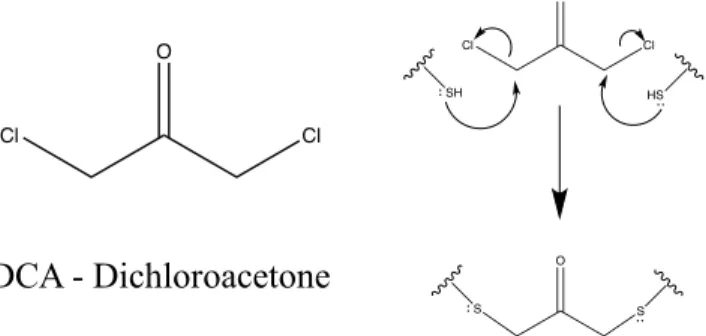
Ubiquitination Reaction using Irreversible Linker-DCA:
A separate protocol was developed to irreversibly ligate RasK147C and UbiG76C using a 1,3 dichloroacetone (DCA) linker. Ras and Ubi were separately buffer exchanged into reaction buffer (20 mM sodium borate, 5 mM MgCl2, 40 µM GDP 7 mg/50 mL TCEP pH 8.7). The proteins were concentrated down to less than 200 µL and were combined in a 1:3 Ras:Ubi ratio (roughly 0.7 mM Ras; 2 mM Ubi) . DCA was added so the final concentration of DCA was 0.8 mM and the reaction was allowed to proceed overnight on rotator. The reaction was checked the following day for completion using SDS-PAGE and reducing dye. The mUbRas147 is then isolated using a Sephadex G-75 column, FPLC buffer (50 mM Hepes, 150 mM NaCl, 5 mM MgCl2, 15 µM GDP pH 7.75).
Nucleotide Loading:
Nucleotide loading was performed using a fluorescent non-hydrolysable GTP analog Mant-GMPPCP. The Ras proteins were first buffer exchanged 4 times into the loading buffer (20 mM Hepes, 0.25 mM MgCl2, 50 mM NaCl pH 7.4) Once the samples were concentrated down to a volume of less than 700 µL, 500 µL of Alkaline Phosphatase (AP) beads, 100 µL ZnCl2, 100 mM (NH4)2SO4, 0.25 mM EDTA, and 0.02% NaN3 were added to an UV protected Eppendorf tube along with the GTP nucleotide so that the final ratio of Ras to nucleotide was 1:5. This tube was placed in a rotator and the exchange proceeded overnight. 50 µL was removed and boiled down initially to serve as a reference for the progress of the loading.
The next day, the AP beads were spun down out of solution and the supernatant transferred to a 10 kDa Amicon centrifuge tube for four rounds buffer exchange with Mant dissociation buffer (20 mM Hepes, 50 mM NaCl, 5 mM MgCl2 pH 7.4). The loading was checked the next day using an HPLC machine from Agilent Technologies on a C-18 bonded silica column using reverse phase liquid chromatography. The HPLC sample was prepared by boiling 50 µL of the protein and spinning it down for 5 minutes at 13000 rpm to denature and pellet the protein. The supernatant was run on the column along with Mant-GMPPCP and GDP as references.
Fluorescent Binding Assays:
Following loading, binding assays were set up using the loaded Ras and purified bRaf. The bRaf was first exchanged 4x with the Mant dissociation buffer. PCR strip tubes were then laid out for a total of 12 different reactions for each Ras protein. The ligand concentrations ranged from 0.0 to 14.0 µM. Each reaction tube contained 1.5 µM Ras and its respective concentration of ligand in a final reaction volume of 90 µL. 500 µM of GDP was added right before running the assay to ensure capture of the beginning data points. Each reaction was split into two wells on a 384 well plate and the plate was read by a SpectraMax M5 plate reader. Readings were taken at 25
second intervals for 2 hours with the excitation wavelength set at 335 nm and emission
wavelength at 448 nm. Results for each run was normalized to the maximum florescence and the rates were fitted to a one phase exponential decay curve to obtain the binding constant.
In the binding experiments using Trimethylamine N-oxide (TMAO), 0.5M of TMAO was added to the reaction volume.
NMR Experiments
NMR experiments were conducted by buffer exchanging the 15N or 15N13C enriched protein into NMR buffer (20 mM Tris-Maleate, 50 mM NaCl, 5 mM MgCl2 pH 6.5) with 5% D2O and 20 µM GDP. The experiments were conducted at 25 °C on either the Bruker Avance III 700 or 850 MHz NMR spectrometers. 2D 1H-15N HSQC experiments were recorded for both WT and mUbRas104 bound to GDP, and average 1H-15N chemical shift perturbations were calculated according to the square root of ((Δσ 1H)2 + (Δσ 15N)2/25), where Δσ 1H and Δσ 15N are the observed changes in 1H and 15N chemical shifts.
Backbone resonance assignments of mUbRas104 were obtained by analysis of 3D HNCA spectra recorded on 13C,15N-labeled mUbRas104 bound to GDP. The assignment of Cα, N, and HN chemical shifts was obtained by an iterative procedure using the program MARS and manual inspection and using WT KRAS assignments.9 For CSI, ΔCα values were calculated by subtracting experimental chemical shifts of Cα from random coil values obtained from the ncIDP (neighbor-corrected intrinsically disordered protein) server.10
Real Time NMR
During exchange, two distinct peaks can be seen for specific residues, each corresponding to either a GDP or GTP population. Using Topspin software, the peak intensity for S118-GDP and S145-GDP were recorded and divided by S118-GTP and S145-GTP peak intensity respectively to obtain the relative population of each Ras-GTP or Ras-GDP bound state. These data points were then fitted to a one phase association or dissociation curve to obtain the rates of association or hydrolysis.
Results:
Generation of mUbRas system
The project heavily relied on the ability to reliably generate mUbRas104, and this process took several months to optimize, but now a protocol has been developed to consistently generate this system. To study site specific monoubiquitination at residue 104, chemical ligation through the formation of a disulfide bond between the terminal cysteine on the tail of UbiG76C and the surface cysteine on the mutant RasK104C was achieved. The exposed cysteines were very sensitive to oxidation and must be kept reduced using TCEP. The pH was shifted to 7.85 during the reaction to increase strength of the nucleophile, and the cell line for Ubiquitin expression was changed to pLyss to prevent oxidation. After the generation of the mUbRas104 by titrating out the reducing agent, no further purification steps were taken once the mUbRas complex was formed since previous research had demonstrated Ubi-Ubi and free Ubiquitin does not interfere with Ras function.2
Figure 1. SDS-PAGE separating the overnight reaction products of the RasK104C-UbiG76C
disulfide reaction. Two samples were taken after initially mixing the proteins together and combined with reducing (R) and non-reducing (NR) dye to serve as a reference in lanes from Day1. After overnight of dialysis to remove TCEP, almost all of the Ubiquitin has dimerized or formed mUbRas. This can be seen in the Day 2 lane with the non-reducing dye. The reduced lane of Day 2 shows that all of the original protein was still present and no degradation occurred.
Development of DCA covalent monoubiquitination reaction
This reaction was optimized with regard to protein concentration, reaction time, pH, and DCA concentration. This method was used to generate mUbRas147 in large quantities and isolated through S75 gel filtration, something previously not possible with the disulfide bond method due to the need of excess ubiquitin in solution to drive the equilibrium toward mUbRas bond
formation. This method was only developed toward the end of the experiments, so all data presented was conducted using the disulfide ligation system. R. Thurman conducted bRaf binding experiments using mUbRas generated using this method and confirmed the properties parallel that of mUbRas disulfide system.
Figure 2. SDS Gel showing ubiquitination using the DCA method. Samples in 3 lanes were taken at various reaction times, initial, 2 hr, and overnight, and show a significant amount of mUbRas forming as a function of addition time. Concentrations of protein need to be higher for this method to ensure reaction (0.7 mM RasK147C and 2.1 mM UbiG76C).
NMR data of mUbRas104 shows NMR chemical shift perturbations and changes to secondary structure in switch II and Helix 3
Once the method for reliably generating mUbRas104 was created, 13C and 15N-enriched RasK104C was grown and reversibly monoubiquitinated using the disulfide method to perform 3D HNCA NMR and obtain backbone assignments. Using Mars and manual Ca alignment peak picking, 141 out of 169 possible peaks were assigned for mUbRas104. These assignments were then used to map chemical shift perturbations and broadening relative to WT HSQC data.
Cl Cl
O
SH HS
O
S S
Cl Cl
O
Figure 3. Monoubiquitination of KRas-GDP at 104 causes NMR perturbations within the Switch regions and Helix 3.1H-15N 2D NMR HSQC of mUbRas104 (blue) and WT KRas (red). Spectra were recorded using a Bruker Avance III 700 at 25 °C on 0.1 mM KRas WT and
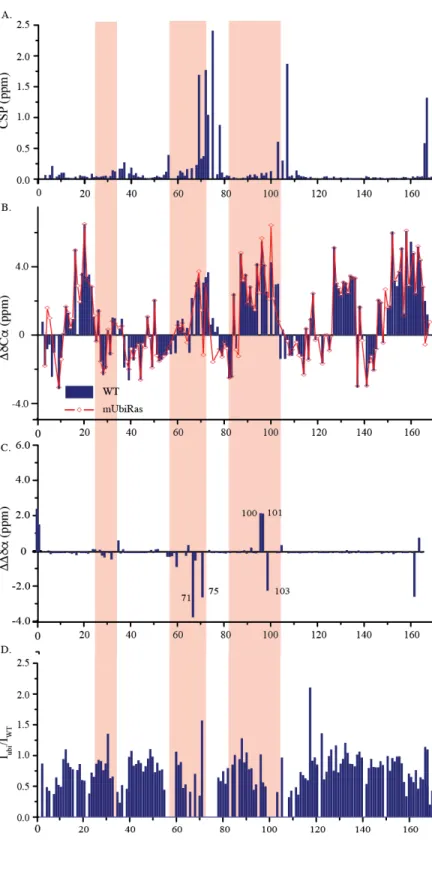
Figure 4. Monoubiquitination of KRas at 104 causes structural perturbations in helix 2 and helix 3. (A) NMR analyses of peak shifts reveal that the mUbRas104 causes large CSPs in switch II and neighboring residues in helix 3 but minor changes in β1 within switch 1. CSP was calculated based on weighted average chemical shift (square root of ((Δσ 1H)2 + (Δσ 15N)2/25)) of WT and mUbRas104 NH peaks in 1H-15N 2D HSQC NMR
spectra. (B) differences in secondary structure determined from Cα and Cβ chemical shift indexing indicate that mUbRas104 causes perturbation to the local conformation surrounding 104 in H3 and the α2 helix (residues 71–74) within switch II. (C) The difference in chemical shift indexing between mUbRas104 and WT KRAS indicates that the KRAS ubiquitination perturbs the local
The perturbations and broadening in the switch regions suggest changes in the electrochemical environment and dynamics that may affect regulator and effector recognition. Broadening seen in the switch regions and helix 3 indicate a change from fast exchange on the NMR time scale to a more intermediate/slow time scale. This trend indicates that these regions are more constrained and rigid in dynamics, possibly due to the steric bulk of the ubiquitin. Secondary carbon
chemical shift data show a loss of helical secondary structure in helix 2 and 3.
Exchange data shows a loss of intrinsic hydrolysis, maintains its GEF exchange rate
Due to fluorescence quenching observed when attempting to perform fluorescence-based exchange assays as described in Baker et al. 2013, a real time NMR method was instead established from Smith et al. 2015 for GEF exchange.7,12 The rate of intrinsic GTP hydrolysis was also needed since the GEF exchange occurred over a time frame of 3 hours, where the intrinsic hydrolysis rate of Ras could affect the readings. The data was plotted according the time between the acquisitions with relation to the relative GDP/GTP populations of Ras.
Figure 5. Ubiquitination retains Sos mediated exchange (A). Nucleotide exchange of WT and mUbRas104 in the presence of SosCat. Ras was bound to GDP and incubated with access of GTP at ratio of 15:1 and the presence of SOS (Ras:Sos 1700:1). (B). Sos-mediated exchange rates shows that mUbRas104 has higher but not significantly different in exchange rate relative to Ras WT. (C) mUbRas104 shows 3-fold decrease in intrinsic hydrolysis relative to WT. (D) Difference spectra of 1H-15N HSQC of KRas-bound to GDP and GTP demonstrates the peak trackability that can be used to measure the real-time nucleotide exchange. %Exchanged and %Hydrolyzed were determined by GDP intensity/(GDP+GTP intensity) for each spectra acquisition with respect to the time of the acquisition. Results are mean ± S.E. (n=2).
The data presented in Figure 5 reflects previous published data that mUbRas104 retains its GEF exchange ability despite the chemical shift perturbations in the binding regions.
Table 1. Relative fold differences in rates of Sos exchange and hydrolysis for mUbRAS104 compared to WT. (+) indicates increased rate while (–) represents slower rate.
mUbRas104
Sos Exchange +1.31 ± 0.11
Intrinsic Hydrolysis -3.16± 0.13
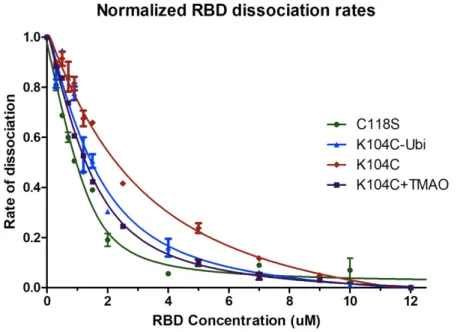
RBD binding data shows weakened binding, consistent with perturbations in the switch regions, but TMAO crowding effects could explain previous observations of mUbRas restoring GEF function
Following the exchange experiments, fluorescence based binding assays were conducted using the GTP bound form of the proteins to determine how monoubiquitination effects binding affinity to downstream effectors. Consistent with changes in CSP and dynamics of the switch regions observed by NMR, binding to the bRaf RBD decreased a relatively small amount by 3-fold. To test the hypothesis that mUbRas104 retains GEF interactions despite loss of electrostatic interactions between helix 2 and helix 3 via a crowding effect, a crowding agent TMAO was used by the suggestion of A. Guseman. Consistent with this premise, the presence of TMAO partially restores binding. Once TMAO is added, the RasK104C binding is enhanced 2-fold to reflect that of mUbRas104, while the binding of WT is not enhanced significantly. These results reflect the prediction that the Ubiquitin molecule, through contacts with Ras, may act as a
crowding agent through an occlusion effect and cause Ras to adopt a conformation that facilitates GEF binding.
effector protein concentration. To determine the affinity (KD) for the KRAS-effector complex, the data were fitted to a standard curve. mUbRas104 is shown to have three-fold weaker binding to cRaf, while RasK104C has roughly six-fold weaker binding. However, in the presence of TMAO, a crowding molecule, RasK104C binding to cRaf is enhanced, due to being in a tighter conformation, similar to what is predicted by monoubiquination. Relative binding affinity to KRAS WT is shown in Table 2. The results are reported as the fold binding affinity, weaker (-), stronger (+), between mutant Ras and WT ± S.E. (n = 2).
Table 2. Relative binding affinities between cRaf and various Ras(GTP) species as a fold difference vs. WT. Relative binding and kinetic values of mUbiRas compared to WT
mUbRas104 mUbRas147 K104C K104C+TMAO WT+TMAO
-3.34±0.87 -6.41±0.35 -6.46±1.18 -2.48±0.63 +1.06±0.50
*mUbRas147 data obtained from R. Thurman13
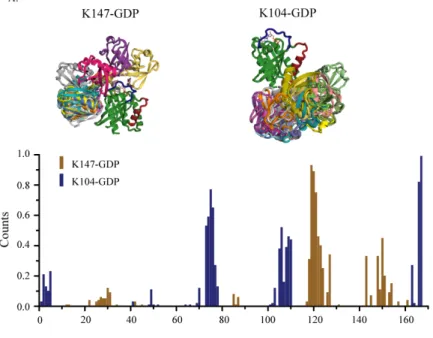
Rosetta modeling data shows mUbRas104 and mUbRas147 make contacts at distinct residues, explaining the differences in binding and activity data.
Figure 6. (A:top) Lowest scoring 20 models of GDP-bound mUbRas104 (left) and mUbRas147 (right) using Rosetta. Ras is in green and the isopeptide linked ubiquitin are multi-colored. Switch I (residues 26-38) is colored in blue and Switch 2 (residues 61-74) is colored in yellow. These models reveal that ubiquitin can adopt a spectrum of conformations while chemically conjugated to Ras. (bottom) Frequency of models that have a ubiquitin residue within 8Å of a residue on Ras. These frequencies are calculated from the top 580 (K104) or 814 (K147) models. Contacts with the Ras surfaces is in agreement with peak broadening seen in NMR for
mUbRas104 and mUbRas147. Panel B contains the same analysis, but for GTP-bound mUbRas.
(bottom) Frequencies for K104 and K147 are extracted from 1082 and 723 low-scoring models,
respectively.
Discussion:
This crowding explanation may help explain the observed increase in GEF exchange between RasK104C and mUbRas104 found through previous studies.6 While the RasK104C mutant may cause a significant loss of structure due to the mutation of a key lysine around the H2 and H3 region, preventing efficient GEF exchange, the crowding behavior of mUbRas104 may force a Ras to adopt a tighter conformation than the unmodified mutant due to an occlusion effect and restore GEF binding. The GEF we used, SosCat, primarily binds to Ras through switch II and H3 through electrostatic interactions with a few key residues on Ras: R102, V103, Q70, Y71, and R73.8 This site-specific binding between Ras-SosCat heavily relies on the positioning of these residues on H2 and H3, but the mutation at K104, causes a loss of the electrostatic interaction between H2 and H3. The loss of this key electrostatic interaction causes the two helices to adopt a more dynamic and open structure that hinders GEF binding.
The Rosetta modeling predicts that Ubiquitin has numerous contacts with switch II and H3 in mUbRas104 which could lead to two explanations. Either Ubiquitin is interacting with Ras in a site-specific manner, causing the structural changes and forcing a tighter conformation, or Ubiquitin is essentially crowding the protein through an occlusion effect by occupying the space the switch and helix regions tend to open into after the loss of the lysine 104 electrostatic
interaction. Since previous work using a large excess of Ubiquitin in the presence of Ras showed no site-specific interactions through NMR, the first explanation can be disregarded, which leads us postulate the second crowding interaction is the reason for observed effects.2 In addition, previous Rosetta modeling experiments have also predicted that the interactions are not specific to ubiquitin, but rather any small protein group PDZ2 modified at the same position are modeled to have the same effects, which reflects the second crowding mechanism where only a steric bulk is needed to cause the observed functional effects.2
To further test our Ubiquitin crowding hypothesis, real time NMR experiments have been planned for RasK104C GEF exchange in the presence or absence of TMAO. We hope to see the similar restoration of GEF activity when the Ras mutant is crowded with TMAO. If the ubiquitin molecule can indeed increase binding to dynamic regions of a protein simply by influencing conformational changes through steric bulk, then it would be a novel avenue of protein
regulation for future exploration. These experiments would involve characterizing the dynamics of mUbRas104, which were attempted, but due to instability of the disulfide system when exposed to air for extended periods of time, the protein could not remain stable through prolonged NMR dynamic experiments. The DCA method was developed to circumvent the flaws in the disulfide system and can be used in the future for these dynamic experiments. In addition, we hope to characterize the differences in the tightness of the conformation between RasK104C and
References:
1. Simanshu, D.K. et al. “RAS Proteins and Their Regulators in Human Diesease” Cell. 170, 17-33. (2017)
2. Baker R. et al. Site-specific monoubiquitination activates Ras by impeding GTPase-activating protein function. Nature Structural and Molecular Biology. 20, 46–53 (2013). 3. Cox, A.D. & Der, C.J. The dark side of Ras: regulation of apoptosis. Oncogene 22, 8999–
9006 (2003).
4. Herrmann, C. Ras-effector interactions: after one decade. Curr. Opin. Struct. Biol. 13, 122–129 (2003).
5. Sasaki, A.T. et al. Ubiquitination of K-Ras enhances activation and facilitates binding to select downstream effectors. Sci. Signal. 4, ra13 (2011).
6. Ahearn, I. M., Haigis, K., Bar-Sagi, D. & Philips, M. R. Regulating the regulator: post-translational modification of RAS. Nature Reviews Molecular Cell Biology 13, 39 (2011). 7. Baker, R. et al. Differences in the Regulation of K-Ras and H-Ras Isoforms by
Monoubiquitination. Journal of Biological Chemistry 52, 36856–36862 (2013). 8. Yin, G. et al. A KRAS GTPase K104Q Mutant Retains Downstream Signaling by
Offsetting Defects in Regulation. Journal of Biological Chemistry 292, 4446–4456 (2017).
9. Jung, Y. S., and Zweckstetter, M. Mars: robust automatic backbone assignment of proteins. J. Biomol. NMR 30, 11–23 (2004).
10.Tamiola, K., Acar, B., and Mulder, F. A. Sequence-specific random coil chemical shifts of intrinsically disordered proteins. J. Am. Chem. Soc. 132, 18000–18003 (2010). 11.Morgan, M. T. et al. Structural basis for histone H2B deubiquitination by the SAGA
DUB module. Science (New York, N.Y.) 351, 725–728 (2016).
12.Smith, M. J. et al. Real-time NMR monitoring of biological activities in complex physiological environments. Current Opinion in Structural Biology 32, 39–47 (2015). 13.Thurman, R., Siraliev-Perez, E. & Campbell, S. L. RAS ubiquitylation modulates