Christopher R. Kenrick.The Affordability of Information Service in the Digital Age. A Master’s Paper for the M.S. in Information Science degree. April, 2014. 23 pages. Advisor: Richard Marciano
Since the advent of the Internet, the concept of the “Digital Divide,” has been at the forefront of governmental policy discussions. The current president and his
administration have made huge strides in working to help Americans gain access to broadband services. However, the issues of connecting Americans to high-speed Internet go further than the expansion of broadband infrastructure. With the introduction of the smartphone to the global market, the ways in which we interact with information have changed drastically. This study seeks to determine whether currently available
information services are affordable to the population at large.
Headings:
Information Services
Digital Divide
Information Society
THE AFFORDABILITY OF INFORMATION SERVICE IN THE DIGITAL AGE
by
Christopher R. Kenrick
A Master’s paper submitted to the faculty of the School of Information and Library Science of the University of North Carolina at Chapel Hill
in partial fulfillment of the requirements for the degree of Master of Science in
InformationScience.
Chapel Hill, North Carolina
April 2014
Approved by
Introduction
Since the advent of the Internet, the concept of the “Digital Divide,” the separation
between those with Internet access and those without, has been at the forefront of
governmental policy discussions. Even today, debates on how best to close these gaps are
occurring. At the beginning of his term in office, President Barack Obama pledged to
expand broadband access throughout the nation, and by the end of his first term he called
on 14 government Broadband Member Agencies to accelerate broadband infrastructure
deployment (Exec. Order, 2012). This is what he hoped would be the first step in
bringing all residents of the United States a step closer to broadband1 Internet access.
To date, the president’s actions have had some success. On June 6, 2013, the
National Telecommunications and Information Administration (NTIA) announced that
household broadband adoption had climbed to 72.4 percent, which was an increase of 5.5
percent from a July 2011 report (NTIA, 2013). Additionally, in 2012, 78 percent of the
population had access to broadband speeds of 25 Mbps or greater, up from nearly 50
percent in 2010. However, the issues of connecting Americans to high-speed Internet go
further than the expansion of broadband infrastructure. Purchasing a personal computer is
a foreign thought to those who are struggling to even put food on their table (McGrath,
2011; Mossberger, 2012; Pearce, 2013)
Literature Review
In an ongoing effort to understand how U.S. residents interact with computers and the
Internet, the U.S. Census Bureau conducts the Annual Current Population Survey (CPS).
In 2011, the U.S. Census Bureau reported that of individuals with less than $25,000 in
household income, 35.6 percent had no Internet connectivity. Additionally, of individuals
with less than a high school diploma, 44.9 percent had no Internet connectivity.
With the introduction of the smartphone to the global market, the ways in which
we interact with information have changed drastically. In only two years, the adoption
rate of smartphones in America has increased by 21 percent, from 35 percent in May
2011, to 56 percent in May of 2013 (Smith, 2013). Each year saw a rise in subscribership
of approximately 10 percent. Recent studies showed nearly two-thirds of Black
(Non-Hispanic) and Hispanic cellphone owners using their mobile devices for the Internet,
compared to slightly more than half of White (Non-Hispanic) cellphone owners
(Lipsman, Aquino, 2013; Smith, 2012). For these same users, this number is up about
20% from studies conducted three years ago. Half of Black (Non-Hispanic) users who
use their smartphone for the Internet do most of their online browsing on their phones,
compared to two-fifths of Hispanics and one-fourth of Whites surveyed (Lipsman,
Aquino, Flosi, 2013; Smith, 2012). However, when compared to the U.S. average,
Hispanics are less likely to have access to Internet at home (Yelton, 2012; Sanchez,
2012). There are those who argue that ensuring individuals access to the Internet and the
technology to access it in a structured environment will lead to a drastic reduction in the
digital divide (Cotten, 2006; Boyera, 2007; Figueiredo, 2012).
others consider it a necessity (Facebook, 2013; Harris, 2013; Kuilema, 2012; Reamer,
2013). Today, the number of activities the average person engages in through the
Internet, both business and personal, are astounding, and the importance of broadband
does not seem to be dwindling. However, broadband is still mostly prevalent in wealthy,
well-educated, White (Non-Hispanic) communities (Warf, 2012). These are but a few of
the issues stemming from the Digital Divide.
M
ethodology
This study used a quantitative research design to determine whether currently available
information services are affordable to the population at large. In order to determine
affordability of information services, a combination of publically available data was
collected from the U.S. Census Bureau’s 2012 American Community Survey,2
information service provider websites,3 the Wall Street Journal’s Wireless Savings
Calculator,4 the National Broadband Map,5 and the Massachusetts Institute of
Technology’s Living Wage Calculator.6
The focuses of this research are 30 metropolitan statistical areas chosen by their
rates of poverty as of the 2012 5-Year American Community Survey. The metropolitan
areas were broken up into three sets of ten with the first group representing the highest
rates of poverty, the second group representing the ten metropolitan areas in the median
of poverty rates, and the final group representing the areas with the lowest rates of
2 Census Bureau data retrieved from: https://www.census.gov/acs/www/
3 Information Service data retrieved from:
http://www.timewarnercable.com/en/internet/internet-service-plans.html, http://www.verizon.com/home/fios-fastest-internet/, http://www.comcast.com/, http://www.att.com/shop/internet.html
4 Wireless Savings Calculator data retrieved from: http://graphics.wsj.com/PhonePlan/?mg=inert-wsj 5 National Broadband Map data retrieved from: http://www.broadbandmap.gov/
poverty. Affordability of information services is decided for these groups by comparing
the living wage of each metropolitan population against median household income for
each area, and determining whether the remaining income is enough to cover average
information service cost. Furthermore, this study looks at family household makeups in
order to determine who might be affected the most by high costs of information service.
In order to represent the income elasticity of metropolitan populations in this
study more accurately, median household income was calculated through measuring
median family income by family size,7 against households and family makeup.8 Using
these measures allowed for focusing on four common household types, Married-couple
family households with children under 18 years, single parent father run households with
children under 18 years, single parent mother run households with children under 18
years, and nonfamily households with no children under 18 years.
In order to determine living income thresholds, information was collected from
the Living Wage Calculator (LWC), created by Dr. Amy K. Glasmeier, Department Head
of the Urban Studies and Planning program at the Massachusetts Institute of Technology
(Glasmeier, 2013). The LWC determines the necessary income needed to meet the
minimum standards of living. In order to determine these standards, the LWC gathers
federal, state, and regional data on the costs associated with food, child-care, healthcare,
housing, transportation, other necessities, and taxes, for counties and Census places in the
United States.
To compare wireless and broadband costs, this study looks at standard packages
7 Collected from the 2012 5-Year American Community Survey B19119 Median Family Income in the Past
12 Months (In 2012 Inflation-Adjusted Dollars) By Family Size
offered by four of the largest Internet service providers9, and four of the largest wireless
service providers10, in terms of customers and coverage area. In order to account for
households with more than one adult requiring phone or Internet access, total average
smartphone and broadband costs include the price of two smartphone plans or two basic
phone plans11. For wireless services, data was gathered on two-year contracts for new
phone lines with plans including unlimited minutes, unlimited text messages, and one
Gigabyte of data, as these represented the most common wireless package plans. Three of
the four wireless service providers offer subsidized plans in which a new customer can
purchase a newly released phone at a subsidized cost or choose an older model phone at
no cost. As such, the data collected on three of the wireless service providers does not
include the cost of a phone in the two-year total cost. For broadband Internet service
packages, data was gathered on two-year contracts for the equivalent of a standard
broadband Internet package,12 costs to purchase or rent a modem, the cost of an
affordable home computer,13 and the cost of two basic phones and monthly prepay
plans.14
Findings and Discussion
Out of the four wireless providers, the price for two years of service for two lines with
unlimited minutes and texts, as well as one Gigabit of data, ranged from a low of $1,944
9 The Internet service providers are: Time Warner Cable, Comcast Xfinity, AT&T, and Verizon FiOS 10 The wireless service providers are: AT&T, T-Mobile, Sprint, and Verizon Wireless
11 For this study, it is assumed that customers who choose broadband over smartphones will still seek out
an affordable basic phone
12 Standard broadband packages ranged from 15 Mbps to 25 Mbps download speeds, however, they were
chosen for their relative pricing
13 Dell Inspiron 15” Non-Touch Laptop Computer Retailing at $300
14 The four wireless providers used for this study also offer basic phones and monthly plans through the
with AT&T, and a high of $3,700 with T-Mobile. When looking at the four broadband
providers, the price for two years of service and two basic prepay phones ranged from a
low of $3,590 with Time Warner Cable, to a high of $3,866 with Verizon FiOS.15
Figure 2: High Poverty Metro Areas Making Above a Living Wage
One of the most significant findings from this study is the majority of single
parent households in high poverty areas are unable to afford information services. Before
information services are taken into account, in high poverty metro areas, only 50 percent
of male run single parent households are making equal to or above a living wage.
However, as seen in Figure 2, female run single parent households fare worse at only
30% making equal to or above a living wage. Contrast these findings with affordability of
information services in median and low poverty areas, where every household makeup
15 Look to Appendix 3 for full Wireless and Broadband report
50%
40%
30%
30% 30% 30%
0% 10% 20% 30% 40% 50% 60%
No Informa*on Services With Wireless Service With Broadband Service
High Poverty Metro Areas Making Above a Living
Wage
Male single parent household with children under 18 years
(married-couple, single-parent, and nonfamily) is making above a living wage, and can
afford either of the information service types.
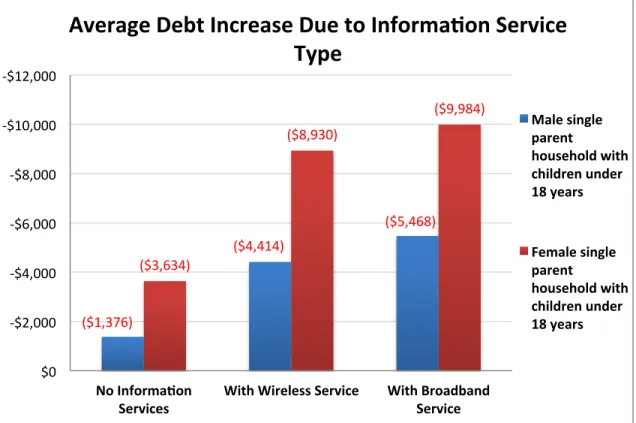
Figure 3: Average Debt Increase Due to Information Service Type
By looking at Figure 2, it might seem as if information service might not be too
expensive, as 30 percent of female single parent households in high poverty areas are still
able to make a living wage regardless of the information service type they adopt, but this
is not the entire picture. In Figure 3, an average is taken of the amount below the living
wage households in low poverty areas are experiencing. As you can see from the figure,
for households making below the living wage, purchasing a wireless or broadband
service would increase the amount of debt they collect by a substantial amount. More
precisely, for single parent female run households, by subscribing to a wireless service
their debt would increase by 69%, while subscribing to broadband service would increase
($1,376)
($4,414)
($5,468)
($3,634)
($8,930)
($9,984)
-‐$12,000
-‐$10,000
-‐$8,000
-‐$6,000
-‐$4,000
-‐$2,000
$0
No Informa*on
Services With Wireless Service With Broadband Service
Average Debt Increase Due to Informa*on Service
Type
Male single parent
household with children under 18 years
Female single parent
their debt by 75%. For single parent male run households, subscribing to a wireless
service would increase their debt by 59%, and subscribing to broadband service would
increase their debt by 64%.
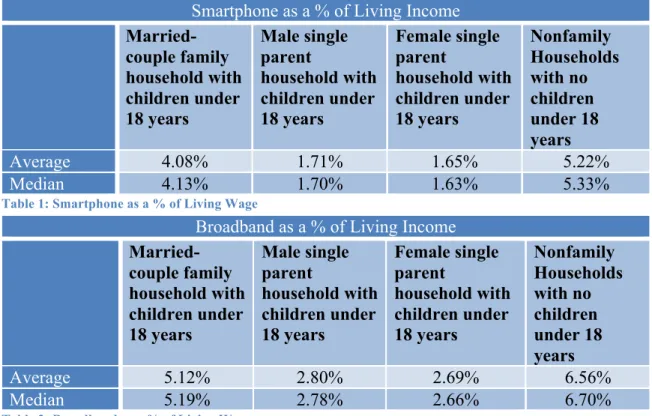
Table 1: Smartphone as a % of Living Wage
Table 2: Broadband as a % of Living Wage
These findings are in no way meant to suggest that in areas with low to moderate
poverty levels 100 percent of the population can afford information services. As these
services do not fluctuate a great amount in price throughout most markets in the United
States, households can expect to pay anywhere from approximately 1.5 to nearly 7.0
percent of their estimated living wage, depending on their household makeup and type of
information service desired.
As seen in Table 1 (Smartphone as a % of Living Wage) and Table 2 (Broadband
as a % of Living Wage), single-parent households will typically spend between 1.5 to 3.0
Smartphone as a % of Living Income Married-couple family household with children under 18 years Male single parent household with children under 18 years Female single parent household with children under 18 years Nonfamily Households with no children under 18 years
Average 4.08% 1.71% 1.65% 5.22%
Median 4.13% 1.70% 1.63% 5.33%
Broadband as a % of Living Income Married-couple family household with children under 18 years Male single parent household with children under 18 years Female single parent household with children under 18 years Nonfamily Households with no children under 18 years
Average 5.12% 2.80% 2.69% 6.56%
percent of their annual living income on information services. Looking at the same tables,
married-couple family households and nonfamily households will spend more on these
same services, ranging from 4.0 to 7.0 percent of their annual living income. These
services account for less of a single-parent household’s annual living income because
regardless of the size of the family, there is typically one adult requiring access to a
smartphone or basic phone line residing in the household. Considering these numbers, if
a household did not have access to an information service, then they could use the Living
Wage Calculator and the affordability percentages outlined in Table 1 and Table 2 to
determine whether they could afford a specific service. In order to do this, an individual
would have to look up what their living wage should be for their specific household size
and makeup, determine what their actual household income is, divide their household
income by their specific living wage income, and if the outcome is over 1.07, then they
should be able to afford either of the services and specific plans outlined in this paper.16
Struggles of the Potential Broadband Subscriber
In April of 2009, Pew Internet conducted a survey of dial-up Internet subscribers, asking
them what it would take to make the move to broadband. Of all the responses, the answer
most frequently offered, with 35% of participants responding in the affirmative, was the
price of broadband would first have to fall (Horrigan, 2009). Almost five years later and
this grievance is still one of the most commonly shared.
16 The percentages listed in Table 1 and Table 2 are approximations, and focus on specific populations. If
Figure 1: Average Number of Service Providers per Service Type
With the recent move by the Comcast Corporation to acquire Time Warner Cable,
the Internet has come alive with people fearing the lack of competition between Internet
service providers already occurring may increase broadband costs even further should the
merger go through. Are these fears unfounded? According to data collected from the
National Broadband Map, of the 30 metropolitan areas in this study, the majority of
populations in these areas have access to three Wireline17 service providers, while the
average number of wireless providers is closer to six.
Perhaps these are some of the reasons smartphone use is on the rise at such a rapid
pace.
“Differences between racial and ethnic groups are an example of smartphones narrowing the “broadband gap”: While blacks and Latinos are less likely to have access to home broadband than whites, their use of smartphones nearly eliminates that difference” (Zickuhr, 2013).
17 The National Broadband Map uses Wireline as an all-inclusive term for broadband services
0% 10% 20% 30% 40% 50% 60%
1 2 3 4 5 6 7 8 9
Number of Providers
Average Number of Service Providers per
Service Type
Wireline
The Effects of Poverty on Affordability
One way in which information services might be more affordable to families in high
poverty areas is by gaining access to government subsidies; however, this is not a route
all can take. Take food assistance as an example. In order to qualify for the Supplemental
Nutrition Assistance Program (SNAP), a family of four cannot make more than $2,552 in
gross monthly income or $1,963 in net monthly income. For a family of three, in order to
qualify for SNAP the total household income cannot exceed $2,116 in gross monthly
income, or $1,628 in net monthly income (USDA, 2013). These figures may appear
reasonable at first glance, however, gross monthly income is the equivalent of 130
percent of the Federal Poverty Threshold, and net monthly income is the equivalent of
100 percent of the same threshold.
One particular region of interest for this study is the McAllen-Edinburg-Mission,
TX Metro Area. According to the 2012 5-Year American Community Survey, this region
of Texas is home to over 750,000 people, with 35 percent of the population falling under
100 percent of the federal poverty threshold18. Additionally, over 50 percent of the
population in this area falls below 150 percent of the federal poverty threshold.
Approximately 39 percent of people aged 25 years and older in the metro area have
completed less than four years of high school, while for the same demographic the U.S.
estimate is approximately 14 percent. However, what is of particular interest about this
area is how much of its population can afford access to information services. When
looking at the four major household types in this region, a living income is over
determined to be over 150 percent of the federal poverty threshold, which over 50 percent
18 The McAllen-Edinburg-Mission, TX Metro Area has the highest poverty rate of metro areas in the
of the population in the region lives below. While 35 percent of the population lives
below 100 percent of the federal poverty threshold, and thus qualifies for SNAP, this still
leaves over 15 percent, or about 125,000 people, without this type of food assistance and
living below a living wage. This leaves a rather large portion of the population unable to
afford any type of information service, yet this is not unheard of. Out of all the
metropolitan areas reviewed in this study, a living wage was never determined to fall
under 150 percent of the federal poverty threshold for any of the household types.
Existing Solutions
In May of 2011, Comcast launched a program called Internet Essentials, which aimed to
reduce the digital divide by offering specific families in low-income communities
discounted broadband service, low-cost computers, and free training programs developed
by Comcast to teach subscribers how to use the technology (Reardon, 2014). In order to
qualify, families must have at least one child receiving a free or reduced lunch, or have a
child attending school where at least 70 percent of the students qualify for a free or
reduced lunch. Additionally, families cannot have been a Comcast customer for the 90
days preceding their application for the program or be in negative standing with the
service provider. If families are approved, they receive access to 5 Mbps broadband
Internet for $9.95 per month. If a family does not have access to a computer at home then
they can purchase one from Comcast for a reduced cost of $150. Since its launch in 2011,
more than 300,000 families, or 1.2 million people, have benefited from the Internet
Essentials initiative. Additionally, Comcast has sold more than 23,000 subsidized
Another company who is hoping to connect more people to broadband services is
Google through their relatively new service Google Fiber (Google, 2014). Currently,
Google Fiber is operating in Kansas City, MO, Provo, UT, and Austin, TX. In these
markets, Google hopes to compete with other Internet service providers, by offering three
different packages, Gigabit + TV, standalone Gigabit Internet, or their “Free Internet.”
The last option, their free Internet option, is not entirely free, at least not at first. For
customers who cannot afford the $70 per month price tag that comes along with the
Gigabit Internet option, Google offers a package that connects potential customers to
basic Internet19 at a one time $300 price, or $25 per month for 12 months. Once
customers finish paying the one time or 12-installment plan price, they will receive free
Internet at the same speed for the next seven years. With their hopes of expanding into 34
new cities in 9 metro areas, Google has the potential to help many people in low-income
communities gain access that they might not have had otherwise.
Conclusion
Across the United States, many people have to go without access to information services
due to issues most frequently surrounding affordability. This study reviewed the current
costs associated with broadband and wireless adoption, and found that there is no
universal definition of information affordability. While the majority of people receiving
an income above a living wage do not struggle with being able to afford wireless or
broadband services, for many Americans this is not a reality. More research needs to
occur to understand how those without Internet access are suffering in our digital world.
However, not all hope is lost for individuals on the wrong side of the information gap.
With programs like Internet Essentials and Google Fiber, the possibility of closing the
Reference List
Boyera, S. (2007). Can the Mobile Web Bridge the Digital Divide? Interactions, 14 (3), 12-14.
Burke, M., Hartline-Grafton, H., & Weill, J. (2012). Food Hardship in America 2012: Data for the Nation, States, 100 MSAs, and Every Congressional District. Washington, DC: Food Research and Action Center.
Colander, D. (2012). Solving Society's Problems from the Bottom Up. Challenge, 55 (1), 69-85.
Cotten, S. R., & Jelenewicz, S. M. (2006). A Disappearing Digital Divide Among College Students? Peeling Away the Layers of the Digital Divide. Social Science Computer Review, 24 (4), 497-506.
DeNavas-Walt, C., Proctor, B. D., & Smith, J. C. (2013). Income, Poverty, and Helath Insurance Coverage in the United States: 2012. U.S. Census Bureau, Current Population Reports. Washington, DC: U.S. Government Printing Office.
Duggan, M. (2013, September 2013). Cell Phone Activities 2013. Retrieved March 21, 2014, from PewResearch Internet Project: http://www.pewinternet.org/2013/09/19/cell-phone-activities-2013/
Duggan, M., & Smith, A. (2013, September 16). Cell Internet Use 2013. Retrieved March 21, 2014, from PewResearch Internet Project:
http://www.pewinternet.org/2013/09/16/cell-internet-use-2013/
Facebook. (2013, August 20). Technology Leaders Launch Partnership to Make Internet Access Available to All: Facebook, Ericsson, MediaTek, Nokia, Opera, Qualcomm, Samsung to Be Founding Partners. New York, New York, United States of America.
Figueiredo, M., Prado, P., & Kramer, M. (2012, May/June). Overcoming Poverty through Digital Inclusion. IEEE Computer Society , 6-10.
FRAC. (2013). SNAP: Food Stamp Participation. Washington, DC: Food Research and Action Center.
Google. (2014). A Different Kind of Internet and TV. Retrieved February 21, 2014, from Google Fiber Inc.: https://fiber.google.com/about/
Kuilema, J. (2012). Social Workers and Broadband Advocacy: Social Justice and Information Communications Technologies. Social Science Computer Review, 31 (3), 291-305.
Lipsman, A., & Aquino, C. (2013). 2013 Mobile Future in Focus. Reston: ComScore Inc.
Lipsman, A., Aquino, C., & Flosi, S. (2013). 2013 U.S. Digital Future in Focus. Reston: ComScore, Inc.
McGrath, M. (2011). Zeroing the Divide Promoting Broadband Use and Media Savvy in Underserved Communities. National Civic Review, 100 (3), 24-28.
Mossberger, K., Tolbert, C. J., & Hamilton, A. (2012). Measuring Digital Citizenship: Mobile Access and Broadband. International Journal of Communication , 2492+.
NTIA. (2013). Household Broadband Adoption Climbs to 72.4 Percent. National Telecommunications and Information Administration, U.S. Department of Commerce. Washington, D.C.: NTIA.
Pearce, K. E., & Rice, R. E. (2013). Digital Divides from Access to Activities:
Comparing Mobile and Personal Computer Internet Users. Journal of Communication, 63, 721-744.
Reardon, M. (2014, March 4). Comcast Extends 'Internet Essentials' Program Indefinitely. (CBS Interactive Inc. ) Retrieved March 21, 2014, from CNET:
http://www.cnet.com/news/comcast-extends-internet-essentials-program-indefinitely/
Sanchez, P., & Salazar, M. (2012). Transnational Computer Use in Urban Latino
Immigrant Communities: Implications for Schooling. Urban Education, 47 (1), 90-116.
Sestini, F. (2012, December 19). Collective Awareness Platforms: Engines for Sustainability and Ethics. IEEE Technology and Society Magazine , 54-62.
Smith, A. (2012, June 26). 17% of Cell Phone Owners Do Most of Their Online
Browsing on Their Phone, Rather than a Computer or Other Device. Retrieved October 27, 2013, from Pew Internet & American Life Project:
http://www.pewinternet.org/2012/06/26/cell-internet-use-2012/
Smith, D. T., & Graham, R. (2012). Household Expenditures on Information and
Communication Technologies: A Proposal for a Digital Practice Model. Race, Gender & Class, 19 (3/4), 161-178.
USDA. (2013). Supplemental Nutrition Assistance Program (SNAP). United States Department of Agriculture, Food and Nutrition Service. Washington, DC: USDA.
Warf, B. (2013). Contemporary Digital Divides in the United States. Tijdschrift Voor Economische En Sociale Geografie, 104 (1), 1-17.
Yelton, A. (2012). Bridging the Digital Divide with Mobile Services. Chicago: ALA TechSource , 5-8.
Zickuhr, K., & Smith, A. (2013, August 26). Home Broadband 2013. Retrieved February 21, 2014, from PewResearch Internet Project:
Appendix 1
Appendix
2
Number of Information Service Providers per Poverty Group
0% 10% 20% 30% 40% 50% 60% 70% 80%
1 2 3 4 5 6 7 8 9
Number of Providers
Average Wireline Providers per Poverty Group
High Poverty
Median Poverty
Low Poverty
0% 5% 10% 15% 20% 25% 30% 35% 40% 45%
1 2 3 4 5 6 7 8 9
Number of Providers
Average Wireless Providers per Poverty Group
High Poverty
Median Poverty
Appendix 3
Information Service Plan Findings
Wireless Plan: 2 Year Cost for 1 Line
AT&T $960
T-‐Mobile $2,090
Sprint $1,680
Verizon Wireless $1,920
Wireless Plan: 2 Year Cost for 2 Lines
AT&T $1,944
T-‐Mobile $3,700
Sprint $3,120
Verizon Wireless $3,120
Broadband Plan: 2 Year Cost + 1 Basic Prepay Phone Plan
Time Warner Cable $2,571
Comcast Xfinity $2,660
AT&T $2,788
Verizon FiOS $2,847
Broadband Plan: 2 Year Cost + 2 Basic Prepay Phone Plans
Time Warner Cable $3,590
Comcast Xfinity $3,679
AT&T $3,806
Verizon FiOS $3,866