ISSN: 2278-3369 International Journal of Advances in Management and Economics
Available online at: www.managementjournal.info
RESEARCH ARTICLE
Inventory Management of Raw Material in Indian Jute Industry –
A Study: Part 1
Satya Narayan Bag
Development Manager, Bally Jute Company Ltd, Bally, Howrah, West Bengal.
Abstract
Statistically significant positive correlation exists between Raw Jute requirement at production process and the Raw Jute issued from the ware house. Quantities of purchased Jute are positively correlated with Jute Requirement at process, Jute issue from ware house and Raw Jute Stock at Warehouse. Only Jute issued is statistically Significant positive moderate correlated with quantity of purchased Jute. Multiple Regression model also proves such hypothesis. At any point of time future Jute purchased quantity for manufacturing process will depend on quantity of Jute issue from warehouse.
Keywords: Requirement, Issue, Stock, Purchase, production, Regression.
Introduction
Jute Industry occupies an important position in Indian economy. A large number of people are involved from Raw Jute Cultivation to jute products manufacturing process. Jute is biodegradable fiber. Due to bio-degradable nature, this fiber are now gradually increasing in use from conventional packaging material to fancy decorative fabrics, carpets, and finally in Technical textiles areas. The fiber grows in nature. Its golden yellow color gives a special appeal to the jute products. The production of Raw Jute varies year after year, due to variation of Rain falls in eastern India , Nepal, Bhutan ,Bangladesh. Regarding this proper utilization of fiber in manufacturing process are now important due to gradually increasing economic value of such fiber and its products. Inventory management system of Jute Industry must be efficient for controlling this seasonal crop purchasing programmed and day to day requirement, issue and stock position of various grades of JuteFiber. As per production planning, requirement of raw Jute at department, jute department issue, raw jute deliveries from warehouse to the production process are should be properly controlled to minimize the Jute waste. Due to seasonal production nature of jute crop, the jute department of each mill has to maintain stock for future requirement. Purchasing process of jute are now entirely dependent on three factors. Jute Issues, Jute requirement and Jute stock position at the warehouse.
Literature Review
Tom Jose V et al [1] explained in their study that every organization needs inventory for smooth running of its activities. It serves as a link between production and distribution processes. The investment in inventories constitutes the most significant part of current assets and working capital in most of the undertakings. Thus, it is very essential to have proper control and management of inventories. The purpose of inventory management is to ensure availability of materials in sufficient quantity as and when required and also to minimize investment in inventories.
Panigrahi A K[2] concluded in his research study that the importance of efficient working capital management (WCM) is indisputable. Moreover, the adequate and timely flow of inventory is imperative for the success and growth of any company. The paper is an attempt to study in depth the inventory management practices of Indian cement companies and its impact on working capital efficiency. The purpose of this paper is to examine the relationship between inventory conversion period and firms‟
The dependent variable, gross operating profit is used as a measure of profitability and the relation between inventory
management and profitability is
investigated for a sample of five top Indian cement companies over a period of ten years from 2001-2010. This study employs Regression analysis to determine the impact of inventory conversion period over gross operating profit taking current ratio, size of the firm, financial debt ratio as control variables. The results indicate that there is a significant negative linear relationship between inventory conversion period and profitability.
Shafi Mohammad [3] disclosed in his research findings that Inventory constitutes a major component of working capital. To a large extent, the success and failure of a business depends upon its inventory management performance. The basic objective of inventory management is to optimize the size of inventory in a firm so that smooth performance of production and sales function may be possible at minimum cost. The study was aimed how inventories in textile sector are managed across the globe.. As Textile industries have been playing an important role for the socio-economic development of any country. The paper was attempted to unravel the research findings on management of Inventories in textile industry across the world. Studying inventory management becomes all the more important in view of the fact that it is the largest employer with a total workforce of 35 million. Moreover, the share of textiles in total exports was 11.04 % during 2010.
Mahammad Ali [4] said in his research findings that the textile industry, an important segment in Bangladesh’s manufacturing industry, play a critical role in its economic development. The textile sector fulfills almost cent percent domestic demand apart from the fulfilling the external demand of clothing and apparels to a large extent in Bangladesh. The Textile industry is a long chain including raw
materials production, complement
production, clothing production and so on.
SCM concept is made possible as a
conventional management tool for all manufactures are to strive to improve their product quality, to reduce their product and service cost and to shorten their product delivery and response time in a highly competitive market. The effective SCM of textile industry include lower inventories, lower costs, higher productivity, greater productivity, greater agility shorter lead times, higher profits and greater customer loyalty.
Research Methodology
Study has been conducted at Bally Jute Company Ltd, Bally, Howrah, and West Bengal, India. Date had been collected of Raw Jute issues, requirement, Purchasing and Stock from jute Department of the unit for two years. This data are then analyzed and interpret with statistical calculator regarding relationship between purchasing quantities of Raw Jute and other three parameters, Raw Jute Issue, requirement and Stock position monthly basis. This analysis gives an idea regarding Raw Jute Inventory management system in Jute Industry.
Study Area
Bally Jute Company Ltd, bally, Howrah is a pioneer Jute Industry in India. This unit produces several 100 % biodegradable Jute product seg, A Twill, B Twill, Hessian Cloth, Sacking cloth, Carpet backing cloth, Jute Geotextile cloth, Tea bag and Hydrocarbon free Jute bag . It is a largest Jute industry in west Bengal. Daily production of this unit is 100MT of Jute goods. Around 3000 employees are directly related to this unit and several other 2000 are indirectly related to this industry.
Results and Discussion
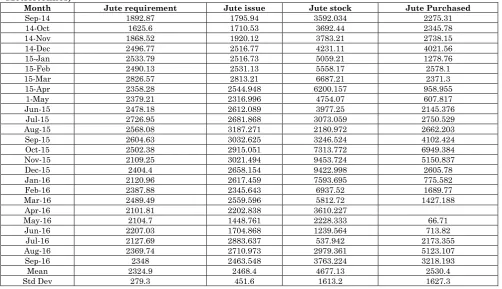
Table 1: Jute requirement. Purchased, Jute Stock and Issued at various Months (Figures in Metrictonnes)
Month Jute requirement Jute issue Jute stock Jute Purchased
Sep-14 1892.87 1795.94 3592.034 2275.31
14-Oct 1625.6 1710.53 3692.44 2345.78
14-Nov 1868.52 1920.12 3783.21 2738.15
14-Dec 2496.77 2516.77 4231.11 4021.56
15-Jan 2533.79 2516.73 5059.21 1278.76
15-Feb 2490.13 2531.13 5558.17 2578.1
15-Mar 2826.57 2813.21 6687.21 2371.3
15-Apr 2358.28 2544.948 6200.157 958.955
1-May 2379.21 2316.996 4754.07 607.817
Jun-15 2478.18 2612.089 3977.25 2145.376
Jul-15 2726.95 2681.868 3073.059 2750.529
Aug-15 2568.08 3187.271 2180.972 2662.203
Sep-15 2604.63 3032.625 3246.524 4102.424
Oct-15 2502.38 2915.051 7313.772 6949.384
Nov-15 2109.25 3021.494 9453.724 5150.837
Dec-15 2404.4 2658.154 9422.998 2605.78
Jan-16 2120.96 2617.459 7593.695 775.582
Feb-16 2387.88 2345.643 6937.52 1689.77
Mar-16 2489.49 2559.596 5812.72 1427.188
Apr-16 2101.81 2202.838 3610.227
May-16 2104.7 1448.761 2228.333 66.71
Jun-16 2207.03 1704.868 1239.564 713.82
Jul-16 2127.69 2883.637 537.942 2173.355
Aug-16 2369.74 2710.973 2979.361 5123.107
Sep-16 2348 2463.548 3763.224 3218.193
Mean 2324.9 2468.4 4677.13 2530.4
Std Dev 279.3 451.6 1613.2 1627.3
Avg value of jute stock is 4677.13 MT, which is very high compare to Jute purchased. The standard deviation of jute stock is very high 1613.2 MT, indicates that stock position of Raw Jute varies month to month round the year. Standard deviation of jute requirement and issue are comparatively less compare to purchase and stock. Mean value of Jute issue is slightly higher that requirement value.
We consider that Raw Jute Purchased in quantity/month is a function of Issue, Requirement and Stock position at warehouse.
Ie, Raw Jute purchased in quantity = ſ (Raw jute stock, Raw jute requirement, Raw jute issue)
So the multiple regression equation models is
JP = a + b JS + c JR + d JIor Y = a +b(X1 ),+c ( X2 ) + d ( X3)
{JP=Jute Purchased/month, JS = Jute Stock/month,JR =Juterequirement,JI=Jute issue }
a, b, c and d are regression parameters
Correlation between Variables
From the table 02 it is cleared that Jute Purchased is positively correlated corelated with Jute issue, jute stock position at ware house and Jute requirement. Here the Pearson correlation coefficient (r) is positive. Jute issue and jute requirement are strongly positively correlated and the value of r is 0.6475. On the other hand Jute purchased is strongly positively related with Jute issue. The Pearson correlation coefficient is 0.5259.
Table 02: Pearson correlation: coefficient (R)
Jute Requirement Jute issue Jute stock Jute
purchased
Jute Requirement 1
Jute issue R=0.6475
R2 =0.4196
p= 0.000463
Comments =Moderate
positive relationship. The result is significant at p<0.05
Jute stock R=0.159 R2 =0.0253
p= 0.447764 Comments=Weak positive relationship.
The result is not
significant at P<0.05
R=0.3189
R2 =0.1023
p= 0.11963 Comments=
Positive correlation
exist. The relationship is weak. The result is not significant at p< 0.05
1
Jute purchased
R=0.2038 R2 =0.0415
p= 0.328501
Comments= Positive
correlation exist but it is weak.. The result is not significant at
p < 0.05
R=0.5259 R2 =0.276
p= 0.00693 Comments=
Moderate positive
correlation exists. The result is significant at p < 0.05.
R=0.2295 R2 =0.052
p=0.26978
Comments=positive
correlation ship exist. It is weak. The result is not significant at
p< 0.05
1
From the table 02, it is concluded that Jute purchased is statistically significant co related with Jute issue, ie, Monthly purchased quantity is dependent with monthly jute issue quantity.
Multiple Regression Analysis
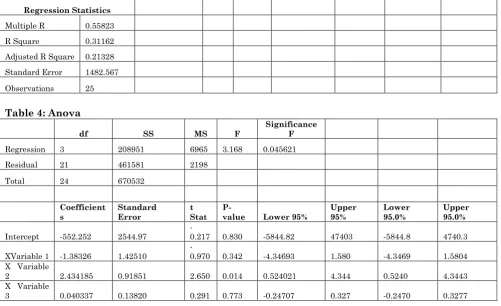
Table 03 and Table 04 explained the multiple regression results. Purchasing Jute (Y) here is dependent variable and there are three independent variables. They are Jute Requirement(X1), Jute Issue (X2) and Jute Stock (X3) . The objective of the study is to
identify a multiple regression equation and the extent of dependency of dependent variables in independent variables. Table 03 explained the goodness of Fit measures It tells how well the regression equation fits our data. Multiple R indicates correlation coefficients. Here the value of R=0.55823 indicates there are positive relationship between dependent and independent variables. -The value of R square is 0.311 indicates that 31 % of the variable of y values around the mean are explained by the X values ie, 31.1% of the values fit the model.
Table 3: Summary output
Regression Statistics
Multiple R 0.55823
R Square 0.31162
Adjusted R Square 0.21328
Standard Error 1482.567
Observations 25
Table 4: Anova
df SS MS F
Significance F
Regression 3 208951 6965 3.168 0.045621
Residual 21 461581 2198
Total 24 670532
Coefficient s
Standard Error
t Stat
P-value Lower 95%
Upper 95%
Lower 95.0%
Upper 95.0%
Intercept -552.252 2544.97 -0.217 0.830 -5844.82 47403 -5844.8 4740.3
XVariable 1 -1.38326 1.42510
-0.970 0.342 -4.34693 1.580 -4.3469 1.5804
X Variable
2 2.434185 0.91851 2.650 0.014 0.524021 4.344 0.5240 4.3443
X Variable
Now from the table 04, it is observed that, only the p value of X 2 variable has lower than 0.05. p values of other two ie, X1 and X3 variables are higher than 0.05. So we can exclude these two variables to set up regression equation.
The expected regression equation then becomes stated as
Y = a +c X2 ie Quantity of Purchased Jute will be = -552.252 + 2.434185 (Quantity of Jute Issue) . From the equation we can calculate the quantity of purchased Jute in future.
Table 5: Summary output
Regression Statistics
Multiple R 0.525878
R Square 0.276547
Adjusted R Square 0.245093
Standard Error 1452.283
Observations 25
Table 6: ANOVA
df SS MS F Significance F
Regression 1 1854339 18543 8.791 0.006935
Residual 23 4850989
2109 1
Total 24 6705329
Coefficient s
Standard Error
t Stat
P-value Lower 95%
Upper 95%
Lower 95.0%
Upper 95.0%
Intercept -2374.69 1645.958
-1.442 0.162 -5779.61 1030.2 -5779.61 1030.23
X Variable
2 1.946085 0.656324 2.965 0.006 0.588375 3.3037 0.58837 3.30379
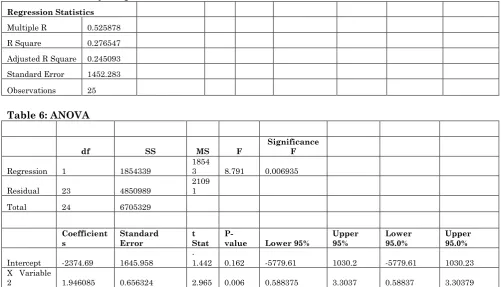
After excluding the variables X1and X3 , further regression analysis are performed. Table 05 explained that regression equation is moderately strong. The value of R is 0.525878 indicates that the Y and X 2 are positively correlated and linear relationships are exist. Value of R square indicates that 27.65 % of data points fall on the regression line.27.65 % of variation of Y values around the mean are explained by X 2 valuesie, 27.65 % of the values fit the model. From the table it is found that p value of X 2is less than 0.05. So the final regression equation will be
Y = -2374.69 + 1.946085 X2
Conclusion
In this study, a better inventory management of Raw Jute are explained which will surely be helpful in solving the
problems in jute industry. A large amount of money is investing for inventory for Raw Jute at ware house of the company. Jute is Natural fiber. It should be utilized in time with planned manner. Higher timings of Raw Jute in warehouse can damage the fiber, since it is biodegradable in nature. On the other hand, sufficient stock of Raw Jute at warehouse are essential for proper mixing of different grade of Jute fiber to get customer desired product in time. So, an optimum quantity of Raw Jute has to be maintained at warehouse of the company.
decision of different grade of Jute for future requirement.
Efficient inventory Management of Raw Jute forproduction process will be achieved which gives cost effective production process and less wastage of golden Jute Fiber [5-11].
Acknowledgement
We are extremely thankful to the senior staffs, officers and supervisors for their kind cooperation and help for this research work. Without their work this work cannot be completed in time.
References
1 Tom Jose V, Akhilesh JK , Sijo MT (2013),Analysis of Inventory Control Techniques; A comparative study, International Journal of Scientific and Research Publications, 3:(3).
2 Panigrahi AK (2013) Relationship between inventory management profitability, An empirical analysis of Indian cement companies, Asia pacific Journal of marketing & Management review,2:(7).
3 Shafi Mohammad (2014) Management of inventories in textile industry: A cross country Research Review ‘, Singaporean Journal of Business Economies and Management Studies, 2:(7).
4 Ali Mohammad, Md Habib Mamun , ( September 2012 ) Supply chain management of textile industry : A case study on Bangladesh, International Journal supply chain Management, 1:(2).
5 Md Arafat H, Hossain K, Das SK, Paul J (2013) Improved inventory management system for a Jute Mill- A case study ,’IOSR Journal of mechanical Civil Engineering’, 9:(5), www.iosrjournals.org
6 Hoque AK, Solayman M, Biswas SK , Wazad M A (2015) Relationship between inventory management Industries becoming sick , Especially in Third World Countries,’ Journal of Mechanical Engineering , ME 45(1).
7 Ravichandran N (2014) A Study on inventory Management with reference to leading Autonobile industry, BEST international Journal of Management, Information Technology Engineering, 2(5):15-28.
8 Vaisakh PS, Dileeplal JV Narayan Unni (2013) Inventory Management of Spare Parts by combined FSN VED (CFSNVED) Analysis, International Journal of Engineering and Innovation technology, 2, (7) .
9 Angel Raphella S, Gomathi Nathan S, Chitra G (2013) Inventory Management-A case study, international Journal of Engineering Research in Management & Technology, 3(3).
10 Sharif K (2012) An optimum inventory Control Planning for an Indian Industry- An Analysis. ‘Proceedings of the 2012 International Conference on Industrial Engineering Operations Management, Istanbul, Turkey, www.ieomsociety.org/ieom2012.