INHIBITION OF CORROSION OF ALUMINIUM IN ALKALINE
MEDIUM BY POLY(VINYL ALCOHOL) (PVA)
R. Kalaivani
[a]*, P. Thillai Arasu
[b]and S. Rajendran
[c]Keywords: polyvinylalcohol; aluminium; weight-loss method; synergistic effect; protective film
The inhibition efficiency of polyvinylalcohol (PVA) in controlling corrosion of aluminium in well water in the absence and presence of Zn2+ has beenevaluated by weight loss method. The formulation consisting of 250 ppm of PVA and 25 ppm of Zn2+ offers 85 % inhibition efficiency. It is found that the inhibition efficiency of PVA increases by addition of Zn2+ ion. A synergistic effect exists between PVA and Zn2+. The mechanistic aspects of corrosion inhibition have been studied using polarization study. Also FTIR spectra reveal that the protective film consists of PVA - Zn2+ complex and Zn(OH)
2. The scanning electron microscopy confirms the protection of aluminium surface by strong adsorption of PVA. A suitable mechanism for corrosion inhibition is proposed based on the results from the above studies.
* Corresponding Authors
*E-Mail: [email protected]
[a] Department of Chemistry, Research Scholar, Manonmanium SundaranarUniversity,Thirunelveli 627132,Tamilnadu, India. [b] Deparment of Chemistry,Kalasalingam,
University,Srivilliputhur 626126, Tamilnadu, India. [c] RVS School of Engineering & Technology, Dindigul - 624
005,Tamilnadu, India.
Introduction
Water is the most commonly used cooling fluid to remove unwanted heat from heat transfer surfaces. In recent years, the need to conserve water in order to meet the demand of industry. Presently, due to environmental Concerns, non-polluting inhibitors are used. Among various inhibitors polyvinyl alcohol is chosen as corrosion inhibitors because polyvinyl alcohol has excellent film forming,1-3emulsifying, and adhesive properties. It is also resistant to oil, grease and solvent. It is odorless and non toxic. It have functional groups such as –OH linkage, this group interact with metal surface through active centers of polymer.4-6 It acts as protective film and prevents corrosion. The study of corrosion inhibition of aluminium in H2SO4 in presence of polyvinylalcohol (PVA) and polyethylene glycol(PEG) as inhibitors at 30-60 °C by using gravimetric, gasometric and thermometric techniques,7 found that corrosion inhibition efficiency increases with increase in concentration of PVA and PEG. Rajendran et al8 investigated the corrosion behaviour of carbon steel using polyvinyl alcohol(PVA) in neutral aqueous solution containing 60 ppm of Cl- in the absence and presence of ions using weight loss method. It offered 81% inhibition efficiency, the corrosion and inhibition behaviour of aluminium9 in HCl in the presence of polyvinyl pyrrolidone (PVP) and polyacrylamide (PAL) their blends in the temperature range of using weight loss and hydrogen evolution techniques has been reported that polyvinylalcohol, used in eye drops and hard contact lens solution as a lubricant, PVA fiber, as reinforcement in concrete, as a surfactant for the formation of polymer encapsulated nanobeads. Much work has not been done on aluminium metal by polyvinyl alcohol.
Molecular structure of polyvinylalcohol is shown in scheme 1. Space filling model of is shown in scheme 2.
Scheme 1. Polyvinylalcohol (ethene-1-ol)
Scheme 2. Space filling model of polyvinyl alcohol
The present work deals
i)
To evaluate the inhibition efficiency of polyvinylalcohol(PVA) in controlling corrosion of aluminium at pH 11 in the absence and presence of Zn2+ii) To study the synergistic effect exist between PVA - Zn2+ system.
iii) To analyse the protective film by FT-IR spectra and SEM techniques.
iv) To study the AC impedance spectra to know the mechanistic aspects of corrosion inhibition.
v) To propose a suitable mechanism of corrosion inhibition based on the results from the above studies.
Materials and methods
Preparation of the specimens
Weight – loss method
Aluminium specimens were immersed in various concentrations of the inhibitor solution in the presence and absence of Zn2+ for a period of 24 h.The weight of the specimens before and after were determined using Shimadzu balance, model AY62. The corrosion products were cleansed with Clarke’s solution. The inhibition efficiency (%) was then calculated using the equation
(1)
where
W1 = corrosion rate in the absence of the inhibitor and
W2 = corrosion rate in the presence of the inhibitor.
AC impedance measurements
The AC impedance spectra were recorded in the same instrument which was used for polarization study. The cell set up was the same as that used for polarization measurements. The real part (Z’) and imaginary part (Z’’) of the cell impedance were measured in ohms at various frequencies. The values of charge transfer resistance Rt, and the double layer capacitance Cdl were calculated.
Rt = (Rs+ Rt ) − Rs (2)
where
Rs = solution resistance
Cdl = 1 / 2л Rt fmax (3)
where
fmax = maximum frequency
Surface examination study
The aluminium specimens were immersed in various test solutions for a period of 24 hours and then taken out and dried. The nature of the film formed on the surface of the metal specimens was analysed for surface analysis technique by FTIR spectra and fluorescence spectra.
FT-IR Spectra
The film formed on the metal surface was carefully removed and mixed thoroughly with KBr. The FTIR spectra were recorded in a Jasco 460+ spectrophotometer.
RESULTS AND DISCUSSION
Analysis of the results of weight loss method
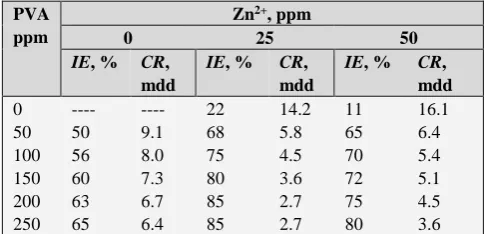
The IE values of PVA at different concentrations in the absence and presence of Zn2+ in well water for a period of one day obtained from the weight loss method are given in Table 1.
The inhibition efficiency of PVA increases as its concentration increases. From the table it is clear that Zn2+ in the absence of inhibitor also has some IE. As the concentration of Zn2+ increases, inhibition efficiency also increases. A synergistic effect exist between PVA and Zn2+. It is observed from the Table 1, 250 ppm of PVA only has 50 % IE and 25 ppm of Zn2+ alonehas 22 % IE. However, their combination consisting of 250 ppm of PVA and 25 ppm of Zn2+ has 85% inhibition efficiency. The observed improvement in the protection efficiency is attributed to the synergistic effect,10-13which results from the combination of two inhibitors PVA and Zn2+ which results in the formation of complex between Zn2+-PVA, hence the inhibitor molecules are readily transported from the bulk to the metal surface. A thin film was observed on the surface of the inhibited metal during the weight-loss measurements.
The corrosion rates of aluminium with various concentrations of PVA and Zn2+ systems immersed in well water for the same period are given in Table 1. From the Table 1, it is clear that in the presence of Zn2+ corrosion rate (CR) decreases as the concentration of PVA increases. This behaviour is due to the increase in the adsorption amount of the inhibitor on aluminium metal surface.14-15
Table 1. IE and CR of aluminium in solution containing various concentration of PVA in presence and absence of Zn2+ at pH11
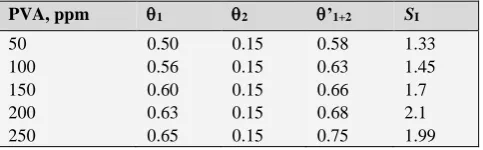
Synergism parameter (SI)
The synergism parameter (SI) is calculated using the relation
where
1+2 = (1 + 2)- ((1 . 2)
1 = surface coverage of inhibitor (PVA)
PVA ppm
Zn2+, ppm
0 25 50
IE, % CR,
mdd
IE, % CR,
mdd
IE, % CR,
mdd 0
50 100 150 200 250
---- 50 56 60 63 65
---- 9.1 8.0 7.3 6.7 6.4
22 68 75 80 85 85
14.2 5.8 4.5 3.6 2.7 2.7
11 65 70 72 75 80
16.1 6.4 5.4 5.1 4.5 3.6
2
1
100 1 W
E
W
1 2
I
1 2
1
1 '
S
2 = surface coverage of co-inhibitor (Zn2+)
’1+2 =combined surface coverage of inhibitors (PVA) and (Zn2+)
Surface coverage = IE/100
SI approaches 1 when no interaction between the inhibitors.
SI 1, synergistic effect exist between the two inhibitors. In the case of . SI 1, negative interaction takes place between system are shown in Figs. 1-3. It is clear from the plots that the impedance response of aluminium was significantly changed after addition of the two inhibitors, (i.e CR
increases). The calculated synergism parameter values for PVA and Zn2+ system are given in Table 2a and in 2b respectively. In the case of PVA - Zn2+ system , the SI value is found to be greater than one for 25 ppm of Zn2+ with various concentrations of PVA, indicating the synergistic effect exist between Zn2+ of concentrations of 25 ppm with various concentrations of PVA. SI value is found to be less than unity for 50 ppm Zn2+ with various concentrations of PVA which indicates a lack of synergism between 50 ppm of Zn2+ with various concentrations of PVA.16-18
Table 2a. Synergism parameters for PVA - Zn2+ (25 ppm) system when aluminium immersed in well water
Table 2b. Synergism parameters for PVA-Zn2+ (50 ppm) system when aluminium immersed in well water
Analysis of the results of AC impedance spectra
AC impedance spectra have been used to detect the formation of film on the metal surface. Nyquist plot and Bode plot representations of aluminium in well water in the absence and presence of the inhibitors. The impedance diagrams obtained almost have a semicircular appearance. This indicates that the corrosion of aluminium in alkaline solution is mainly controlled by a charge transfer process. The impedance parameters namely charge transfer resistance (Rt ) and double layer capacitance (Cdl) are given in Table 4.
When aluminium is immersed in solution containing 250 ppm of PVA and 25 ppm of Zn2+ at pH11 in the presence and absence of inhibitors are shown in Fig 1.
Figure 1. Graph of synergism effect exist in PVA- Zn2+ system in the corrosion of aluminium immersed in well water (Immersion period-one day)
It is found that when aluminium in well water at pH11, the Rt value is 396.4 cm2 and Cdl value is 1.2865x10⁻⁸ µF cm-2.When 250 ppm of PVA and 25 ppm Zn2+ are added the Rt value tremendously increased to 2086 ohm cm2 and the Cdl value is decreased to 2.44 x10⁻⁹ µF cm-2.19-24 This indicates the protective film is formed on the metal surface in the presence PVA .The bode plots are shown in Fig 4. It is observed that in the absence of the inhibitors the real impedance value [(log(Z ohm-1)] is 2.69. In the presence of
inhibitors this value increases to 3.38.
Table 3. The impedance parameters of aluminium immersed in well water at pH 11 in presence and absence of inhibitor obtained by AC impedance method
Analysis of the FT-IR spectra
FTIR spectra have been used to analyze the protective film formed on metal surface. FTIR spectrum (KBr) of pure PVA is given in Fig.4a. The aliphatic C-H stretching frequency peaks appears at 2928.5 cm-1. The secondary alcoholic C-O stretching absorption peak takes place at 1062 cm-1. The bands at 1383 cm-1 and 765.88 cm-1 are due to bending C-H of methyl groups. The FT-IR spectrum of the film formed on the aluminium surface after immersion in the well water for one day containing 250 ppm of PVA and 25 ppm of Zn2+ is shown in Fig 4b. The OH stretching frequency decreased from 3459 cm-1 to 3417 cm-1. The C-O stretching frequency decreased from 1062 cm-1to 1116 cm-1. Thissuggest that the oxygen atom of PVA was coordinated with Al3+ on the anodic sites of the aluminium metal surface, resulting in the formation of Al3+ - PVA complex. The peak at 620 cm-1 which may be due to Zn-O bending mode of vibration. The band at 3459 cm-1 is due to OH stretching frequency of Zn(OH)2 the formed at cathodic sites metal surface.25
PVA, ppm 1 2 ’1+2 SI
50 100 150 200 250
0.50 0.56 0.60 0.63 0.65
0.37 0.37 0.37 0.37 0.37
0.66 0.72 0.75 0.77 0.78
0.96 0.93 0.90 0.92 1.1
PVA, ppm 1 2 ’1+2 SI
50 100 150 200 250
0.50 0.56 0.60 0.63 0.65
0.15 0.15 0.15 0.15 0.15
0.58 0.63 0.66 0.68 0.75
1.33 1.45 1.7 2.1 1.99
System Rt
Ohm cm2 Cdl
F cm-2
Impedance (log Z ohm-1)
Well water Test solution PMMA=250 ppm+Zn2+=25ppm
396.4 2086
1.2865x10⁻⁸ 2.44x10⁻⁹
2.69 3.38
75 150 225
1.2 1.6 2.0
SI
Concn(ppm)
Zn2+25ppm
Figure 2. AC impedance spectra of aluminium immersed in various test solutions a) well water b) well water containing 250 ppm of PVA and 25 ppm of Zn2+
Figure 3a. Bode plots of aluminium immersed in well water
Figure 3b. Aluminium immersed in well water + 250 ppm of PVA and 25 ppm of Zn2+
Analysis of surface metal by SEM
SEM technique provides a pictorial representation of the surface.To understand the nature of the surface film in the presence and absence of inhibitors and the extent of corrosion products of aluminium, the SEM micrographs of the surface are examined.26-28
Figure 4. FTIR Spectra a) pure PVA b) film formed on metal surface after immersion in well water containing 250 ppm of PVA and 25 ppm of Zn2+
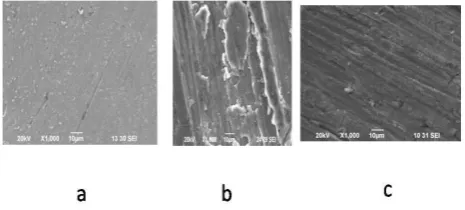
The SEM images of different magnifications ( X1000) of aluminium specimen and aluminium immersed in well water for one day in the presence and absence of inhibitors system are shown in Figure 5 as images (a, b and c) respectively.
The SEM micrographs of the surface of the polished aluminium metal (control) in Fig 5 images (a) illustrate the very smooth surface of the metal. These show the absence of any corrosion products formed on the metal surface.
The images (b) denote the SEM micrographs of aluminium surface immersed in well water. They show the type of rough surface of the uniform corrosion of the aluminium surface in well water, indicating in an inhibitor free solution, the surface is highly corroded.
Images (c) confirm that in the presence of 250 ppm of PVA and 25 ppm of Zn2+ at pH 11in well water, the rate of corrosion is suppressed , as it seen from the decrease in corroded areas. This is a result of the formation of insoluble complex on metal surface (PVA - Al3+) and the surface is covered by a thin layer of inhibitors which effectively controls the dissolution of aluminium metal from corrosion process. The above results are line with the interpretation made by.29,30
Figure 5. SEM micrographs of (magnification the surface of the polished aluminium (x1000) of a) polished aluminium metal b) aluminium immersed in well water c) aluminium immersed in well water + 250 ppm of PVA and 25 ppm of Zn2+
Mechanism of corrosion inhibition
that a protective film formed on the metal surface also it confirmed by FTIR spectra. SEM showed the surface morphology of metal surface.
The mechanism of corrosion inhibition was proposed by the following ways:
When the formulation consisting of 250 ppm of PVA and 25 ppm of Zn2+ at pH11 was prepared, there is formation of PVA - Zn2+complex in solution.
When aluminium is immersed in the solution, the PVA - Zn2+ complex diffuses from the bulk of the solution towards the metal surface.
On the surface of metal PVA - Zn2+ complex is converted to PVA - Al3+ complex and Zn2+ is released.
[PVA - Zn2+]+ Al3+ → [PVA - Al3+ ]+ Zn2+
Zn2+ + 2OH- → Zn(OH)2
Conclusion
The formulation consisting of 250 ppm of PVA and 25 ppm of Zn2+ offers 85 % inhibition efficiency to aluminium immersed in solution at pH11 by the weight-loss method. A synergistic effect exists between PVA and Zn2+. AC impedence study showed that a protective film formed on metal surface. FTIR spectra analysed the film formed on the metal surface.
References
1Lorenz, W. J., Mansfeld, F., Corros.Sci., 1981, 121, 647. 2Al-Kharafi, F. M., Badawy, W. A., Corros., 1998, 54, 377. 3Macdonald,, D. D., Real, S., Smedley, S. I., Urquidi-Macdonald,
J., J. Electrochem. Soc., 1988, 135, 1631.
4Mercier, D., Herinx, M., Barthes- Labrousse, M. G., Corros. Sci.,
2010, 52, 3405.
5Mu, G., Li, X., J. Colloid Interfac. Sci., 2005, 289, 184. 6Lebrini, M., Bull. Electrochem., 2003, 19, 209.
7Umoren, S. A., Ogbobe, O., Ebenso, E. E., Okafor, P. C., J. Appl
Polym. Sci., 2007, 105, 3363.
8Rajendran, S., Sridevi, S. P., Anthony, N., John Amalraj, A. and Sundaravadivelu, M., Anticorros. Methods Mater.,2012, 52, 102.
9Umeron, S. A., Ebenso, E. E., Ind. J.Chem. Techn, 2008, 15(4), 355.
10Manivannan, M., Rajendran, S., Res. J. Chem. Sci., 2011, 1(8), 42. 11Rajendran, S., John Amalraj, A., Jasmine Joice, M., Anthony, N.,
Trivedi, D. C. and Sundaravadivelu, M., Corros. Rev., 2004,
22(3), 2337.
12Rajendran, S., Apparao, B. V., Palaniswamy, J., J. Electrochem.
Soc., 1998, 47(1), 43.
13Rajendran, S., Maria Joany, B. R., Apparao, B. V. and Palaniswamy, N., Trans. SABST, 2000, 35(3-4), 113. 14Umoren, S. A., Surf. Rev. Lett., 2009, 6(6), 831.
15Tallman, D. E., Pae, Y-G., Chen, G.-L., Bierwagenz, G. P., Reems, B., Gelling, V. J., Cond. Polym. Plast., 1999, 201. 16Rajendran, S., Apparao, V. B., Palaniswany, N., Bull.
Electrochem., 2001, 17 (4), 171.
17Rajendran, S., Raji, A., Arockia Selvi, J., Rosaly, A. and Thangaswamy, S., J. Mater., 2007, 29, 245.
18Rajendran, S., Raji, A., Arockia Selvi, J., Rosaly, A. and Thangaswamy, S., Edutracks., 2007,6, 30.
19Benita Sherine, H., Jamal Abdul Nassar, A. and Rajendran, S.,
Indian J. Eng. Sci. Technol., 2010, 24, 341.
20Mary Anbarasi, C., Rajendran, S., J. Electrochem. Sci. Eng.,
2012, 2(1), 1.
21Ruba Helen Florence, G., Noreen Anthony, A., Wilson Sahayaraj, J. and Rajendran, S., Indian J. Chem. Technol., 2005, 12, 472.
22Rajendran, S., Apparao, B. V. and Palaniswamy, N., Electrochim.
Acta., 1998, 44, 533.
23Rajendran, S., Apparao, B. V. and Palaniswamy, N, Anticorros.
MethodsMater., 1999, 46, 111.
24Gomal, V., Sribharathy, V., Rajendran, S., J. Electrochem. Sci.
Eng., 2012, 2, 121.
25Li, W-H., Hu, L.-C., Zhang, S-T. and Hou, B-R., Corros. Sci.,
2011, 53 (2), 735.
26Manivannan, M. and Rajendran, S., Res. J. Chem. Sci., 2011,
1(8), 1.
27Manivannan, M. and Rajendran, S., J. Chem. Biol. Phys. Sci.,
2011, 1 (2), 241.
28Benita Sherine, H and Rajendran, S., Arab. J. Sci. Eng., 2011,
36 , 517.
29VasconcelosTorres, V., Salgado Amado, R., Faia de, C. and Lopez Ferandez, T., Corros. Sci., 2011, 53, 2385.
30Delimi, A., Galopin, E., Coffinier, Y., Pisareketal, M., Surf. Coat.
Technol., 2011, 205, 4011.