OPTIMIZATION OF EXTRACTION CONDITIONS FOR
LIQUID-LIQUID EXTRACTION OF PERSIPEPTIDES FROM
STREPTOMYCES ZAGROSENSIS FERMENTATION BROTH
Hamed Kazemi Shariat Panahi
[a], Fatemeh Mohammadipanah
[a]*and Mona
Dehhaghi
[a]Keywords: Anti-MRSA; drug discovery; enhanced-production; experimental design; HPLC; liquid-liquid extraction; pentapeptide. Generally, during drug discovery programs, after identification of new antibiotic metabolite, its high quantity production is obtained by various approaches, including production or extraction improvement or even strain genetic manipulation. To provide enough amounts of two novel non-toxic anti-MRSA pentapeptides named persipeptides (A and B) required for drug discovery programs, seven different fermentation broths examined. CM1 medium considerably enhanced the biosynthesis of persipeptides up to 219.63 ± 2.48, compared with ISP2 medium (36.31 ± 1.37), showing a six-fold increase. Additionally, at the extraction level, results of experimental design indicated that liquid-liquid extraction (LLE) of persipeptides by 34 % BuOH at 228 rpm (Stirrer speed), temperature 28 ˚C, and pH 9-9.5 for 78 min (stirring time) was equal to 264 ± 9.85 µg mL-1, which was the most favorable combination for their extraction. Compared with un-optimized extraction process
(219.63 ± 2.48 µg mL-1), the optimized conditions improved the yield of the extraction by 20.20 %, while saving both time and solvent usage
up to 67 % (162 min) and 16 %, respectively. The total sum of persipeptides enhancements resulted from the replacement of fermentation broth and subsequent optimization of their extraction by LLE reached almost seven-time, compared to conventional method (36.31 ± 1.37 µg mL-1). Therefore, relatively large amounts of persipeptides can be economically produced and extracted for various future experiments.
* Corresponding Authors Fax: +982166415081
E-Mail: [email protected]
[a] Department of Microbial Biotechnology, School of Biology and Center of Excellence in Phylogeny of Living Organisms, College of Science, University of Tehran, 14155-6455, Tehran, Iran
Introduction
The treatment of drug-resistant bacteria, including MRSA, in terms of their resistance to the current antibiotics is among major challenges worldwide.1 New cyclo-pentapeptides, named as persipeptides, consist of two types of amino acids repetition of valine and phenylalanin, two of which are
N-methylated. So far; two isomers, A and B, has been produced2 by Streptomyces zagrosensis UTMC 1154 with bioactivity against methicillin resistance Staphylococcus aureus
(MRSA) DSM 23622 (UTMC 1401).3 Existence of N -methylated residues in peptides usually led to higher interesting therapeutic profiles4 and consequently improved pharmacokinetic properties such as enzymatic stability,5 receptor selectivity,6 enhanced potency,7 membrane permeability,8 and bioavailability.9
The development and the validation of analytical methods play vital roles in discoveries, developments and manufactures of pharmaceuticals. High-performance liquid chromatography (HPLC) is extensively applied as a versatile analytical technology for quantitative analysis of target biomolecules and other compounds in biological matrixes as well as fermentation culture media of microorganisms producing them.10 HPLC-based methods has previously been developed and validated for persipeptides determination from fermentation broth of S. zagrosensis UTMC 1154. The reported assay method requires sample pretreatment using LLE with the aid of n-butanol (n-BuOH).3 This pretreatment
is required for separating and concentrating of the target analyte and removing interferences, or even increasing the life of HPLC column by the elimination of damaging compounds.11 However, the LLE method used for sample pretreatment or extraction of persipeptides has not been optimized yet; therefore, has some drawbacks, including lower efficiency and time consumption. These drawbacks directly affect the extraction yield and expenses, including materials usage and equipment depreciation. Improvement of a system performance or a process in order to maximize the exploitation from it is referred as optimization. Process optimization will obtain conditions that produce the best possible response when applied to a production/extraction procedure.12 Traditional optimization of analytical chemistry are accomplished by one-variable-at-a-time, in which at any given time, influence of only one factor has been examined while all other factors have been kept at a constant level.13 An alternative to this is response surface methodology (RSM), which decreases the number of experiments while increases the effectiveness for responses that are confounded by many factors and their interactions.13 Additionally, analysis of variance (ANOVA) provides the statistical results and diagnostic checking tests, which enable researchers to evaluate the adequacy of the models.14 Although, RSM has been successfully applied in the optimization of culture media to enhance the production of Streptomyces secondary metabolites, including streptolydigin,15 virginiamycin,16 daptomycin,17 clavulanic acid,18 streptomycin,19 and neomycin;20 RSM in the optimization of solvent extraction of antibiotics produced by Streptomyces has been rarely exploited and the only example is the optimization of extractive fermentation of clavulanic acid.21
optimization of parameters in the process of LLE, including volume percentage of extraction solvent, stirring rate, sample pH, extraction temperature, and process time for LLE of persipeptides from fermentation culture medium samples of
S. zagrosensis UTMC 11543 were done in two steps. In the first step, primary evaluation of mentioned factors using half-fraction of factorial design was performed and striking factors were screened. In the second step, selected factors were investigated by RSM using central composite rotatable design (CCRD) in order to maximize the extraction efficiency of persipeptides.
Experimentals
HPLC grade acetonitrile was purchased from Merck (Darmstadt, Germany). All other organic solvent used for LLE of persipeptides, including n-buthanol (n-BuOH), 1-propanol, 2-propanol, cyclohexane, dichlromethane, methanol, and chloroform were extra-pure grade and obtained from Merck (Darmstadt, Germany). HPLC grade water was produced by Barnstead/Thermolyne, USA (Model: d8992-33 Nanopure infinity).
Strain and culture conditions
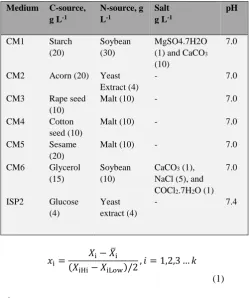
The commonly used ISP2 medium (consisted of (g L-1): glucose (4); yeast extract (4); and malt (10), pH 7.2) was used as growth and maintenance (supplemented with 2 g L-1) and seeding media. Persipeptides were produced by the inoculation of spore suspension (1 mL of 1 × 10⁷ CFU mL-1) of S. zagrosensis UTMC 1154 in 100-mL Erlenmeyer flasks containing 9 mL of ISP2 liquid medium, followed by 36 h of shaking (220 rpm) at 28 ºC to develop seeding culture. This pre-culture was used for the subsequent inoculation of various fermentation media (50 mL) in 250-mL Erlenmeyer flasks with inoculant size of 10 % (5 mL). The inoculated production media were incubated at 28 ºC on shaker incubator with 220 rpm for seven days.3 In order to examine persipeptides production, seven different media, named as candidate media (CM) 1-6 were investigated (Table 1). The optimization was done using the most productive medium.
Experimental designs and statistical analyses
In the previously reported method, the effect of critical parameters, including pH of the fermentation broth, extraction temperature, percentage of organic solvent, stirring rate, and extraction time on extraction process has not been determined.3 Therefore, an experimental design using half fraction of factorial design was employed to screen significant variables with the minimum required number of experiments. After the determination of variables with significant effect on extraction process, a three factors CCRD was employed to determine optimal conditions for critical factors. Design-Expert Version® 7.0.0 was used to fit the quadratic response surface model to the experimental information as well as to generate response surfaces, analysis of data, and contour plots diagrams, while keeping a variable constant in the second-order polynomial model. The statistical significance of an effect was evaluated by p-values <0.05.
The response was persipeptides peak area and actual values of independent variables (Xi) were coded to xi according to Eqn. (1).
Table 1. Compositions of seven different production media used for enhancing persipeptides production.
Medium C-source, g L-1
N-source, g L-1
Salt g L-1
pH
CM1 Starch
(20)
Soybean (30)
MgSO4.7H2O (1) and CaCO3
(10)
7.0
CM2 Acorn (20) Yeast Extract (4)
- 7.0
CM3 Rape seed (10)
Malt (10) - 7.0
CM4 Cotton
seed (10)
Malt (10) - 7.0
CM5 Sesame
(20)
Malt (10) - 7.0
CM6 Glycerol (15)
Soybean (10)
CaCO3 (1),
NaCl (5), and COCl2.7H2O (1)
7.0
ISP2 Glucose (4)
Yeast extract (4)
- 7.4
𝑥i =
𝑋i− 𝑋̅i
(𝑋iHi− 𝑋iLow)/2
, 𝑖 = 1,2,3 … 𝑘
(1)
where,
xi= coded value of independent variable;
XiHi/Low= real values of the independent variable;
Xi = real values of the independent variable at the center point of the domain; and
x1(coded value of percentage of organic solvent),
x2(coded value of stirring rate), and
x3 (coded value of extraction time) were given in Eqn. (2), (3) and (4).
𝑥1=
𝑋1− 50
25
(2)
𝑥2=
𝑋2− 225
75
(3)
𝑥3=
𝑋3− 49
29
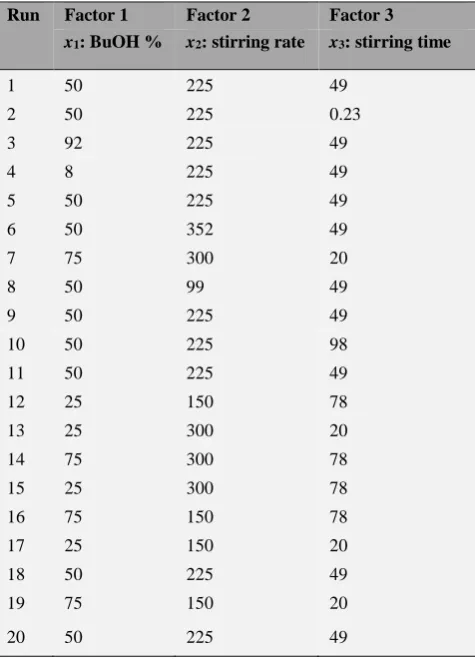
Response surface analysis of a five coded level CCRD for three factors, 20 runs (Table 2), was done using the generalized second-order polynomial model of Eqn. (5), and economically optimum conditions for LLE of persipeptides was determined by same equation.
𝑌 = 𝛽0+ ∑ βi𝑋i+ ∑ βii𝑋i2 𝑘
𝑖=1
+ ∑ βij𝑋iXj 𝑘
𝑖𝑗=1(𝑖≠𝑗) 𝑘
𝑖=1
(5)
where,
Y = the experimental response;
β0, βi, βii, and βij = the constant (intercept) coefficient, the linear coefficient, the quadratic coefficient, and the coefficient of interaction effect, respectively; and
Xi and Xj = independent variables
The quality of the fitted model was evaluated through analysis of variance (ANOVA). Additionally, the statistical analysis of the result, the evaluation of model and factors involved, and the determination of the influence of individual factors and their interaction with other factors on persipeptides extraction from the fermentation culture matrix by LLE were performed by determination of the coefficients from eqn. (5).
Table 2. Experimental sheet for five coded level CCRD of significant factors selected by screening design.
Run Factor 1 Factor 2 Factor 3
x1: BuOH % x2: stirring rate x3: stirring time
1 50 225 49
2 50 225 0.23
3 92 225 49
4 8 225 49
5 50 225 49
6 50 352 49
7 75 300 20
8 50 99 49
9 50 225 49
10 50 225 98
11 50 225 49
12 25 150 78
13 25 300 20
14 75 300 78
15 25 300 78
16 75 150 78
17 25 150 20
18 50 225 49
19 75 150 20
20 50 225 49
Sample preparation
The fermentation medium was harvested and divided for further experiments. Samples were prepared based on experimental conditions defined by experimental designs, then butanol containing fermentation broths were centrifuged at 2937 ×g for 10 min. One-hundred-fifty-µL of each supernatants was separated and the solvent was removed using N2 gas. The obtained precipitate was dissolved in 150 µL acetonitrile-water (1:1 v/v) and analyzed by HPLC method.
HPLC instrument and analysis
A Cecil instrument with in-line-degasser (CE 4040) consisted of manual Rheodyne (Rohnert Park, CA, USA) injector with 20 µL loop was employed. The sample was retained on an ACE (Aberdeen, UK) LiChrosob C18 column (250 × 4.6 mm ID, particle size 5 µm, ACE-121-2546) protected by Hichrom (Reading, UK) C18 column (NC100-5C18) and thermostated at 27 ˚C. The analytes were eluted by water (A) and acetonitrile (B) as mobile phase using a gradient elution, in which B was 50 % at start point, increased to 64 % in 5.5 min, then to 95 % within 1.5 min, followed by 5 min isocratic at 95 % (purge time), finally decreased to 50 % within 3 min and kept at this B % for as long as 10 min to equilibrate the column to prepare the system for next injection. Measurements were held at 210 nm and data was collected and processed by chromatography system manager and power stream software version 3.1, respectively. 3
Results and discussion
The core aim of current study was the enhancement of persipeptides retrieval. At the production step, the most effective medium basis for persipeptides biosynthesis was chosen amongst seven candidate media listed in Table 1. After cultivation, persipeptides were separately isolated from them using un-optimized LLE method previously provided.3 Results, in Table 3, indicate the CM1 medium as the most productive fermentation culture medium for persipeptides biosynthesis, which enhances its production by more than six times, reaching to 219.63 ± 2.48, compared with ISP2 medium (36.31 ± 1.37). All other examined novel carbon sources; including acorn, sesame, cotton seed, and rape seed failed to increase the persipeptides production, compared with ISP2 and the production was in range of 33 to 39 µg mL -1. The second most promising medium after CM1 was CM6, which composed of glycerol and soybean as carbon and nitrogen sources, respectively. CM6 considerably enhanced persipeptides production (159.69 ± 27.36), and four times increased in their production was resulted, compared to that of ISP2 medium (36.31 ± 1.37). Therefore, CM1 medium was selected as the final production medium and used for further optimization of LLE.
screening design, and subsequently, CCRD was applied for the evaluation of significant factors along with their interactions thereof.
Table 3. Production of persipeptides in different fermentation media tested.
Name 1st trial 2nd trial 3rd trial Average
CM1 220.36 216.86 221.66 219.63 ± 2.48 CM2 38.39 35.258 37.93 37.93 ± 1.69 CM3 33.65 33.57 33.97 33.73 ± 0.21 CM4 42.42 33.62 39.14 38.39 ± 4.45 CM5 36.84 37.14 37.31 37.10 ± 0.24 CM6 132.27 159.81 186.99 159.69 ± 27.36 ISP2 34.93 36.33 37.68 36.31 ± 1.37
Before starting optimization procedures, broad range of solvents, including ethyl acetate, 1-propanol, 2-propanol, cyclohexane, dichloromethane, methanol, n-BuOH, and chloroform were examined for obtaining maximum extraction (Data not shown). Among them, n-butanol was selected as the extracting solvent, as it has a high boiling point, which prevent solvent loss during extraction, and low melting point (less than -89 ˚C); is immiscible with aqueous solution and its density is lower than water; and is compatible with the RP-HPLC used in the quantification of persipeptides.
Screening design
Half fraction of factorial (resolution V) design is useful for preliminary purposes or in initial optimization steps owing to its great power in estimation of effects as well as considerable reduction in the number of experimental runs to be performed.
Applying this design allows the estimation of all the main effects and two-factor interactions (2 Fl) with the assumption that no three-factor or/and higher interactions occur/s. Therefore, half fraction factorial design was used for the screening step. Major factors, which are assumed to influence the LLE of persipeptides, include volume percentage of extraction solvent, stirring rate, sample pH, extraction temperature and process time. Levels of factors for the screening design were selected according to our knowledge, and are presented in Table 4. The overall design matrix, consisted of 20 runs of which four of them were center runs, was randomly performed in order to minimize unexplained variability effects in obtained responses due to systematic errors. Half-normal probability plot was used to choose significant effects, which were further analyzed by ANOVA and obtained results were evaluated to determine main effects (Table 5).
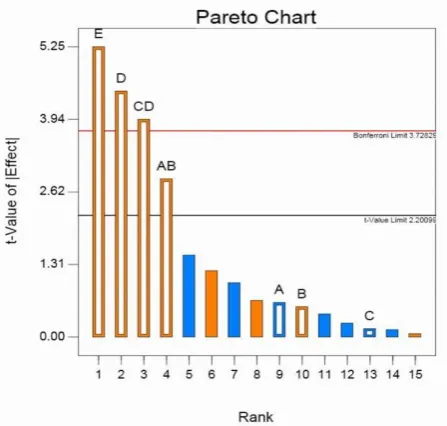
The standard effect was estimated for calculating a
t-statistic for each effect. Normalized results of the performed experimental design were investigated at a 5 % of significance and analyzed by standardized Pareto chart (Figure 1). On this plot (Figure 1), effects that are now above the second vertical line, Bonferroni limit, and those between second and first vertical lines, t-value limit, are almost certainly and possibly significant parameters, respectively.
Table 4. Levels of factors for the screening design.
Independent Factors CS Levels and Ranges -1 (L) 0 (M) +1 (H)
Broth pH A 7 9 11
Temperature (ºC) B 20 40 60
BuOH % (v/v) C 50 63 75
Stirring rate (rpm) D 100 200 300
Process time (min) E 20 70 120
CS, L, M, and H stand for Coded Symbol, Low, Middle, and High, respectively.
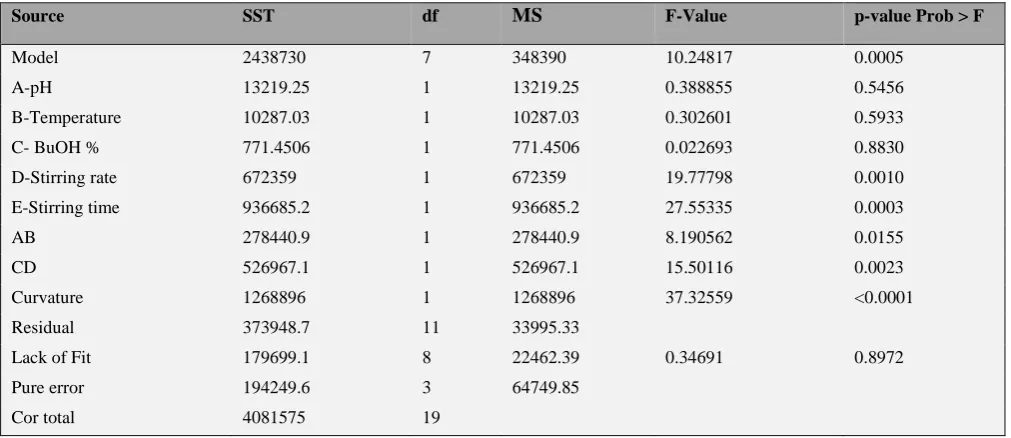
The model F-value of 10.25 implies the significance of the model. There is only a 0.05 % chance that the model F-value of this large could have been occurred due to noise. The measured curvature F-value of 37.33 as the difference between the average of the center points and that of the factorial points implies that the curvature in the design space is significant, and there is a 0.01 % probability that it could occur due to noise. Therefore, there was a need for higher resolution design (RSM) to optimize the significant factors. Furthermore, the lack of fit F-value of 0.35 implies that it is not significant relative to the pure error, and there is an 89.72 % chance that it could occur due to noise, therefore, the model can fit. The model had the predicted R-square of 0.74, which is in reasonable agreement with the adjusted R-square of 0.78. Moreover, model adequate precision measuring the signal to noise ratio had the value of 10.217 being considerably greater than 4, and therefore, the model can be used to navigate the designed space.
Table 5. Estimated ANOVA for half fraction of factorial design relationship between response variable (extraction yield) and independent variables (A, B, C, D, and E) in determination of significant factors to be optimized by RSM.
Source SST df MS F-Value p-value Prob > F
Model 2438730 7 348390 10.24817 0.0005
A-pH 13219.25 1 13219.25 0.388855 0.5456
B-Temperature 10287.03 1 10287.03 0.302601 0.5933
C- BuOH % 771.4506 1 771.4506 0.022693 0.8830
D-Stirring rate 672359 1 672359 19.77798 0.0010
E-Stirring time 936685.2 1 936685.2 27.55335 0.0003
AB 278440.9 1 278440.9 8.190562 0.0155
CD 526967.1 1 526967.1 15.50116 0.0023
Curvature 1268896 1 1268896 37.32559 <0.0001
Residual 373948.7 11 33995.33
Lack of Fit 179699.1 8 22462.39 0.34691 0.8972
Pure error 194249.6 3 64749.85
Cor total 4081575 19
SST, MS, and df stand for Sum of Squires, Mean Squire, and Degree of Freedom, respectively.
According to Figure 1 and Table 5, duration of stirring time was the most significant factor with a negative effect on the extraction efficiency of persipeptides. The second most important negative-effect variable was the rate of stirring. Interestingly, 2 FI between percentage of BuOH and stirring rate was significant with a negative effect on the extraction process. In contrast, both pH and temperature were non-significant factors with positive and negative effect, respectively. In low temperatures, extraction is slow process with lower yield, whereas at higher temperature, solvent is more soluble in aqueous phase, and therefore its separation from aqueous solution is more complicated. Additionally, persipeptides degradation is apparent at high temperatures;3 therefore, temperature for their extraction was set at 28 ˚C. Moreover, the pH of the extraction process was kept the same as the pH of fermentation broth of S. zagrosensis (9 and 9.5).
Optimization of significant factors
In the next step, a CCRD design was applied to optimize the values of three factors (percentage of BuOH, stirring rate, and extraction time), selected from the prior screening design. The process variable of LLE of persipeptides examined using CCRD presented inTable 6. The number of experiments is determined by the expression: (2n + 2n + C), where n
represents the number of factors (6) and C denoted the number of center points (3). The design of CCRD consisted of a factorial design (2n) augmented with (2n) run per axial
points, which is the number of times each axial run will be performed and located at +1.682α and -1.682α from the center of the experiment domain to satisfy the rotatability condition of the CCRD, and central points (C). Center runs with six repetitions were employed to estimate pure error for the lack of fit test as well as provides rather uniform precision designs. This means that the error inside a sphere that has a radius equal to +/-1 level is nearly uniform. Thus, predictions in this region are equally good.
Table 6. The significant variables and the level of the central composite response design used in the optimization of the persipeptides extraction.
Factor Level Star points*
-1 (L) 0 (C) +1 (H) -α +α
x1: BuOH % 25 50 75 8 92
x2: Stirring rate 150 225 300 99 351
x3: Stirring time 20 49 78 0.3 98
*The value is (α = 1.682). L, C, and H stand for Low, Central, and
High, respectively.
The data obtained were analyzed by ANOVA (Table 7)and then backward elimination regression, with alpha to exit equal to 0.100, was employed to improve the ANOVA results, in which the quadratic response was reduced by the elimination of x1x2 (2FI) and x32 (Table 8).
Fitting the model
A regression evaluation (Table 8) was performed for fitting mathematical models to the experimental data aiming at an optimal area, and a quadratic model was suggested according to the results. The predicted model of the regression equation for the peak area of persipeptides was expressed as eqn. (6) in terms of coded factors.
𝑌1= 1604.08 − 18.95𝑥1+ 231.51𝑥2+ 267.34𝑥3−
225.41𝑥1𝑥3 −220.52𝑥2𝑥3− 183.06𝑥12− 138.61𝑥22 (6)
Table 7. Estimated ANOVA of relationship between response variables (extraction yield) and independent variables (x1, x2 and x3)
for response surface quadratic model.
Source SST df MS F-Value p-value
Prob >F
Model 3301366 9 366818.5 3.606939 0.029
𝑥1 4902.709 1 4902.709 0.048209 0.8306 𝑥2 731993.3 1 731993.3 7.197717 0.023 𝑥3 976072.3 1 976072.3 9.597755 0.0113 𝑥1𝑥2 2266.328 1 2266.328 0.022285 0.8843 𝑥1𝑥3 406463.8 1 406463.8 3.996774 0.0735 𝑥2𝑥3 389028.2 1 389028.2 3.825328 0.079
𝑥12 443707 1 443707 4.362988 0.0633 𝑥22 247389.7 1 247389.7 2.432592 0.1499 𝑥32 84216.33 1 84216.33 0.828102 0.3842 Residual 1016980 10 101698
Lack of fit
789641.9 5 157928.4 3.473428 0.099
Pure error
227337.9 5 45467.59
Cor. total
4318346 19
SST, MS, and df stand for Sum of Squires, Mean Squire, and Degree of Freedom, respectively.
Table 8. ANOVA of relationship between response variables (extraction yield) and independent variables (x1, x2 and x3) in
response surface reduced quadratic model.
Sour-ce
SST df MS F-Value
p-value Prob >F
Model 3214883 7 459269.1 4.994487 0.0075
𝑥1 4902.709 1 4902.709 0.053316 0.8213 𝑥2 731993.3 1 731993.3 7.960324 0.0154 𝑥3 976072.3 1 976072.3 10.61465 0.0069 𝑥1𝑥3 406463.8 1 406463.8 4.420237 0.0573 𝑥2𝑥3 389028.2 1 389028.2 4.230627 0.0621 𝑥12 487734.6 1 487734.6 5.304045 0.0400 𝑥22 279641.6 1 279641.6 3.041063 0.1067
Resi-dual
1103462 12 91955.21
Lack of fit
876124.5 7 125160.6 2.752744 0.1413
Pure error
227337.9 5 45467.59
Cor. total
4318346 19
It was observed that most significant variables were the linear terms of extraction time (x3) and stirring rate (x2).
The result suggested that the change in extraction time (p < 0.0069) and stirring rate (p < 0.0154) had considerable effects on the LLE of persipeptides. Indeed, extraction time (x3) had a pivotal effect in LLE method and was required to be optimized in order to achieve high efficiency in extraction of the persipeptides. The procedure time was the driving force
for transportation of the persipeptides from aqueous solution to organic solvent as a result of the increase in compounds interaction with organic solvent until the extraction equilibrium has been reached. However, if the time is set erroneously high, then persipeptides will be degraded3 and in turn, the extraction efficiency will decrease. Persipeptides degradation may reach up to 21 % when fermentation broth is kept at room temperature for 24 h prior to extraction or its concentration may be decreased by up to 13 % when the broth is preserved at 4 ˚C in BuOH for same period of time.3 Results showed that the extraction time is in reverse relationship with the percentage of organic solvent used, justifying the existence of significant interaction between two factors, which was found in the screening design. In high percentage of organic solvent, the time of extraction could be diminished to as low as 33 min. Nevertheless, increasing the rate of stirring as high as possible (up to 300 rpm), which was the second most important factor in this process, enhanced the extraction capability. These are in accordance with other studies conducted on the effect of stirring rate, solvent amount, and hold-up on efficiency of a typical extraction process, which have reported that when stirring speed and solvent amount were increased, the efficiency increased. Additionally, it has been proposed that the efficiency of the compounds extraction increased monotonously with speeding up stirring rate.23 Following the mathematical model fitting, multiple response method, called the desirability function (D), was employed to optimize the studied parameters.
This method was applied to meet the requirement for increasing the yield of extraction in as shortest process as possible to both decrease the expenses and prevent persipeptides degradation. The most desired value for the responses is a desirability value of one, whereas a value equal to zero represents an unacceptable value for responses.
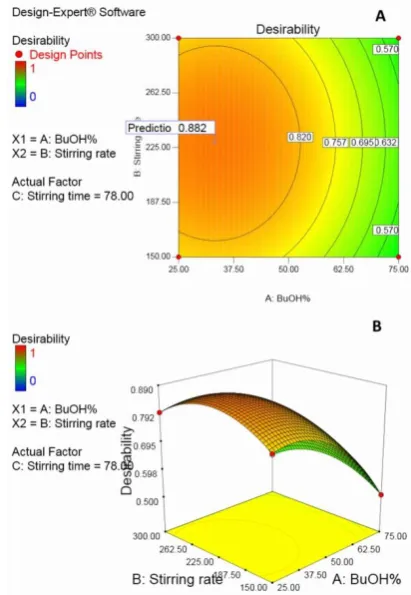
The aim of the optimization was to improve the LLE efficiency of persipeptides. In this approach, a process with desired characteristics is obtained by combining process parameters, which has been evaluated by RSM, into a single variable for the prediction of the optimal levels of the independent variables. To achieve the highest desirability, all factors were set to within range, except the concentration of persipeptides that was set to maximum level. Figures 2A and 2B, respectively, illustrate the contour plot and 3D surface graph of desirability for LLE of persipeptides generated from 15 optimum points through numerical optimization.
Among 30 starting points, the best local maximum for LLE of persipeptides (264 ± 9.85 µg mL-1) was resulting in 34 % BuOH, 228 rpm (stirrer speed), and 78 min (stirring time) with the value of desirability of 0.88. Compared with un-optimized process (persipeptides concentration of 219.63 ± 2.48 µg mL-1), the optimized conditions increased the extraction of persipeptides by 20.20 %, while decreased both time and percentage of BuOH by 67 % (162 min) and 16 %, respectively. Therefore, using optimized LLE method and suggested fermentation broth, a total of seven times increased in persipeptides production was reached. Nevertheless, from large scale prospect, the final reaction conditions i.e. broth pH, 9-9.5; temperature, 28 ˚C; stirrer speed, 228 rpm; percentage of BuOH; 34 %; and process time, 78 min have industrial compatibility.
This is because of no pre-pH adjustment requirement for LLE of persipeptides as the ambient pH of S. zagrosensis
CM1 broth is within the mentioned range. It is worth to note that as pH increased and temperature decreased the corrosion rate of steel from different parts of extraction plants decreased, which is an astonishing feature of this optimized process. Moreover, minimum facilities and energy consumption are required for adjusting temperature at 28 ˚C; therefore, greatly decreases the expense of extraction. The percentage of BuOH was decreased in expense of increasing time from 33 to 78 min to minimize instrument corrosion and solvent usage and its subsequent evaporation expenses. However; despite great effort, the agitation could not be decreased and indeed increased from 150 rpm in un-optimized process to 228 rpm in further optimized method, which is inevitably still not considered as an improving step.
Conclusions
The direct impact of this optimization is on decreasing the cost of extraction as well as the time of process, whereas increasing the yield of extraction. This in turn, facilitates further clinical trial investigations, which require several of grams of purified persipeptides. This was the first attempt reported on retrieval of persipeptides from fermentation broth that has been optimized. It has been previously shown that presence of glucose plus a more slowly utilized carbon source such as malt result in production of higher secondary
metabolites, as glucose utilization results in good growth of bacteria and complex carbon source is used for antibiotic synthesis.24 However, rapid catabolism of glucose has been shown to decrease the rate of antibiotic production.25, 26 In practice, ISP2 medium, which have been tested on the basis of this assumption failed to increase the production of persipeptides. In contrast, both CM1 and CM6 increased the production of persipeptides. These increases may be due to the fact that application of low solubility carbon sources, such as insoluble starch in CM1 and glycerol in CM6, prevents carbon catabolite regulation.26 Despite the advantage of utilization of glycerol in fermentation, which contains more energy than starch and glucose on a weight-to-weight basis, it has some disadvantages, including higher oxygen requirement, increased medium viscosity, and more problematic downstream processing.26 Interestingly, both CM1 and CM6, considerably enhanced persipeptides production by six and four times, respectively, compared to ISP2 medium. CM1 and CM6 contain soybean, which is a rich source of valine and phenylalanine amino acids with percentage of total weight on dry basis of 2.06 ± 0.19 and 2.16 ± 0.21, respectively.27 These amino acids are present in core structure of persipeptides with repetitions as the only utilized amino acids. CM1 contains three times more soybean than CM6, which may explain its 37 % (approximately 60 µg L-1) more persipeptides production, compared to CM6 by means of providing more valine and phenylalanine. It has been observed that increase in amount of CaCO3 from 2 to 10 g L -1 improves the production of persipeptides (Data not shown); however, there is little knowledge on effects of various salts in biosynthesis of persipeptides. Therefore, a systematic study using a number of techniques such as labeled precursors for the study of various media components and its further optimization for exploiting the best result are required.
References
1Brown, E.D., Wright G. D., Nature, 2016; 529(7586), 336. 2Mohammadipanah, F., Matasyoh, J., Hamedi, J., Klenk, H .P.,
Laatsch, H., Bioorg. Med. Chem., 2012; 20(1), 335.
3Mohammadipanah, F., Panahi, H. K. S., Imanparast, F., Hamedi, J.,
Chromatographia, 2016, 79(19-20), 1325.
4Davidson, B. S., Chem. Rev., 1993, 93(5), 1771.
5Cody, W. L., He, J. X., Reily, M. D., Haleen, S. J., Walker, D.,M.,
Reyner, E. L., Stewart, B. H., Doherty, A. M., J. Med. Chem.,
1997, 40(14), 2228.
6Rajeswaran, W., Hocart, S .J., Murphy, W. A., Taylor, J. E., Coy,
D. H., J. Med. Chem., 2001, 44(8), 1305.
7Dechantsreiter, M. A., Planker, E., Mathä, B., Lohof, E.,
Hölzemann, G., Jonczyk, A., Goodman, S.L., Kessler, H., J.
Med. Chem., 1999, 42(16), 3033.
8Hess, S., Ovadia, O., Shalev, D.,E., Senderovich, H., Qadri, B.,
Yehezkel ,T., Salitra, Y., Sheynis, T., Jelinek, R., Gilon, C., Hoffman, A., J. Med. Chem., 2007, 50(24), 6201.
9Barker, P.,L., Bullens, S., Bunting, S., Burdick, D.,J., Chan, K.,S.,
Deisher, T., Eigenbrot, C., Gadek T.,R., Gantzos, R., J. Med.
Chem., 1992, 35(11), 2040.
10Dong, M. W., Modern HPLC for Practicing Scientists, Wiley,
Hoboken, 2006.
11Snyder, L.,R., Kirkland, J.,J., Dolan, J.,W., Basic Concepts and the
Control of Separation. Introduction to Modern Liquid
12Araujo, P. W., Brereton, R. G., Trends Anal. Chem., 1996, 15(2),
63.
13Bezerra, M. A., Santelli, R. E., Oliveira, E. P., Villar, L. S.,
Escaleira, L. A., Talanta, 2008, 76(5), 965.
14Ghafari, S., Aziz, H. A., Isa, M. H., Zinatizadeh, A. A., J. Hazard.
Mater., 2009, 163(2), 650.
15Li L.Z., Zheng H., Xian M., J. Taiwan Inst. Chem. Eng., 2010,
41(3), 252.
16Shioya, S., Morikawa, M., Kajihara, Y., Shimizu, H., Appl.
Microbiol. Biotechnol., 1999, 51 (2) 164.
17Zhu, Y., Chen, G., Wu, M., Miao, X., Xu, J., Wang ,M., Chin. J.
Pharm., 2010, 3, 014.
18Marques, D. A. V., Cunha, M. N. C., Araújo, J. M., Lima Filho, J.
L., Converti, A., Pessoa. J. R. A., Porto, A. L., Braz. J. Microbiol., 2011, 42 (2), 658.
19Saval, S., Pablos, L., Sanchez, S., Bioresour. Technol., 1993, 43
(1), 19.
20Adinarayana, K., Ellaiah, P., Srinivasulu, B., Devi, R. B.,
Adinarayana, G., Process Biochem., 2003, 38 (11), 1565.
21Viana Marques, D., Pessoa Júnior, A., Lima Filho, J., Converti, A.,
Perego, P., Porto, A., Biotechnol. Prog., 2011, 27 (1), 95.
22Atkinso, A., Donev, A., Technometrics, 1996, 38 (4), 333. 23Abolghasemi, H., Moosavian, M., Bahmanyar, H., Maragheh, M.
G., Iran J.Chem. Eng., 2005, 2 (1), 11.
24Martín, J. F., Demain, A. L., Microbiol. Rev., 1980, 44 (2), 230. 25Revila, G., Lopez Nieto, M. J., Luengo, J. M., Martin, J. F., J.
Antibiot., 1984, 37 (7), 781.
26Saudagar, P. S., Survase, S. A., Singhal, R. S., Biotechnol. Adv.,
2008, 26 (4), 335.
27Kovalenko, I. V., Rippke, G. R., Hurburgh, C. R., J. Agric. Food
Chem., 2006, 54 (10), 3485.