Research Article
a
April
2019
Computer Science and Software Engineering
ISSN: 2277-128X (Volume-9, Issue-4)
Assessing EnergeiApp for Electricity Energy Reduction
Stamatios ManoliadisDemocritus University of Thrace, Greece
Abstract— It is well known that interventions aiming at modifying consumer activities such as feedback can play a significant role in reducing electricity consumption and thus to protect the environment without requiring require significant investment for their implementation. In this context, this work using a mobile application ( Energei App) aims at a systematic monitoring of consumers using new technologies (mobile use, .programming in jawa language) along with feedback and prizes. It is a systematic monitoring of consumers using new technologies (mobile use, .programming in jawa language) along with feedback and prizes. The embodiment was applied to both groups A and B consumers and significant results were recorded in reducing the electrical consumption to a large percentage. Specifically for Group A, the average of the per cent difference between the reference period and the period main intervention was 11.3% and for group B 9.7%. In conclusion, the better monitoring of changes in the behavior of consumers using mobile and scheduling with Jawa along with feedback and prizes contributes with better consistency to electricity reduction actions
Keywords— Energei App, Feedback, mobile use, programming, jawa language, electricity consumption
I. INTRODUCTION
In the last few years, it is noticed that mobile smart devices are becoming very essential component of our daily life. The smart phones can do a variety of very useful jobs. In addition to make calls, they can be used to create and share multimedia files, run very useful applications and do data processing. Some of these applications keep track of consumer energy consumption. By adding meters for electricity to the database and record the current meter readings from time to time can be not only explained but also to reinforce users to economize energy [1].
For each unit of consumption the apps calculate the cost per hour, day, week, month or year but without feedback and reinforcing positive activities.
Usually in these applications the annual consumption is calculated for rooms and equipment types and shown in pie charts. A consumption and an amortization calculator complement this app and some power saving tips that help consumers save energy. According to [2] the main part of the bibliography has shown that feedback can play a role in reducing electricity consumption in a range of 5% to 20% [3], [4], [5].
Recent technological developments (mobile use, java programming, etc.) have not been used in the literature to help better monitor consumer behavioural changes [6]. Such implementation would undoubtedly contribute to better monitoring and feedback of energy savings and cost [7]. In this way there is a need for a more detailed and systematic monitoring of the consumer and feedback, which thoroughly explores the results, which has led us to this research (labor displacement).
In this context, the aim of this work is to systematically monitor consumers using new technologies (mobile use, java programming) along with feedback and prizes.
II. METHODOLOGY
A Jawa computer program was developed and tested in a pilot application. The app is available for free from the Google PlayStore Android app exchange platform. [1] The purpose of this research is to find out whether daily feedback can, through its direct boosting power, bring about behavioural changes. The framework of the application for ANDROID environments was implemented on the platform ANDROID STUDIO which uses the programming languages JAVA and HTML and tested as follows:
package com.energeiapp.smano.app; import android.content.Context;
ISSN(E): 2277-128X, ISSN(P): 2277-6451, pp. 64-69 import org.junit.runner.RunWith;
import static org.junit.Assert.*;/**
* Instrumentation test, which will execute on an Android device. *
* @see <a href="http://d.android.com/tools/testing">Testing documentation</a> */ @RunWith(AndroidJUnit4.class)
public class ExampleInstrumentedTest { @Test
public void useAppContext() throws Exception { // Context of the app under test.
Context appContext = InstrumentationRegistry.getTargetContext();
assertEquals("com.example.smano.app", appContext.getPackageName()); }}
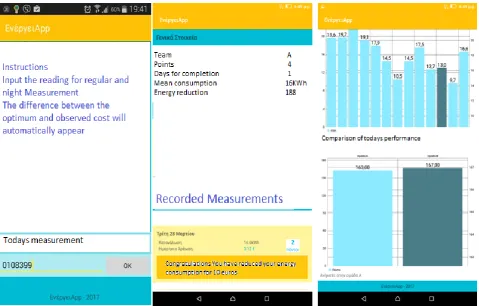
The application was designed to be as user-friendly as possible and at the same time to give the user useful information and consumption monitoring (Figure1). "Energeiapp" is available on the android software platform Google Play. Users downloaded it to their mobile and were asked to give their email and a password. Every day at a specific time the measurement was recorded and then they could be informed about the consumption data and compared it with the previous ones and evaluate their energei behaviour. The research sample consisted of 20 households from the wider area of Athens (areas of Sepolia, Papagou, Nursing home, Pagrati, Patisia in Greece). Participants daily for the two weeks entered the meter reading in the input box and then the consumption data was calculated automatically. For the most part, participants used oil or gas for heating and in some cases for cooking. Electricity was used for lighting, cooking household appliances charging devices and other uses.
Fig. 1. 1 EnergeiApp-Recorded measurements-Graphic representation
In the first phase, which lasts four days, the base consumption is determined. During the initial four-day period users are only informed about their consumption in KWh and the cost of such consumption.
The apartments were divided into matching groups. In this way, if for some reason we had a loss of participants, this would not affect the survey
ISSN(E): 2277-128X, ISSN(P): 2277-6451, pp. 64-69 The participants earned points according to their savings compared to the initial period. (Figure2)
Users were then divided into two groups according to the number of residents in each apartment. The first group received data on the performance of its team over the other group while the second group received data on individual performance relative to the average of the users.
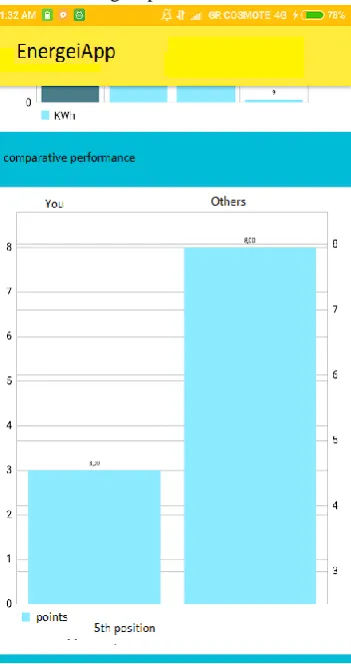
Generic data on the top of the screen showed consumption data. These are all points, billing up to that point, an account forecast, average consumption, and an estimate of savings over a four-month period (Fig. 2) as well as the comparative performance (Fig. 3).
Fig. 2 Points, billing up to that point, an account forecast, average consumption, and an estimate of savings over a four-month period
Also in the general information was the participation group if the participant belongs to the first group or the classification if the participant belongs to the second group.
ISSN(E): 2277-128X, ISSN(P): 2277-6451, pp. 64-69 In the list of recorded measurements the user could find information about the consumption of the previous days. (Fig. 4)
If a reduction in consumption was achieved over the first three days, a message that provided additional consumption information was presented along with the number of points earned. The congratulatory message contained information on the percentage of decline, an account forecast, and a consumption estimate if use continued at last day's levels.
Fig. 4 Consumption of the previous days
If the consumption is less than the average of the reference period the participants earn one point if it is less than 0.9 of the average of two points and if it is less than 0.8 three points.
Through the application, the points in each group were ranked and averaged each time a change in user data was made.
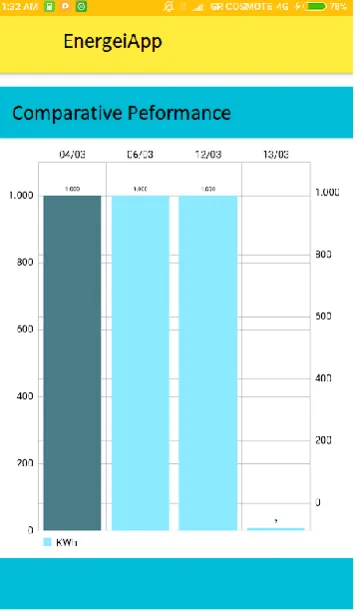
At the bottom of the mobile screen were two graphs. One graph would show user consumption data as recorded until that time (Figure 5).
Figure 5. Consumption data as recorded
ISSN(E): 2277-128X, ISSN(P): 2277-6451, pp. 64-69 Consumption data was stored in a database that allowed for alerts as well as for analysing the traffic of the app. easy
III. RESULTS
At the end of the intervention period, consumption data was extracted from the database and processed statistically with the SPSS program. The statistical data as well as the consumption data can be found in the annexes of this issue
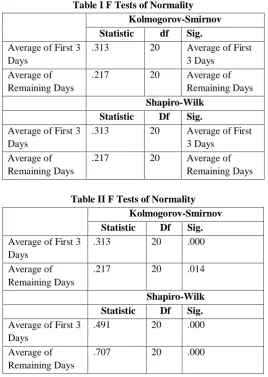
For both the consumption data of the trial period and the consumption data over the remaining days of intervention, a significant deviation from the normal distribution (Sig <0.05) and a small sample (N = 20) is shown. For this reason, we will rely on non-parametric statistical checks to analyze our data.
The average consumption in the first 3 days, D (20) = 0.31, p <.001, and the average consumption for the main intervention period, D (20) = 0.22, p <.05, were abnormal.
Table I F Tests of Normality Kolmogorov-Smirnov
Statistic df Sig.
Average of First 3 Days
.313 20 Average of First
3 Days Average of
Remaining Days
.217 20 Average of
Remaining Days
Shapiro-Wilk
Statistic Df Sig.
Average of First 3 Days
.313 20 Average of First
3 Days Average of
Remaining Days
.217 20 Average of
Remaining Days
Table II F Tests of Normality Kolmogorov-Smirnov
Statistic Df Sig.
Average of First 3 Days
.313 20 .000
Average of Remaining Days
.217 20 .014
Shapiro-Wilk
Statistic Df Sig.
Average of First 3 Days
.491 20 .000
Average of Remaining Days
.707 20 .000
For the homogeneity test, for the trial period the deviations were not significantly different F (1,19) = 3,93, as for the main intervention period F (1,19) = 1,02, p> 0,05. For both of our samples the variations do not differ significantly indicating that the homogeneity assumption is satisfied.
Table III Test of Homogeneity of Variance Levene
Statistic df1 df2 Sig.
Average of First 3 Days
Based on Mean 3,421 1 18 .081
Based on
Median 1.247 1 18 .279
Based on Median and with adjusted df
ISSN(E): 2277-128X, ISSN(P): 2277-6451, pp. 64-69 Based on
trimmed mean 2.137 1 18 .161
Average of Remaining Days
Based on Mean 1.191 1 18 .290
Based on
Median .182 1 18 .675
Based on Median and with adjusted df
.182 1 9.684 .679
Based on
trimmed mean .728 1 18 .405
As our data does not meet the normality requirements, and due to the small number of samples we will use non-parametric controls, namely the Mann-Whitney tests. The logic of these tests is based on the classification of the data for the two groups and the statistical analysis based on these rankings.
For both group A (Mdn reference = 16.93), (Mdn intervention = 13.14) T = 0, p <0.01, r = 0.60 and for group B (Mdn reference = 0.05, r = 0.71 consumption was significantly lower during the main intervention period
Group A appears to have reduced electricity consumption to a greater extent. For Group A, the average percentage difference between the reference period and the main intervention period was 11,3% and for group B 9,7%.
However, the difference in the consumption levels of group A for the main intervention period (Mdn = 11.3%) did not differ significantly from that of group B (Mdn = 9.3) compared to the reference period, U = 42, z = -0.604 , ns, r = -0.135.
IV. CONCLUSIONS
In conclusion, the better monitoring of changes in the behavior of consumers using Energeiapp mobile and scheduling with jawa along with feedback and prizes contributes with better consistency to electricity reduction actions. Informed by the model, we develop Energeiapp, a protocol that minimizes electricity energy usage while using feedback from consumers specified. Energei App aggressively prefetches data, and yet reduces the overall energy consumed. Our model-driven simulation shows that Energeiapp can reduce energy by intervention was 11.3% and B 9.7% for the two groups considered. Group A seems to have reduced electricity consumption to a greater extent. For Group A, the average percentage difference between the reference period and the main intervention period was 11,3% and for group B 9,7%.
REFERENCES
[1] Stamatios Manoliadis EnergeiApp available at https://apkgk.com/APK-Downloader?package=com.energeiapp.
smano. barchart.
[2] Farhar, B. C., & Fitzpatrick, C. (1989). Effects of Feedback on Residential Electricity Consumption: A Literature Review. Colorado: Solar Energei Research Institute. Vo;. 1 pp. 34-56
[3] Energy Advisor available at https://play.google.com/store/apps/details?id=com.energy.advisor
[4] Tarkoma Matti Siekkinen Eemil Lagerspetz Yu Xiao Smartphone Energy Consumption: Modeling and
Optimization available at https://play.google.com/store/books/details/Sasu_Tarkoma_Smartphone_