Research Article
a
April
2019
Computer Science and Software Engineering
ISSN: 2277-128X (Volume-9, Issue-4)
Performance Comparison of Artificial Neural Network
Techniques for Classification and Prediction of
Breast Cancer
Hemalatha L Preethi J Bhuvaneshwari P
Computer Science & Engineering Anna University Regional Campus,
Coimbatore, Tamilnadu, India
Computer Science & Engineering Anna University Regional Campus,
Coimbatore, Tamilnadu, India
Computer Science & Engineering Anna University Regional Campus,
Coimbatore, Tamilnadu, India
[email protected] [email protected] [email protected]
Abstract: Data Mining is used to retrieve the information from the huge amount of data. Data mining is important field from all the fields for providing accurate prediction of diseases and deeper study of medical data. Data mining application involves analysing Breast cancer, which are the most dangerous disease cause of cancer deaths in women worldwide. Artificial Neural Network is used here to predict the breast cancer by analysing the nine technical indicators like clump thickness, uniformity of cell size, uniformity of cell shape, marginal adhesion, single epithelial cell size, bare nuclei, bland chromatin, normal nuclei and mitoses[3]. This study compares the four models namely Pattern Recognition Networks, Feed Forward Back Propagation Networks, Feed Forward Networks with no feedback, and Radial Basis Function Network to predict the breast cancer. The performance of all these models are examined from accuracy measures like Mean Square Error, Mean Absolute Error, Sum Square Error and Root Mean Square Error. From the examined result, the performance of Radial Basis Function network was considered as a best network for predicting the breast cancer.
Keywords: Data mining, Breast Cancer, Feed Forward Back Propagation networks, Feed Forward networks, Pattern Recognition networks Radial Basis Function, Technical Indicators.
I. INTRODUCTION
Breast cancer is one of the main health issues in today‟s social world. Breast Cancer is develops from breast tissue. The main reasonfor breast cancer are fatness, lack of physical effect, intaking alcohol, hormones replacement therapy and early age at first mensuration. Breast Cancer is one of the main disease to deathin developing countries and a second cause in developed countries as per the statistics of National Cancer Institute.
The cancer tissue can form in both male and female. But the female get more issues in their health issues than the male. Breast cancer is most commonly discovered as an asymptomatic nodule on a mammogram. Breast cancer is a malignant growth of abnormal cells that begins in the tissues of the breast. It may also be defined as a tumour that starts its growth in the glandular tissue within the breast. It can appear as a non-invasive cancer, called cancer in-situ where the cancer cells are confined only to the basement membrane and do not invade surrounding tissue.
Cancer in-situ can be of ductal type, which means that the cancer starts growing in the gland ducts, or it can be of lobular type, which starts out in the gland lobule. Breast cancer originating from breast tissue from the lobules that supply the ducts with milk. Tumours are of three types: Benign breast tumours, Non-invasive cancer and Invasive cancer
1.1 Benign Breast Tumors
This is the first stage of tumours and most of the tumours detected by mammograms are benign. They are non-cancerous and they don‟t seed metastasis. As a result they don‟t spread outside the breast and to other parts of the body.
1.2 Non-Invasive Cancer
ISSN(E): 2277-128X, ISSN(P): 2277-6451, pp. 29-41
1.3 Invasive Cancer
If the cancer has broken into the basal membrane and spread into the surrounding tissues, it is called invasive cancer. Treatment of the breast cancer depends on the stage of the tumour. Two features determine the stage of the tumour, its size and the spreaded areas. If the size of the tumour is smaller than 20mm and if no metastases are found, the chance of successful treatment is possible. However the size for invasive cancer may vary from 8mm to over 10mm in diameter.
1.4 Causes for Breast Cancer
There are manycauses for breast cancer. However most women who develop breast cancer do not have any hereditary reason. As woman gets older the chance of getting breast cancer is high. There is a possibility of 75% of women who are of the age 45 and above having cancer causing tissues. Chance of breast cancer increases after having a first birth at the age of 30 or more. Women who are affected by Hodgkin‟s disease at the age of 30 or below remain at higher risk for breast cancer throughout their lives. These women require careful observation for breast cancer. Following circumstances place woman higher than average risk for breast cancer.
Family history of a prior breast cancer
Genetic change.
Close relatives with a history of breast cancer(especially if diagnosed at a young age)
Artificial Neural Networks (ANN) is working among the data like the human brain working process. It is an perfect method for predicting the breast cancer present in the human body.The advantage of neural networks is the network gives correct and accurate result when the network is properly trained by giving the accurate data.Also, the learning ability of neural networks adjusts to the variant symptoms. The disadvantage of neural networks is that the entire process is time consuming and overfitting to the given data.
In the literature study, the analysing result of predicting the breast cancer and its performance are discussed.B.Padmapriya, T.Velmurugan, used the ID3 and C4.5 to classify the breast cancer analysis. The paper says that the C4.5 algorithm is better than all other classification algorithm and accuracy is very high to classify the breast cancer. This algorithm also handles the incomplete data and it cannot be over fitted like ID3 algorithm.
Souad Demigha, Decision tree is used to classify the breast cancer. This paper proposed because decision tree is simpler to use and understand. It combines data with various types, models non-linear functions, handles classification and tools. This system get the correct data and prepare it and check the models. This paper is mainly proposed for improving the qualityof classification of breast cancer at low cost in the medical areas. The data mining techniques in the medical field is useful to diagnosis, decision making, screening, monitoring, therapy support and patient management.
A. Soltani Sarstani, A.A. Safavi, N.M. Parandeh, M. Salehi, This paper discussed about to find the percentage of disease development by using the developed network. The performance of the statistical neural network structures, self-organizing map, radial basis function network, general regression neural network and probabilistic neural network are tested both on the Wisconsin breast cancer data and Shiraz Namazi Hospital breast cancer data. Radial basis function network and probabilistic neural network were proved as best classifier algorithms for the given dataset. However, probabilistic neural network was considered as an efficient algorithm.
In this paper, nine technical indicators like clump thickness, uniformity of cell size, uniformity of cell shape, marginal adhesion, single epithelial cell size, bare nuclei, bland chromatin, normal nuclei and mitoses. The four ANN techniques namely Pattern Recognition Networks, Feed Forward Back Propagation Networks, Feed Forward Networks with no feedback, and Radial Basis Function Network were used to predict the breast cancer. The performance of all these models are analysed from accuracy measures namely Mean Square Error, Mean Absolute Error, Sum Square Error and Root Mean Square Error.[2]
The paper is divided into five sections:
Section 1: Introduction and Literature survey. Section 2: Technical indicators and the datasets used. Section 3: Artificial Neural networks.
Section 4: Performance comparison. Section 5: Conclusion
II. RESEARCH DATA
ISSN(E): 2277-128X, ISSN(P): 2277-6451, pp. 29-41
net.divideParam.trainRatio = 70/100; net.divideParam.valRatio = 15/100; net.divideParam.testRatio = 15/100;
Table 1: Details of dataset
Details of the dataset Training sample Validation sample Testing sample
700 490 105 105
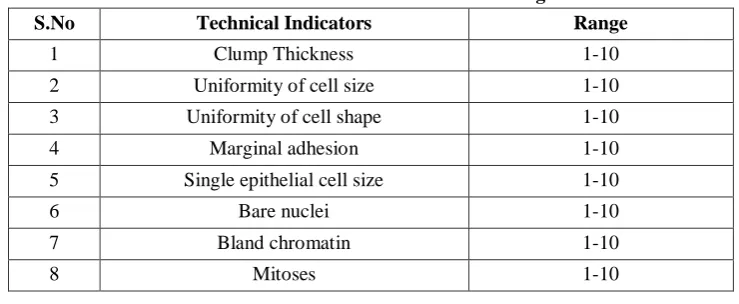
2.1 Technical Indicators
In this research study, nine technical indicators are used as inputs to the network for predicting the breast cancer. The range of the nine technical indicators are given in table 2.
Table 2: Technical Indicators and its range
S.No Technical Indicators Range
1 Clump Thickness 1-10
2 Uniformity of cell size 1-10
3 Uniformity of cell shape 1-10
4 Marginal adhesion 1-10
5 Single epithelial cell size 1-10
6 Bare nuclei 1-10
7 Bland chromatin 1-10
8 Mitoses 1-10
III. ANN
Artificial neural networks are a kind of artificial intelligence that works in the principle of a human brain. It is comprises of highly interconnected processing elements called neurons which process the given information to solve the given specific problems. The neurons are connected by connection links. Each link separately has a weights from one neuron to another neuron. The technical indicators are the inputs to the network as an input signal. The weights are used here to multiply with the each input signal. The performance of this network is improved by using Bias value to the neural network. Then these products of inputs and bias value are summed and giveto next layer by giving activation function to produce result. There are two basic types of networks, feedback networks and feed forward networks. In feedback networks, after the output values are obtained, it again go to the inout layer like looping. In feed forward networks, the output value caluculated for each and every input value given to the network, the output value read from corresponding output neurons. The feedbacking to the input layer is not allowed.The most common feed forward networks is the Back Propagation network (BPN) and Radial Basis Function network (RBF) [2].
3.1 Data Collection and Acquisition
Data set related to software defect detection is collected and given as input for the process.
3.2 Pre-Processing
In the table may be occur invalid data. In the pre-processing stage remove the invalid numbers. And also convert the string values into numerical values for the further implementation. Pre-processing is a process of convert the dataset into reasonable format.
3.3 Split Dataset as Training and Testing
The whole data set is divided as training set and testing set. For example if a dataset consist of 100 data then it can be divided in to 70% of dataset as training dataset and remaining as testing data.
ISSN(E): 2277-128X, ISSN(P): 2277-6451, pp. 29-41
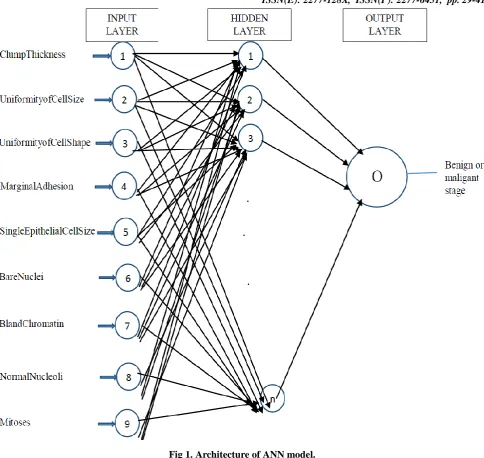
Fig 1. Architecture of ANN model.
This section presents the applications of four models namely Pattern Recognition networks, Feed Forward Back Propagation Networks, Feed forward networks with no feedback, and Radial Basis Function network to predict the breast cancer.[2]
3.4 Pattern Recognition Network
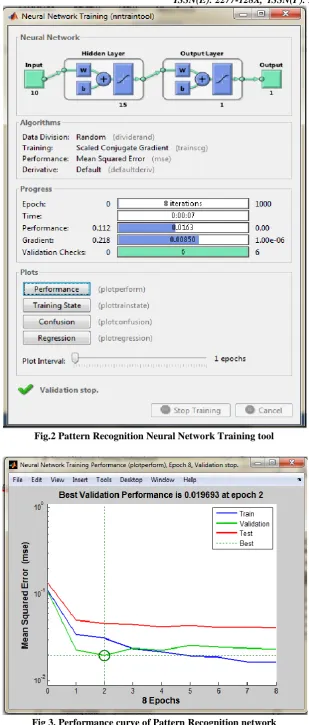
The Pattern Recognition network uses the algorithms for finding the regularities present in the data and they have been used for the classification of data into several groups. Pattern recognition network executes most likely data matching on the inputs. The nine indicators are presented to the inputs to input layer. Here the default Scaled Conjugate Gradient algorithm (TRAINSCG) is used for training and 15 hidden neurons are used in the hidden layer[2].The error can be minimized by adjusting the weights between the outputs present in the output layer and the target of the matching inputs. The below screenshots shows the training, confusion matrix and regression analysis of the pattern recognition network.
3.4.1 Training the Pattern Recognition network
ISSN(E): 2277-128X, ISSN(P): 2277-6451, pp. 29-41
Fig.2 Pattern Recognition Neural Network Training tool
ISSN(E): 2277-128X, ISSN(P): 2277-6451, pp. 29-41 3.4.2 Confusion Matrix
The confusion matrix gives the exact information on predicted unit and target unit. The diagonal elements in the matrix show the correctly classified labels. Each element (i,j) in the matrix represents number of samples where the known target samples is represented by i, and predicted samples is represented by j. The confusion matrix for training set, validation set and testing set are found and shown in Fig.4. The confusion matrix is calculated by the comparing the outputs of the network with the targets.[2]
Fig 4. Confusion matrix of Pattern Recognition network.
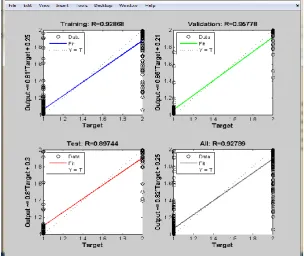
3.4.3 Regression Analysis
Regression plots are linear regression between network outputs and the corresponding targets. The regression analysis have been drawn for three partition of data: Training, Validation and Testing. If the value is closely related to 1 means then it is a good fit for the given input and predicted output.If the value is closely related to 0 means then the given input and predicted output are not fit. Regression plot is drawn for the pattern recognition network and is shown in Fig.5. It is clearly understood from the figure, that in the training stage, R-value has 0.92868 and in the validation stage, R-value has 0.95778 and in the testing stage, R-value has 0.89744. Wholly, R-value has 0.9278 which is closer to 1. This shows that the network tracks the targets well and it is good fit to the given input [2].
ISSN(E): 2277-128X, ISSN(P): 2277-6451, pp. 29-41
3.5 Feed Forward Back propagation network
During feed forward stage, each input unit (Ii) receives an input signal from seven technical indicators and transmits
these signals to hidden units (Hi). The errors are calculated and back propagated to the previous layer. This section
discusses the training, performance and regression analysis of Feed forward back propagation network.The training and Regression analysis of the proposed Feed Forward Back Propagation Network is discussed below
3.5.1 Training the Feed Forward back propagation network
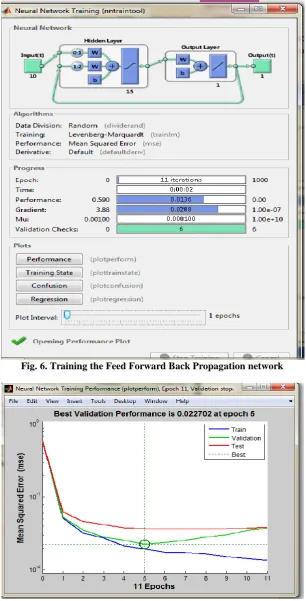
In this model, 15 neurons are used in the hidden layer and Levenberg-Marquardt algorithm (TRAINLM) is used for network training. Updates the weights and bias according to the Levenberg-Marquardt algorithm. The training stage of the proposed model is shown in Fig 6. This network runs upto 11 iterations to achieve the best performance goal.[2]
Fig. 6. Training the Feed Forward Back Propagation network
ISSN(E): 2277-128X, ISSN(P): 2277-6451, pp. 29-41
A plot of training errors, validation errors and testing errors are achieved using this model and it is shown in Figure 7. It explains that the best performance accuracy is achieved at 0.022702 at epoch 5.
3.5.2 Regression Analysis
The Regression plot is drawn for the training, validation and testing stages and it is given in Fig. 8. The training stage has R-value of 0.95798 and validation stage has R-value of 0.95196 and testing stage has 0.91952. As a whole, this feed forward back propagation network has 0.9512 which is closer to 1. This implies that output samples matches closely with the target samples.
Fig 8. Regression plot for Feed Forward Back Propagation Network
3.6 Feed Forward Networks without Feedback
Feed forward networks are networks where only forward flow of information is present. There is no feedback. This model uses one input layer, two hidden layers and one output layer. The input layer receives the information from the technical indicators which are the inputs to the networks. The weights are associated with the inputs are given to the hidden layer for further processing The hidden layer calculates the activation function and associates weights and sent it to the output layer for prediction for cancer stage of the patient.[2]
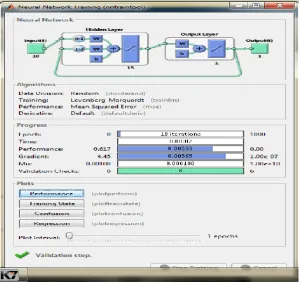
ISSN(E): 2277-128X, ISSN(P): 2277-6451, pp. 29-41 3.6.1 Training the Feed Forward Networks without Feedback
During training, this model runs ups to 18th iterations and achieves the best performance. The training process of the feed forward network without feedback is shown in Fig.9.
Fig.10 Performance curve of Feed Forward Network without feedback.
The performance curve for this model is shown in Fig. 10. This model achieves 0.039119 at epoch 1
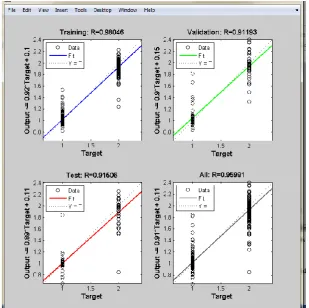
3.6.2 Regression Analysis
The Regression plot is drawn for the training, validation and testing stages and it is given in Fig. 11. The training stage has R-value of 0.98046 and validation stage has R-value of 0.91193 and testing stage has 0.91506. As a whole, this feed forward back propagation network has 0.95991 which is closer to 1. This implies that output samples matches closely with the target samples.
ISSN(E): 2277-128X, ISSN(P): 2277-6451, pp. 29-41
3.7 Radial Basis Function Network
Radial Basis Function Network is a Feed Forward Network used for approximating the functions and recognizing the patterns. The architecture, training algorithm and Regression analysis is discussed below:
3.7.1 Architecture
The architecture consists of three layers : the input layer, hidden layer and the output layer. It is a multi-layered feed forward network. Between the input layer and the hidden layer, hypothetical connection is used and between the hidden layer and the output layer the weighted connections are used [2].The architecture of the radial basis function is shown in Fig. 12.
Fig. 12. Architecture of Radial Basis Function network.
3.7.2 RBF Activation Function
There are different activation functions, but the most popular one is Gaussian activation function. The function is defined as follows:
F(x) = 2
2 2 ) (
2
1
xe
(1)Where „
‟is the mean, „
‟is the standard deviation and „x‟ is the input vectors. This function produces bell shaped curve which keeps the mean at the centre.The training algorithm of Radial basis function network is given below:
Step 1: Give the inputs to the input layer and initialize the weights for those inputs.
Step 2: Then, the weights are added with inputs and given to the hidden layer for further processing.
Step 3: The Gaussian function is an activation function used here for calculating output of each hidden layer by using 1st equation.
Step 4: Calculate the output from the output layer by using the following equation
n i i i ho ib
w
f
x
y
i
1
0
(
)
(2)Where,
yi = net output
b0 = bias of the output layer
wh0 = weights between the hidden layer and the output layer
fi(xi) = the output of the hidden layer
Step 5: Calculate the error and check for stopping condition like weight changes or the number of epochs reached. Step 6: When the stopping condition reached, stop the process.[2]
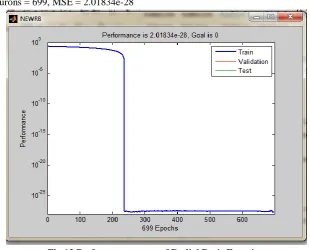
Using this model, the performance curve for the Radial Basis Function is shown in Fig.13. This curve shows that proposed work achieves error accuracy of 0.0000000000013955 at 1275 epochs. The simulated network gives the following outputs:
ISSN(E): 2277-128X, ISSN(P): 2277-6451, pp. 29-41
NEWRB, neurons = 6, MSE = 0.220306 NEWRB, neurons = 7, MSE = 0.219675 .
.
NEWRB, neurons = 699, MSE = 2.01834e-28
Fig.13 Performance curve of Radial Basis Function
IV. PERFORMANCE COMPARISON
This section presents the performance comparison of four models namely Pattern recognition network, Feed forward back propagation network, Feed forward network with no feedback and Radial basis function network. The performance indicators are calculated in order to predict the performance of the proposed models.[2]
4.1 Performance Indicators
Mean Square Error (MSE): It measures the performance with respect to the mean of squared errors.
MSE=
n
t
x
)
2(
(2)
Here „x‟ represents the input data,„t‟ represents the target data and „n‟ represents the number of observations.
Mean Absolute Error (MAE): It measures the performance with respect to the mean of absolute errors.
MAE=
n
t
x
(3)
Sum Squared Error (SSE): It measures the performance with respect to the sum of squared errors.
SSE=
(
x
t
)
2 (4) Root mean square error (RMSE): It is the square root of the mean square error.
RMSE=
n
t
x
)
2(
(5)
ISSN(E): 2277-128X, ISSN(P): 2277-6451, pp. 29-41
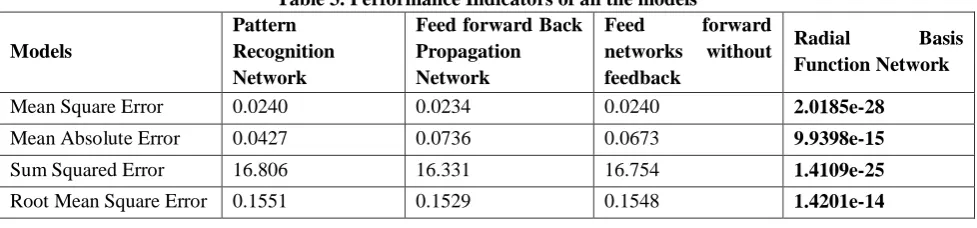
Table 3. Performance Indicators of all the models
Models
Pattern Recognition Network
Feed forward Back Propagation Network
Feed forward networks without feedback
Radial Basis Function Network
Mean Square Error 0.0240 0.0234 0.0240 2.0185e-28
Mean Absolute Error 0.0427 0.0736 0.0673 9.9398e-15
Sum Squared Error 16.806 16.331 16.754 1.4109e-25
Root Mean Square Error 0.1551 0.1529 0.1548 1.4201e-14
V. CONCLUSION
This paper proposes the four models namely Pattern recognition network, Feed forward back propagation network, Feed forward network with no feedback and Radial basis function network for predicting the breast cancer. The nine technical indicators are used as inputs to all these models and outputs are calculated and compared with the targets. Four performance indicators are Mean square error, Mean absolute error, Sum square error and Root mean square error are used to predict the performance of all these models. From the simulation results, it is understood that Radial Basis Function network performs better than all other three models.
ACKNOWLEDGEMENT
Hereby, I declare that the above work was done by us. This project focuses on the prediction of breast cancer. It will use in medical field for predicting the breast cancer with high efficiency.
REFERENCES
[1] Souad Demigh (2015), “Data Mining for Breast Cancer Screening”- The 10th International Conference on Computer Science and Education, Cambridge University, UK.
[2] Sumathi Mahadevan (2014), “Performance Comparision of Artificial Neural Network Techniques for Foreign Exchange Rate Forecasting” – International Journal of Applied Engineering Research.
[3] Haifeng Wang, Sang Won Yoon (2015), “Breast Cancer Prediction using Data Mining Method” – Industrial and Systems Engineering Research Conference.
[4] B.Padmapriya, T.Velmurugan (2014), “A survey on Breast Cancer Analysis Using Data Mining Techniques”-IEEE International Conference on Computational Inteeligence and Computinf Research.
[5] Deepika Verma, Dr.Nidhi Mishra (2017), “Analysis and Prediction of Breast Cancer and Diabetes Disease Dataset using Data Mining Classification Techniques - International Conference on Intelligent Sustainable Systems.
[6] A.Soltani Sarvestani, A.A. Safavi, N.M.Parandeh, M.Salehi(2010), “Predicting Breast Cancer Survivability Using Data Mining Techniques” - International Conference on Software Technology and Engineering.
[7] Runjie Shen, Yuanyuan Yang, Fengfeng Shao(2014), “Intelligent Breast Cancer Prediction Model Using Data Mining Techniques” - Sixth International Conference on Intelligent Human-Machine Systems and Cybernetics. [8] Veronica Burriel, Oscar Pastor, Maria Pena-Chilet, Maria T.Martinez, Gloria Ribas (2016) , “ Conceptual
Schema on miRNA‟s Expression using efficient information systems practices to manage and analyze data about miRNA expression studies in breast cancer.
[9] Kehinde Williams, Jeremiah Ademola Balogun, Peter Adebayo Idowu (2015), “Breast Cancer Risk Prediction Using Data Mining Classification Techniques” -Society For Science and Education, UK (Volume 3).
[10] Savita Kumari (2018), “Breast Cancer Classification Using Big Data Approach”- Indian Journal Of Research (Volume 7).
[11] Tulay Yildirim (2003), “Breast CancerDiagnosis Using Statistical Neural Networks” - Turkish Symposium on Artificial Intelligence and Neural Network.
[12] Shellu Gupta, Dharminder Kumar, Anand Sharma (2011),“Data Mining Classification Techniques Applied For Breast Cancer Diagnosis and Prognosis”-Indian Journal of Computer Science and Technology.
[13] Autsuo Higa (2018), “Diagnosis of Breast Cancer Using Decision Tree and Artificial Neural Network Analysis” - International Journal of Conference Application Technology and Research.
[14] Shelly Gupta, Dharminder Kumar, Anand Sharma (2011), “Data Mining Classification Techniques Applied for Breast Cancer Diagnosis and Prognosis”- Indian Journal of Computer Science and Engineering.
ISSN(E): 2277-128X, ISSN(P): 2277-6451, pp. 29-41
[16] Ahmad LG, Eshlaghy AT, Poorebrahimi A, Ebrahimi M and Razavi AR (2012), “Using Three Machine LearningTechniques for Predicting Breast Cancer Recurrence” - Health and Medical Informatics (Volume 2). [17] S.Padma Priya, P.Sowmiya (2018), “Breast Cancer Prediction Using Data Mining Techniques” - International
Journal of Research in Science and Engineering.
[18] K.Sivami (2015), “Mining Big Data: Breast Cancer Prediction Using DT-SVM Hybrid Model” - International Journal of Scientific Engineering and Applied Science (Volume 1).
[19] G.Ravikumar, Dr.G.A.Ramachandra, K.Nagamani (2013), “An Efficient Prediction of Breast Cancer Data Using Mining Techniques” - International Journal of Innovations in Engineering and Technology.