ISSN-L: 2501 - 1235 Available on-line at: www.oapub.org/edu
Copyright © The Author(s). All Rights Reserved.
doi: 10.5281/zenodo.2543683 Volume 5 │ Issue 3 │ 2019
EFFECTS OF CORE STRENGTHENING INTERVENTION
ON MAXIMAL OXYGEN UPTAKE, FLEXIBILITY AND LOWER LIMB
STRENGTH IN UNIVERSITY LEVEL CYCLISTS
Maman Pauli
Department of Physiotherapy, Guru Nanak Dev University, Amritsar,
Punjab, India
Abstract:
The aim of this study was to explore the effects of 6-week core strengthening intervention on Maximal Oxygen Uptake, Flexibility and Lower limb strength of University level Cyclists. Thirty, University level male Cyclists of Guru Nanak Dev University, Amritsar between the age group of 18-28 years (Mean ± SD: age 21.766 ± 2.2078 yrs, body height 167.533 ± 5.593 cm, body mass 63.08 ± 3.723 kg) volunteered to participate in the study. Queens College Step test was performed to calculate Maximal
Oxygen Uptake (VO2max), Sit and Reach test was performed to calculate Flexibility and
Vertical Jump Test was performed to calculate Lower limb Strength. The subjects from Group-A: Experimental were subjected to a 6-week core strength exercise program, 3 days a week for six weeks. Statistical analyses were performed using the Statistical Package for the Social Sciences for Windows version 16.0 software (SPSS Inc., Chicago,
IL). Data is expressed as the mean ± SD. Paired sample t-test was utilized to compare
the means of the Pre-Test and the Post-Test. The level of significance was set at 0.05. Significant differences were found in Maximal Oxygen Uptake, Flexibility and Lower limb Strength in the Experimental Group subjected to 6-week core strengthening intervention. However, no significant changes were noted in the Control Group at the end of 6-week duration.
Keywords: cyclist, maximal oxygen uptake, flexibility, lower limb strength, core
1.Introduction
Core stability and core strength have been subject to research since the early 1980s [1, 2]. The “core,” also referred to as the lumbopelvic-hip complex, is a 3-dimensional space with muscular boundaries: diaphragm (superior), abdominal and oblique muscles (anterior-lateral), paraspinal and gluteal muscles (posterior), and pelvic floor and hip
girdle (inferior) [3]. The inherent nature of these muscular boundaries produces a corset-like stabilization effect on the trunk and spine [4]. Generally, core stability comprises the lumbopelvic-hip complex and is the capacity to maintain equilibrium of the vertebral column within its physiologic limits by reducing displacement from perturbations and maintaining structural integrity [5, 6, 7, 8]. Clinically and practically, this definition lacks a tangible, functional perspective that translates into principles for practical application of core stability assessment and training in active, athletic population.
Core stability plays an important role in cycling performance. It exerts effect on
lower limb cycling biomechanics. The core stability has generated a lot of interest especially with regard to functional and sport specific training. Research has shown positive impact of core training on increasing performance as well as for injury prevention [8]. It has been found that Physical activity (PA) increases aerobic capacity and muscular strength, especially of the lumbar extensor muscles and is important for patients with chronic low back pain in assisting them to complete activities of daily living [9]. However, different exercises have been found to result in varying levels of effectiveness in reducing lower back pain [10]. In addition, too much or too little PA can be associated with low back pain [11], suggesting that PA as an intervention for low back pain is complex. The benefits of exercise are profound and include improved cardiovascular fitness, muscle strength, flexibility, and endurance [12].
Maximal oxygen consumption (VO2max), an index of maximal cardiovascular (CV)
function, decreases 5 to 15% per decade after the age of 25 yr [13]. Decrease in both
maximal cardiac output and maximal arteriovenous O2 difference contribute to the
age-associated reduction in VO2max [14, 15, 16, 17].
The lower limb strength and power has been examined quite frequently by isokinetic testing or vertical jump test [18]. The vertical jump test could be performed in the laboratory by using jump platforms or in the field using Sargent Jump Test (SJT). This test measures the explosive strength of lower limbs of athletes’ in different sports [19, 20]. Strength conditioning is generally defined as training in which the resistance against which a muscle generates force is progressively increased over time. Muscle strength has been shown to increase in response to training between 60 and 100% of the 1 RM [21].
Flexibility is a general term which encompasses the range of motion of single or multiple joints and is the ability to perform specific tasks. It is evident that flexibility declines with age, with the maximum range of motion occurring in the mid- to late twenties for men and women, respectively [22, 23, 24].
2. Material and Methods
2.1 Subjects
Thirty, University level male Cyclists of Guru Nanak Dev University, Amritsar between the age group of 18-28 years (Mean ± SD: age 21.766 ± 2.2078 yrs, body height 167.533 ± 5.593 cm, body mass 63.08 ± 3.723 kg) volunteered to participate in the study. The subjects were purposively divided into two groups:
Group-A: Experimental (N1=15)
Group-B: Control (N2=15)
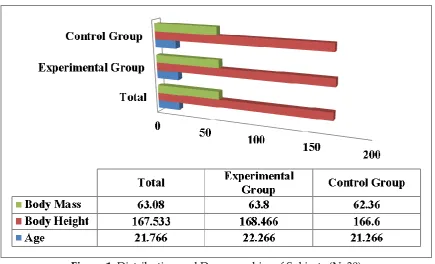
Distribution and demographics of subjects are brought forth in Table 1.
Table 1: Distribution and Demographics of Subjects (N=30) (i.e., Experimental Group (N1=15) and Control Group (N2=15))
Variable (s) Sample Size
(N=30) Total
N=30
Experimental Group (N1=15)
Control Group (N2=15) Age (yrs) 21.766 ± 2.2078 22.266 ± 2.051 21.266 ± 2.313 Body Height (cm) 167.533 ± 5.593 168.466 ± 5.396 166.6 ± 5.816 Body Mass (kg) 63.08 ± 3.723 63.8 ± 3.4207 62.36 ± 3.989 *N; sample size, yrs; years, cm; centimeters, kg; kilograms.
Figure 1: Distribution and Demographics of Subjects (N=30) (i.e., Experimental Group (N1=15) and Control Group (N2=15))
2.2 Methodology
was performed to calculate Flexibility [26] and Vertical Jump Test was performed to calculate Lower limb Strength [27]. The subjects from Group-A: Experimental were subjected to a 6-week core strength exercise program, 3 days a week for six weeks [28].
2.3 Statistical Technique
Statistical analyses were performed using the Statistical Package for the Social Sciences for Windows version 16.0 software (SPSS Inc., Chicago, IL). Data is expressed as the
mean ± SD. Paired sample t-testwas utilized to compare the means of the Pre-Test and
the Post-Test. The level of significance was set at 0.05.
3. Results
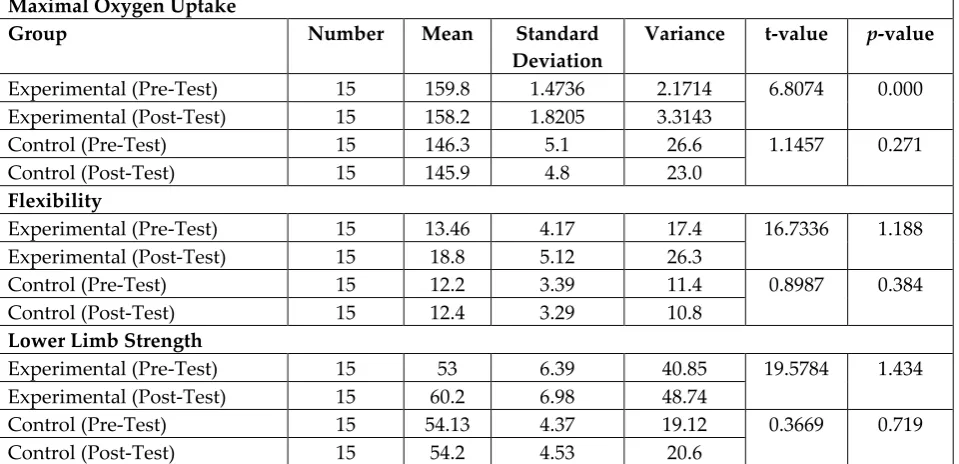
Table 2: Descriptive statistics (Mean & Standard Deviation) and paired sample t-test of Experimental Group (N1=15) and Control Group (N2=15)) for Maximal Oxygen Uptake,
Flexibility and Lower Limb Strength
Maximal Oxygen Uptake
Group Number Mean Standard
Deviation
Variance t-value p-value
Experimental (Pre-Test) 15 159.8 1.4736 2.1714 6.8074 0.000 Experimental (Post-Test) 15 158.2 1.8205 3.3143
Control (Pre-Test) 15 146.3 5.1 26.6 1.1457 0.271
Control (Post-Test) 15 145.9 4.8 23.0
Flexibility
Experimental (Pre-Test) 15 13.46 4.17 17.4 16.7336 1.188 Experimental (Post-Test) 15 18.8 5.12 26.3
Control (Pre-Test) 15 12.2 3.39 11.4 0.8987 0.384
Control (Post-Test) 15 12.4 3.29 10.8
Lower Limb Strength
Experimental (Pre-Test) 15 53 6.39 40.85 19.5784 1.434 Experimental (Post-Test) 15 60.2 6.98 48.74
Control (Pre-Test) 15 54.13 4.37 19.12 0.3669 0.719
Control (Post-Test) 15 54.2 4.53 20.6
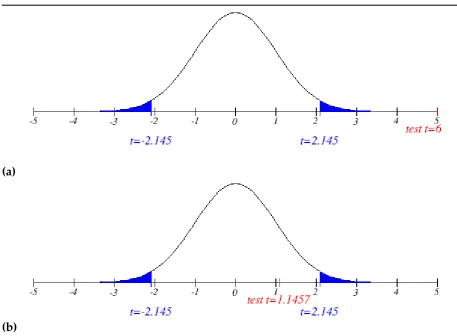
3.1 Maximal Oxygen Uptake
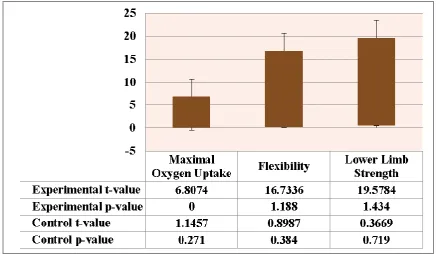
The results of Maximal Oxygen Uptake in group (Experimental) and group (Control) are shown in Table 2. The Mean and Standard Deviation values of Maximal Oxygen Uptake of Pre-Test and Post-Test of Experimental Group were 159.8±1.4736 and 158.2±1.8205 respectively. However, the Mean and Standard Deviation values of Maximal Oxygen Uptake of Pre-Test and Post-Test of Control Group were 146.3±5.1 and 145.9±4.8. The t-value in case of Experimental Group was 6.8074 and for Control Group it was 1.1457.
(a)
(b)
Figure 2: t-test and p-value for the Experimental (Pre-Test & Post-Test) and Control (Pre-Test & Post-Test) Groups on the variable Maximal Oxygen Uptake
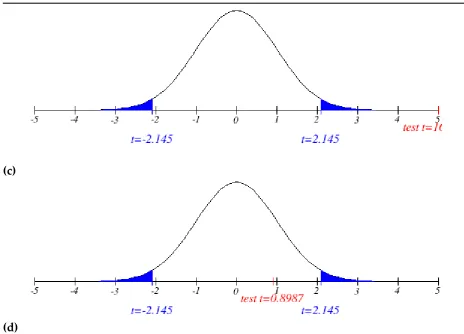
3.2 Flexibility
The results of Flexibility in group (Experimental) and group (Control) are shown in
Table 2. The Mean and Standard Deviation values of Flexibility of Pre-Test and
Post-Test of Experimental Group were 13.46±4.17 and 18.8±5.12 respectively. However, the
Mean and Standard Deviation values of Flexibility of Pre-Test and Post-Test of Control
Group were 12.2±3.39 and 12.4±3.29 respectively. The t-value in case of Experimental Group was 16.7336 and for Control Group it was 0.8987.
In group (Experimental) the calculated t exceeds the critical
(c)
(d)
Figure 3: t-test and p-value for the Experimental (Pre-Test & Post-Test) and Control (Pre-Test & Post-Test) Groups on the variable Flexibility
3.3 Lower Limb Strength
The results of Lower limb Strength in group (Experimental) and group (Control) are
shown in Table-2. The Mean and Standard Deviation values of Lower Limb Strength of Pre-Test and Post-Test of Experimental Group were 53±6.39 and 60.2±6.98 respectively.
However, the Mean and Standard Deviation values of Lower LimbStrengthof Pre-Test
and Post-Test of Control Group were 54.13±4.37and 54.2±4.53 respectively. The t-value in case of Experimental Group was 19.5784 and for Control Group it was 0.3669.
In group (Experimental) the calculated t exceeds the critical
(e)
(f)
Figure 4: t-test and p-value for the Experimental (Pre-Test & Post-Test) and Control (Pre-Test & Post-Test) Groups on the variable Lower Limb Strength
4. Discussion
This study explored the effects of 6-week core strengthening intervention on Maximal Oxygen Uptake, Flexibility and Lower limb Strength of University level Cyclists. Significant differences were found in Maximal Oxygen Uptake, Flexibility and Lower limb Strength in the Experimental Group subjected to 6-week core strengthening intervention. However, no significant changes were noted in the Control Group at the end of 6-week duration. The significant differences observed in the Experimental Group could be attributed to the effects of core strength training intervention administered to this group. Research has shown that core strength training provides a stable foundation for force generation in cyclists [29]. The greater stability of the lower limb is vital component for optimal athletic performance as well as it serves as an important tool in prevention and rehabilitation of injuries [30].
Sports scientists have shown that development of explosive power in the lower limbs of athletes is extremely important. Even those activities that are not directly related with vertical jump e.g. block in soccer; there also vertical jump test serves as an effective method of power and strength measurement and acts as an indirect indicator of sports performance [31, 32].
For success in sports, it is essential that athlete should have skill to produce greater amount of force in a short span of time. This ability is termed as explosive power/force. The vertical jump is an economical method for evaluation of lower limb strength. This method provides an insight into the current status of lower limb strength as well as for talent identification [33].
5. Conclusion
Based upon the findings it could be concluded that core strength training is an important method to enhance the physical conditioning parameters in athletes as observed in Experimental Group. Higher levels of core stability offers a platform for more force production in both upper and lower limbs [34]. The lower limb muscles generate or resist forces on the platform provided by the core. The core exercises result in increased sensitivity of muscle spindles which lead to a higher state of promptness to react to disturbing forces applied to the body. During training when the joint is exposed to destabilizing forces, stimulus thus may be given for growth of compensatory mechanisms. On the other side, the lack of core muscle conditioning may lead to faulty biomechanics and finally to injuries [35].
5.1 Practical Application
rehabilitation programs may be designed. Sports Physiotherapist, Sports physician, Coaches and Athletic Trainers may utilize the findings of the present study by preparing or modifying the existing training schedules for the Cyclists. The data
regarding Maximal Oxygen Uptake, Flexibility and Lower limb Strength variables will
help the coaches and trainers to regulate the training programme for the Cyclists.
Acknowledgement
The author thank the subjects whose participation made this study possible. I dedicate this study to God Almighty my creator, my strong pillar, my source of inspiration, wisdom, knowledge and understanding.
References
Stanton R., Reaburn P.R., Humphries B. (2004). The effect of shortterm Swiss ball training on core stability and running economy. J Strength Cond Res; 18 (3): 522-8.
Fig G. (2005). Sport-specific conditioning: strength training for swimmers - training the core. Strength Cond J; 27 (2): 40-2.
Akuthota V., Nadler S.F. (2004). Core strengthening. Arch Phys Med Rehabil; 85(3) (suppl 1): S86-S92.
Smith C.E., Nyland J., Caudill P., Brosky J., Caborn D.N. (2008). Dynamic trunk stabilization: a conceptual back injury prevention program for volleyball athletes. J Orthop Sports Phys Ther; 38: 703-720.
Liemohn W.P., Baumgartner T.A. (2005). Gagnon L.H. Measuring core stability. J Strength Cond Res; 19 (3):583-586.
Panjabi M.M. (2003). Clinical spinal instability and low back pain. J Electromyogr Kinesiol; 13:371-379.
Panjabi M.M. (1992). The stabilizing system of the spine. Part II. Neutral zone and instability hypothesis. J Spinal Disord; 5:390-396.
Willson J.D., Dougherty C.P., Ireland M.L., Davis I.M. (2005). Core stability and its relationship to lower extremity function and injury. J Am Acad Orthop Surg; 13:316-325.
Smeets R., Severens J.L., Beelen S., Vlaeyen J.W., Knottnerus J.A. (2009). More is not always better: Cost-effectiveness analysis of combined, single behavioral and single physical rehabilitation programs for chronic low back pain. Eur. J. Pain; 13: 71–81.
Wai E.K., Rodriguez S., Dagenais S., Hall H. (2008). Evidence informed management of chronic low back pain with physical activity, smoking cessation, and weight loss. Spine J; 8, 195–202.
Sasidharan T., Sonam S., Harilal B., Lende S. (2011). Effect of Core Stabilization Exercise on A Trunk Extensors Endurance Training Protocol. Int J Cur Res Rev; 03: 34-41. Heath G., Hagberg J., Ehsani A., Holloszy J. (1981). A physiological comparison of
young and older endurance athletes. J. Appl. Physiol; 51:634-640.
Fleg J., O'Connor F., Gerstenblith G., Becker L., Clulow J., Schulman S., Lakatta E. (1995). Impact of age on the cardiovascular response to dynamic upright exercise in healthy men and women. J. Appl. Physiol; 78:890-900.
Ogawa T., Spina R., Martin W., Kohrt W., Schechtman K., Holloszy J., Ehsani A. (1992). Effects of aging, sex and physical training on cardiovascular responses to exercise. Circulation; 86:494-503.
Rodeheffer R., Gerstenblith G., Becker L., Fleg J., Weisfeldt M., Lakatta E. (1984). Exercise cardiac output is maintained with advancing age in healthy human subjects: cardiac dilatation and increased stroke volume compensate for a diminished heart rate. Circulation; 69:203-213.
Stratton J., Levy W., Cerqueira M., Schwartz R., Abrass I. (1994). Cardiovascular responses to exercise effects of aging and exercise training in healthy men. Circulation; 89:1648-1655.
Iossifidou A., Baltzopoulos V., Giakas G. (2005). Isokinetic knee extension and vertical jumping: Are they related? Journal of Sports Sciences; 23(10): 1121 – 1127.
Malliou P., Ispirlidis I., Beneka A., Taxildaris K., Godolias G. (2003). Vertical Jump and Knee Extensors Isokinetic Performance in Professional Soccer Players Related to the Phase of Training Period. Isokinet Exerc Sci; 11: 165-169.
Socha T., Skowronek T., Socha S. (2006). Somatic and Functional Variables Determining Game Efficiency of Ice Hockey Players. J Hum Kinet; 15: 61-74.
MacDougall J.D. (1986). Adaptability of muscle to strength training-a cellular approach. In: Biochemistry of Exercise, Vol. 5, B. Saltin (Ed.). Champaign, IL: Human Kinetics; 501-513.
Bell R.D., Hoshizaki T.B. (1981). Relationships of age and sex with range of motion of seventeen joint actions in humans. Can. J. Appl. Sport Sci; 6:202-206.
Greey C.W. (1955). A Study of Flexibility in Selected Joints of Adult Males Ages 18-72. Doctoral dissertation, University of Michigan.
Jervey A. (1961). A Study of Flexibility of Selected Joints in Specified Groups of Adult Females. Doctoral dissertation, University of Michigan.
Mcardle W.D., Katch F.I., Pechar G.S., Jacobson L.O., Ruck S. (1972). Reliability and interrelationships between maximal oxygen intake, physical work capacity and step-test scores in college women. Medicine and science in sports. 1; 4 (4):182-6. American College of Sports Medicine (ACSM). (2012). ACSM's resource manual for
Sargent D.A. (1921). The physical test of man. American Physical Education Review; 26, 188-194.
Akuthota V., Ferreiro A., Moore T., Fredericson M. (2008). Core stability exercise principles. Curr. Sports Med; Rep Vol. 7, No. 1, pp. 39Y44.
Mellion M.B. (1994). Neck and back pain in bicycling. Clin. Sports Med; 13: 137–164. Kinzey, S.J. and Armstrong, C.W. (1998). The reliability of the star-excursion test in
assessing dynamic balance. J Orthop Sports Phys Ther ;27: 356– 360.
Garhammer J., Gregor R. (1992). Propulsion forces as a function of intensity for weightlifting and vertical jumping. Journal of Applied Sport Science Research; 6, 129-134.
Garhammer J. (1993). A review of power output studies of Olympic and power lifting: Methodology, performance prediction, and evaluation tests. Journal of Strength and Conditioning Research;7, 76-89.
Keir P., Jamnik V., Gledhill N. (2003). Technical-methodological report: A nomogram for peak leg power output in the vertical jump. J. Strength Cond; Res. 17:701–703. Willardson J.M. (2007). Core stability training: Applications to sports conditioning
programs. J. Strength Cond. Res; 21(3):979–985.
Creative Commons licensing terms