Proceedings of the
Fourth International Workshop on
Foundations and Techniques for
Open Source Software Certification
(OpenCert 2010)
GUI Inspection from Source Code Analysis
Jo˜ao Carlos Silva,Jos´e Creissac Jo˜ao Saraiva
18 pages
Guest Editors: Luis S. Barbosa, Antonio Cerone, Siraj A. Shaikh Managing Editors: Tiziana Margaria, Julia Padberg, Gabriele Taentzer
GUI Inspection from Source Code Analysis
Jo˜ao Carlos Silva1,2Jos´e Creissac1Jo˜ao Saraiva1
1Departamento de Inform´atica, Universidade do Minho, Braga, Portugal
2Departamento de Tecnologia, Instituto Polit´ecnico do C´avado e do Ave, Barcelos, Portugal
Abstract: Graphical user interfaces (GUIs) are critical components of todays
soft-ware. Given their increased relevance, correctness and usability of GUIs are becom-ing essential. This paper describes the latest results in the development of our tool to reverse engineer the GUI layer of interactive computing systems. We use static analysis techniques to generate models of the user interface behaviour from source code. Models help in graphical user interface inspection by allowing designers to concentrate on its more important aspects. One particular type of model that the tool is able to generate is state machines. The paper shows how graph theory can be useful when applied to these models. A number of metrics and algorithms are used in the analysis of aspects of the user interface’s quality. The ultimate goal of the tool is to enable analysis of interactive system through GUIs source code inspection.
Keywords: Source Code, Reverse Engineering, Graphical User Interface, Metrics,
Properties
1
Introduction
Typical WIMP-style (Windows, Icon, Mouse, and Pointer) user interfaces consist of a hierarchy of graphical widgets (buttons, menus, textfields, etc) creating a front-end to software systems. An event-based programming model is used to link the graphical objects to the rest of the system’s implementation. Each widget has a fixed set of properties and at any time during the execution of the GUI, these properties have discrete values, the set of which constitutes the state of the GUI. Users interact with the system by performing actions on the graphical user interface widgets. These, in turn, generate events at the software level, which are handled by appropriate listener methods.
In brief, and from a user’s perspective, graphical user interfaces accept as input a pre-defined set of user-generated events, and produce graphical output. From the programmers perspective, as user interfaces grow in size and complexity, they become a tangle of object and listener meth-ods, usually all having access to a common global state. Considering that the user interface layer of interactive systems is typically the one most prone to suffer changes, due to changed require-ments and added features, maintaining the user interface code can become a complex and error prone task. Integrated development environments (IDEs), while helpful in that they enable the graphical definition of the interface, are limited when it comes to the definition of the behavior of the interface
A source code analysis tool can minimize the time necessary by a developer to understand and evaluate a system. In this paper we present GUISurfer, a static analysis based retargetable
A bstract Syntax Tree Parser/Grammar GUI Intermediate Representation L an gu ag e d ep en de nt L an gu ag e i nd ep en de nt
GUI code slicing
Source code GUI layer Business layer
Data layer GUI model State M achine Event Flow Graph
Fil eP ars er. hs A stA na ly se r.h s G uiX .h s Sli cin gX .h s GUI analysis G ra ph .h s
Figure 1: GUISurfer Architecture and Retargetability
SCS06b,SCS09] we have explored the applicability of slicing techniques [Tip95] to our reverse engineering needs, and developed the building blocks for the approach. In this paper we explore the integration of analysis techniques into the approach, in order to reason about the GUI models.
2
GUISurfer tool
GUISurfer’s goal is to be able to extract a range of models from source code. In the present con-text we focus on finite state models that represent GUI behaviour. That is, when can a particular GUI event occur, which are the related conditions, which system actions are executed, or which GUI state is generated next. We choose this type of model in order to be able to reason about and test the dialogue supported by a given GUI implementation.
Figure 1 presents the architecture of the GUISurfer tool. GUIsurfer is composed by three
tools: FileParser, AstAnalyser, and Graph. These tools are configurable through command line parameters. Below we outline some of the more important parameters for each tool.
The FileParser tool is language dependent and is used to parse a particular source code file. For
example, the commandFileParser Login.javaallows us to parse a particular LoginJava class.
As a result, we obtain its AST.
The AstAnalyser tool is another language dependent tool used to slice an abstract syntax tree, considering only its graphical user interface layer. Part of this tool is easily retargetable, however most of the tool needs to be rewritten to consider another particular programming language.
syntax tree, the entry point in source code (e.g., the main method for Java source code), and
a list with all widgets to consider during the GUI slicing process. The commandAstAnalyser
Login.java.ast main JButtonlets us extract the GUI layer fromLogin.java’s abstract syntax tree,
starting the slice process at themainmethod, and extracting onlyJButtonrelated data. Executing
the command generates two files initState.gui and eventsFromInitState.gui which contain the
initial state and possible events from the initial states, respectively.
Finally, the Graph tool is language independent and receives as arguments the initState.gui
andeventsFromInitState.guifiles, and generates several metadata files with events, conditions, actions, and states extracted form source code. Each of these types of data is related to a par-ticular fragment from the AST. Further important outputs generated by the Graph tool are the
GuiModel.hs andGuiModelFull.hs files. These are GUI specifications written in the Haskell programming language. These specifications define the GUI layer mapping events/conditions to actions. Finally, this last tool allows us also to generate several visual models through the GraphViz tool, such as state machines, behavioral graph, etc.
3
GUI Inspection from source code
The evaluation of an user interface is a multifaceted problem. Besides the quality of the code by itself, we have to consider the user reaction to the interface. This involves issues such as satisfac-tion, learnability, and efficiency. The first item describes the users satisfaction with the systems. Learnability refers to the effort users make to learn how to use the application. Efficiency refers to how efficient the user can be when performing a task using the application.
Software metrics aim to measure software aspects, such as source lines of code, functions invocations, etc. By calculating metrics over the behavioral models produced by GUISurfer, we aim to acquire relevant knowledge about the dialogue induced by the interface, and, as a
consequence, about how users might react to it (c.f. [TG08]). In this section we describe several
kinds of inspections making use of metrics.
The analysis of source code can provide a mean to guide development and to certificate soft-ware. For that purpose adequate metrics must be specified and calculated. Metrics can be divided
into two groups: internal and external [ISO99].
External metrics are defined in relation to running software. In what concerns GUIs, external metrics can be used as usability indicators. They are often associated with the following attributes [Nie93]:
• Easy to learn: The user can do desired tasks easily without previous knowledge;
• Efficient to use: The user reaches a high productivity level.
• Easy to remember: The re-utilization of the system is possible without a high level of
effort.
• Few errors: Errors are made hardly by the users and the system permits to recover from
them.
However, the values for these metrics are not obtainable from source code analysis, rather through users’ feedback.
Internal metrics are obtained by source code analysis, and provide information to improve software development. A number of authors has looked at the relation between internal metrics and GUI quality.
Stamelos et al. [SAOB02] used the Logiscope1 tool to calculate values of selected metrics in
order to study the quality of Open Source code. Ten different metrics were used. The results enable evaluation of each function against four basic criteria: testability, simplicity, readability and self-descriptiveness. While the GUI layer was not specifically targeted in the analysis, the results indicated a negative correlation between component size and user satisfaction with the software.
Yoon and Yoon [YY07] developed quantitative metrics to support decision making during the
GUI design process. Their goal was to quantify the usability attributes of interaction design. Three internal metrics were proposed and defined as numerical values: complexity, inefficiency and incongruity. The authors expect that these metrics can be used to reduce the development cost of user interaction.
While the above approaches focus on calculating metrics over the code, Thimbleby and Gow
[TG08] calculate them over a model capturing the behavior of the application. Using graph
theory they analyze metrics related to the users’ ability to use the interface (e.g., strong connect-edness ensure no part of the interface ever becomes unreachable), the cost of erroneous actions (e.g., calculating the cost of undoing an action), or the knowledge needed to use the system (e.g., the minimum cut identifies the set of actions that the user must know in order to to be locked out of parts of the interface).
In a sense, by calculating the metrics over a model capturing GUI relevant information instead of over the code, the knowledge gained becomes closer to the type of knowledge obtained from external metrics. While Thimbleby and Gow manually develop their models from inspections of the running software/devices, an analogous approach can be carried out analyzing the models generated by GUISurfer. Indeed, by coupling this type of analysis with GUISurfer, we are able to obtain the knowledge directly from source code.
4
An Agenda application
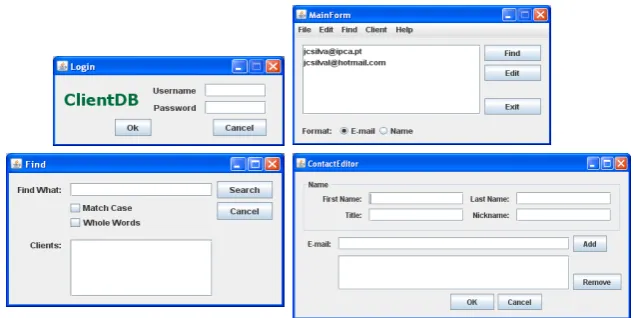
Throughout the paper we will use a Java/Swing interactive application as a running example. This application consist of an agenda of contacts: it allows users to perform the usual actions of adding, removing and editing contacts. Furthermore, it also allows users to find a contact through its name.
The interactive application consists of four windows, namely: Login, MainForm, Find and
ContactEditor, as shown in Figure2. The initial Loginwindow (Figure2, top-left) is used to control users’ access to the agenda. Thus, a login and password pair has to be introduced by the
user. If the user introduces a valid login/password pair, and presses theOkbutton, then the login
window closes and the main window of the application is displayed. On the contrary, if the user introduces an invalid login/password pair, then the input fields are cleared, a warning message is
Figure 2: A Java/Swing application
produced and the login window continues to be displayed. By pressing theCancelbutton in the
Loginwindow, the user exits the application.
The Java fragment defining the action performed when theOkbutton is pressed is as follows:
private void OkActionPerformed(...)
{if (isValid(user.getText(),pass.getText())) {new MainForm().setVisible(true);
this.dispose();}
else javax.swing.JOptionPane.showMessageDialog (this,"User/Pass not valid","Login",0); }
where the methodisValidtests the username/password pair inserted by the user.
Authorized users can use the main window (Figure2, top-right) to find and edit contacts (c.f.,
Find andEdit buttons). By pressing the Find button in the main window, the user opens the
Find window (Figure 2, bottom-left). This window is used to search and obtain a particular
contact’s data from his name. By pressing theEdit button in the main window, the user opens
the ContactEditor window (Figure 2, bottom-right). This last window allows the editing of
a contact’s data, such as name, nickname, e-mails, etc. TheAdd and Removebuttons enable
editing the e-mail addresses’ list of the contact. If there are no e-mails in the list then theRemove
button is automatically disabled.
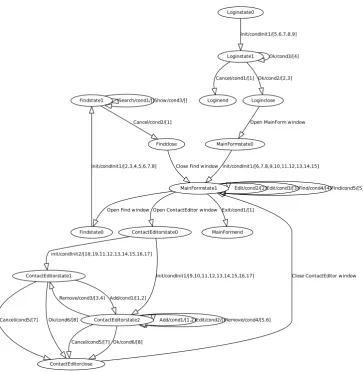
Until now, we have informally described the (behavioral) model of our interactive application. Such descriptions, however, can be ambiguous and often lead to different interpretation of what the application should do. In order to unambiguously and rigorously define an application, we can use a formal model. Moreover, by using a formal model to define the interactive application, we can use techniques to manipulate and inspect such application.
Figure3shows a formal model to specify the behavior of our running example: a graph. A
Search/cond1/[]Show/cond3/[]
Cancel/cond2/[1]
init/condInit1/[2,3,4,5,6,7,8] Close Find window
Add/cond1/[1,2]
Cancel/cond5/[7] Ok/cond6/[8] Remove/cond3/[3,4]
Edit/cond2/[]Remove/cond4/[5,6] Add/cond1/[1,2]
Cancel/cond5/[7] Ok/cond6/[8] init/condInit2/[18,19,11,12,13,14,15,16,17]
init/condInit1/[9,10,11,12,13,14,15,16,17] Close ContactEditor window Open Find window Open ContactEditor window
Edit/cond2/[2]Edit/cond3/[3]Find/cond4/[4]Find/cond5/[5]
Exit/cond1/[1]
init/condInit1/[6,7,8,9,10,11,12,13,14,15] Ok/cond3/[4]
Cancel/cond1/[1] Ok/cond2/[2,3] init/condInit1/[5,6,7,8,9]
Open MainForm window Findstate1
Findstate0
Findclose
ContactEditorstate1
ContactEditorstate2
ContactEditorstate0
ContactEditorclose
MainFormstate1
MainFormstate0
MainFormend Loginstate1 Loginstate0
Loginend Loginclose
collection of edges, where an edge is a pair (u,v) with u,v in V. Graphs are directed or undirected. In a directed graph, edges are ordered pairs, connecting a source vertex to a target vertex. In an undirected graph edges are unordered pairs of two vertices.
If some edge (u,v) is in graph, then vertex v is said to be adjacent to vertex u. In a directed graph, edge (u,v) is an out-edge of vertex u and an in-edge of vertex v. The number of out-edges of a vertex is its out-degree, and the number of in-edges is its in-degree.
A path is a sequence of edges in a graph such that the target vertex of each edge is the source vertex of the next edge in the sequence. If there is a path starting at vertex u and ending at vertex v we say that v is reachable from u.
Graphs are a commonly used to represent user interfaces. Vertices represent the possible GUI states, and the transitions between vertices (edges) define the events associated to the GUI objects.
The model in figure 3 was automatically extracted by GUIsurfer. Associated to each edge
there is a triplet representing the event that triggers the transition, a guard on that event (here represented by a label identifying the condition being used), and a list of interactive actions executed when the event is selected (each action is represented by a unique identifier which is related to the respective source code).
Using this model it becomes possible to reason about characteristics of the interaction between users and the agenda application.
5
GUI Inspection through Graph Theory
This section describes some examples of analysis performed on the Agenda application’s
be-havioral graph (cf. figure 3) from the previous section. We make use of Graph-Tool for the
manipulation and statistical analysis of the graph.
5.1 Graph-tool
Graph-tool is an efficient python module for manipulation and statistical analysis of graphs (cf. http://projects.forked.de/graph-tool/). It allows for the easy creation and manipulation of both directed or undirected graphs. Arbitrary information can be associated to the vertices, edges or even the graph itself, by means of property maps.
Graph-tool implements all sorts of algorithms, statistics and metrics over graphs, such as de-gree/property histogram, combined dede-gree/property histogram, vertex-vertex correlations, as-sortativity, average vertex-vertex shortest distance, isomorphism, minimum spanning tree, con-nected components, dominator tree, maximum flow, clustering coefficients, motif statistics,
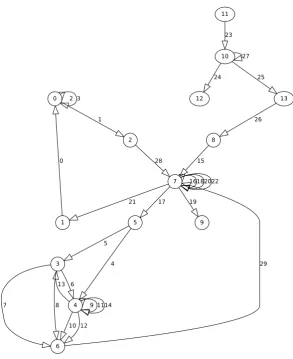
com-munities, centrality measures. Now we will consider the graph described in figure4
(automati-cally obtained from figure3) where all vertices and edges are labeled with unique identifiers.
5.2 GUI Metrics
2 3
1
0 28
6
7 8
13
9 1114
10 12 5
4 29
21 17
16182022
19 15
27
24 25
23
26 0
1
2
3
4
5
6
7
8
9 10 11
12 13
Figure 4: Agenda’s behavior graph (numbered)
5.2.1 Shortest Distance
The Graph-Tool enables us to calculate the shortest path between two vertices. As examples the
obtained results for the shortest path between vertices 11 and 6 is (cf. figure4):
shortest path vertices: [’11’,’10’,’13’,’8’,’7’,’5’,’4’,’6’] shortest path edges:
[’(11,10)’,’(10,13)’,’(13,8)’,’(8,7)’,’(7,5)’,’(5,4)’,’(4,6)’]
We obtain the vertices sequence from vertice 11 to vertice 6. And we have also access to the egdes sequence. This is usefull to calculate the number of steps to execute a particular task.
gives the distance from vertice 11 to a particular target vertice. The index of the value in the sequence correspond to the vertice identifier. As example the first value is the shortest distance from vertice 11 to vertice 0, which is 6 edges long.
shortest distance from Login [6 5 7 6 6 5 7 4 3 5 1 0 2 2]
Another example makes use of MainForm (vertice 7) as starting point. Negative values (-1) indicate that there are no paths from Mainform to those vertices.
shortest distance from MainForm [2 1 3 2 2 1 3 0 -1 1 -1 -1 -1 -1]
This metrics are useful to analyse the complexity of an interactive application’s user interface. Higher values represent complex tasks while lower values are applications with simple tasks. The example also shows that they can be used to detect parts of the interface that can become unavailable. In this case, there is no way to go back to the login window once the Main window is displayed. The application must be quit.
This metrics can be used to calculate the center of a graph. The center of a graph is the set of all vertices A where the greatest distance to other vertices B is minimal. The vertices in the center are called central points. Thus vertices in the center minimize the maximal distance from other points in the graph.
Finding the center of a graph is useful in GUI applications where the goal is to minimize the steps to execute a particular task (i.e. edges between two points). For example, placing the main window of an interactive system at a central point reduces the number of steps an user has to execute to accomplish tasks.
5.2.2 Pagerank
PageRank is a distribution used to represent the probability that a person randomly clicking on
links will arrive at any particular page [Ber05]. A probability is expressed as a numeric value
between 0 and 1. A 0.5 probability is commonly expressed as a ”50% chance” of something happening.
PageRank is a link analysis algorithm, used by the Google Internet search engine that assigns a numerical weighting to each element of a hyperlinked set of documents. The main objective is to measure their relative importance.
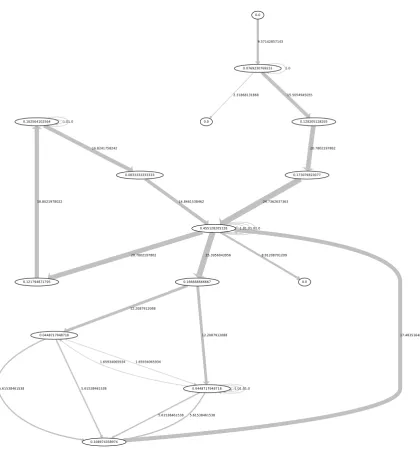
This same algorithm could be applied to our GUI’s behavioral graphs. Figure5gives pagerank
for each Agenda vertices. The size of a vertex corresponds to its importance within the overall application behavior. This metric is useful, for example, to analyze whether complexity is well distributed along the application behavior. In this case, the Main window is clearly a central point in the interaction.
5.2.3 Betweenness
Betweenness is a centrality measure of a vertex or a edge within a graph[Sa09]. Vertices that
Figure 5: Agenda’s pagerank results
path between two vertices. Edges that occur on many shortest paths between vertices have higher edge betweeness.
Figure6 describes betweeness values as a visual form for each Agenda vertices and egdes.
Highest betweeness edges values are related with largest edges.
The Main window has the highest betweenness, meaning it acts as a hub from where different parts of the interface can be reached. Clearly it will be a central point in the interaction.
5.2.4 Cyclomatic Complexity
Another important metric is cyclomatic complexity which aims to measures the total number of
decision logic in an application [J.76]. It is used to give the number of tests for software and to
keep software reliable, testable, and manageable. Cyclomatic complexity is based entirely on the
structure of software’s control flow graph and is defined asM=E−V+2P(considering single
exit statement) whereEis the number of edges,V is the number of vertices andPis the number
of connected components.
Considering the figure 5where edges represent decision logic in the Agenda GUI layer, the
1.01.0
16.8241758242
18.8021978022 14.8461538462
1.65934065934
5.61538461538 5.61538461538 1.65934065934
1.01.01.0
5.61538461538 5.61538461538 12.2087912088
12.2087912088 17.4835164835
20.7802197802 25.3956043956 1.01.01.01.0
8.91208791209 24.7362637363 1.0
2.31868131868 15.5054945055 9.57142857143
20.7802197802 0.102564102564
0.121794871795
0.0833333333333
0.0448717948718
0.0448717948718 0.166666666667
0.108974358974
0.455128205128
0.173076923077
0.0 0.0769230769231
0.0
0.0 0.128205128205
successfully as well. McCabe suggest limit greater than 10 for projects that have operational advantages over typical projects, for example formal design. User interfaces can apply the same limits of complexity, i.e. each window behavior complexity could be limited to a particular cyclomatic complexity.
5.3 GUI Test Cases Generation
Software testing is very important since it enables to evaluate a system by manual or automatic means and verify that it satisfies specified properties or identify differences between expected and actual results. Most approaches to software testing focus on the computational/algorithmic
aspects of the systems. In this section we use the models generated by GUIsurfer like figure3in
order to follow a model-based testing approach for GUI. Software testing is usally divided in two phases: test cases generation and properties verification. In this section we present our approach to these two tasks.
5.3.1 Related Work
The need for system reliability is the basis of research into the problem of GUI testing. The research aims to validate their correct functioning and to discover aspects of their behavior.
Having generated representations of GUI behavior, we are ready to define the coverage criteria for events and states. Considering test cases generation, some user behaviors will be more likely than other. Consequently if test cases are generated randomly then there is no guarantee that
interestingbehaviors will be tested.
To address this, several alternatives to generating test cases are proposed in the literature. As
example finite state machine (FSM) are used to model system and to generate test cases [SL89,
Ura92]. Test cases are generated from FSM-based specifications through several methods. These methods are: the Transition Tour (T) method; the Distinguishing Sequence (D) method; the Characterizing Set (W) method; the Unique Input/Output Sequence (UIO) method; the Single UIO (SUIO) method; and the Multiple UIO (MUIO) method.
All these methods need fully specified finite state machines, i.e. for each state and for each event, a unique transition must be defined (in some cases, null transitions). Fully specified state machines have the same set of inputs for each state. However, many graphical user interfaces
have different set of inputs for their states. Onetedioussolution is to add transitions that point
back to the same state with NULL output. Shehady has defined an alternative solution (VFSM -variable finite state machine) which is to have a conversion algorithm automatically add
transi-tions and NULL outputs when needed to fully specified finite state machine [SS97].
Another alternative is the use of graphs. Graphs have been widely used to model systems in diverse areas. Memon’s approach about coverage criteria for GUI testing make use of an event
flow graph for GUI’s behavioral representation [MSP01]. The paper describes a methodology
for generating test cases from GUI behavior graph-based specifications. Coverage criteria are presented to help determine whether a GUI has been adequately tested.
Ping Li describes an another approach to testing GUI systems in [LHRM07]. In the proposed
(relation-ships between the pre-conditions, event sequences and post-conditions). On the system tier, the components are integrated resulting in a view of the entire system. Finally, tests on the system tier analyse the interactions between the components.
5.3.2 Coverage Criteria
Because our GUI’s model representation can be viewed as a graph, we applied the Memon
approach about coverage criteria for GUI testing [MSP01]. In this section, we define several
coverage criteria for events and their interactions following Memon’s approach. We first formally define an event sequence, which is used to describe all the coverage criteria.
An event-sequence is a tuple<el,e2,e3, ...,en>whereeiis a particular event which can be
executed after eventei−1, 2≤i≤n.
Next we present three coverage criterion applied to GUI behavior graph-based specifications.
• Event Coverage: The event coverage criterion enables to capture a set of event-sequences
considering all possible events. The event coverage criterion is satisfied if and only if for
any evente, there is at least one event sequenceessuch thatescontainse.
• State Coverage: State coverage requires that each state is reached at least once, i.e. for any
statesthere is at least one event-sequenceessuch that statesis reached ines.
• Length-n-Event-sequence Coverage: Within GUI systems, the behavior of events may
change when executed in different contexts. The length-n-event-sequence coverage crite-rion define the set of event-sequences which contains all event-sequences of length equal
ton. As example the length-n-event-sequence coverage criterion applied to the Agenda’s
behavioral model in figure3returns the following number of test cases:
Length-n 1 2 3 4 5 6 7 8 9 10
Total 1 3 4 10 40 190 940 4690 23440 117190
Table 1: Total number of event-sequences fornevent-sequence length
The result of this criterion show that the total number of event sequences grows with increasing length. The large number of event sequences turns difficult to test a GUI for all possible event sequences. Memon proposes to assign priorities to each event-sequence and first test event-sequences with higher priorities. As example, event-sequences related with the main window could have a higher priority since they may be used more times.
A test suite is a set of input sequences starting from the initial state of the machine. Intuitively, if a test suite satisfies event coverage, it also satisfy state coverage. In other hand event coverage and state coverage are special case length-n-event-sequence coverage.
5.3.3 Chinese Postman Tour
The background of the Chinese Postman Problem is about a chinese postman who wishes to travel along every road in a city in order to deliver letters, while traveling the least possible distance. Solving the problem corresponds to finding the shortest route in a graph in which each
edge is traversed at least once [Thi03,PC05]. If the path must get back to the starting point, the
problem is said to be closed. If it does not need to go back, it is called an open problem.
The algorithm to solve the open problem can be used to generate minimal sequences of user actions between pairs of states, each sequence including all possible users actions in the interface. These sequences can then be used as test cases for testing the interface against defined properties. The length of the optimal path for the closed problem acts as a measure of the user interface’s
complexity [Thi03]. If we consider weighted graphs, and assign weights to the transitions that
correspond to the time users are expected to take performing the corresponding actions, then the optimal path for closed problem might be used to calculate how long a user takes to explore an entire application.
5.3.4 Travelling Salesman Problem
The Travelling Salesman Problem (TSP) considers a salesman whose task is to find a shortest possible tour that visits each city in a region exactly once. Even though the problem is computa-tionally difficult, a large number of exact methods and heuristics have been proposed, making it possible to solve instances with tens of thousands of cities.
While in the Chinese Postman Problem the goal is to traverse every edge at least once, in the Travelling Salesman Problem the goal is to visit every node. There is no need to use all edges in the graph. Paths produced as a solution to this problem will guarantee that all window states will be visited by the user, while keeping user actions to a minimum.
5.3.5 Properties Verification
The reverse engineering approach described in this paper allows us to extract GUI behaviour
model as graphs. Using these graphs, we are able to test GUI properties [Bel01,Bum96,Pat95].
Previous sections define alternatives to generate particular test cases. This section describes a study enabling us to validate random GUI test cases. To test GUI properties, we make use of the
QuickCheck haskelllibrary tool. QuickCheck [CH00] is a tool for testing programs automati-cally. The programmer provides a specification of the program and properties to satisfy. Then QuickCheck tests the properties in a large number of randomly generated cases. Specifications
are expressed inHaskell, using combinators defined in the QuickCheck library. QuickCheck
provides combinators to define properties, observe the distribution of test data, and define test data generators.
Considering the Agenda application above, and its GUI behavior graph expressed as a Haskell specification, we could now generate test cases now and write some properties and test them
through theQuickChecktool.
Test cases could be obtained through algorithms described in above subsections 5.3.2, 5.3.3
As example, through the Agenda’s test cases, we can define a property to check that from all states its possible to reach the central state with biggest pagerank value, i.e. state number 7 in
figure4. The respective QuickCheck property could be defined as follows:
rule1 (N (a,b)) =
classify ((length b)<=10) "events sequence length: <=10" $ classify ((length b)>10) "events sequence length: >10" $ (intersect [15,16,18,20,22,28,29] b) /= []
Parameters a and b defines a particular test case. The first parameter contains an events’s
identifiers sequence. The second parameter contains respective conditions’s identifier for each
event. Values 15, 16, 18, 20, 22, 28 and 29 refer to edges identifiers from figure4which have
central state number 7 as target. The property enables to check if all test cases contains at least one of these edges.
The number of randomly generated test cases and events length are specified by theGUIsurfer
user. Each random case is a sequence of valid events associated with their conditions.
6
Discussion
GUISurfer makes possible high-level graphical representation of thousand of lines of code. The process is almost automatic and enables reasoning over the interactive layer of computing sys-tems.
A particular emphasis is being placed on developing tools that are, as much as possible, lan-guage independent. Through the use of generic programming techniques, the developed tool aims at being retargetable to different user interface programming toolkits and languages. At this time, the tool supports (to varying degrees) the reverse-engineering of Java code, either with the Swing or the GWT (Google Web Toolkit) toolkits, and of Haskell code, using the wxHaskell GUI library. Originally the tool was developed for Java/Swing. The wxHaskell and GWT retar-gets have highlighted successes and problems with the initial approach. The amount adaptation and the time it took to code are distinct. The adaptation to GWT was easier because it exploits the same parser. The adaptation to wxHaskell was more complex as the programming paradigm is different, i.e. functional.
Using GUISurfer, programmers are able to reason about the interaction between users and a given system at a higher level of abstraction than that of code. The generated graphs are amenable
to analysis via model checking (c.f. [CH09]). Here however, we have explored alternative, lighter
weight approaches.
Considering that the graphs generated by the reverse engineering process are representations of the interaction between users and system, we have explored how metrics defined over those graphs can be used to obtain relevant information about the interaction. This means that we are able to analyze the quality of the user interface, from the users perspective, without having to resort to external metrics which would imply testing the system with real users, with all the costs that process carries. Additionally, we are exploring the possibility of analyzing the graphs via a testing approach, and how best to generate test cases.
It must be noted that, while the approach enables us to analyze aspects of user interface quality without resorting to human test subjects, the goal is not to replace user testing. Ultimately, only user testing will provide factual evidence of the usability of an user interface. The possibility of performing the type of analysis we are describing, however, will help in gaining a deeper under-standing of a given user interface. This will promote the identification of potential problems in the interface, and support the comparison of different interfaces, complementing and minimizing the need to resort to user testing.
Similarly, while the proposed metrics and analysis relate to the user interface that can be inferred from the code, the approach is not proposed as an alternative to actual code analysis. Metrics related to the quality of the code are relevant, and indeed GUISurfer is also able to generate models that capture information about the code itself. Again, we see the proposed approach as complementary to that style of analysis.
7
Conclusion
In what concerns user interface development, two perspectives on quality can be considered. Users, on the one hand, are typically interested on what can be called external quality: the quality of the interaction between users and system. Programmers, on the other hand, are typically more focused on the quality attributes of the code being produced.
This work is an approach to bridging this gap by allowing us to reason about GUI models from source code. We described GUI models extracted automatically from the code, and presented a methodology to reason about the user interface model. A number of metrics over the graphs representing the user interface were investigated. Some initial thoughts on testing the graph against desirable properties of the interface were also put forward.
A number of issues still needs addressing. In the example used throughout the paper, only one windows could be active at any given time (i.e., windows were modal). When non-modal windows are considered (i.e., when users are able to freely move between open application win-dows), nodes in the graph come to represents sets of open windows instead of a single active window. This creates problems with the interpretation of metrics that need further consideration. The problem is exacerbated when multiple windows of a given type are allowed (e.g., multiple editing windows).
criteria to help determine whether a GUI has been adequately tested. These coverage criteria use events and event sequences to specify a measure of test adequacy. Since the total number of permutations of event and condition sequences in any GUI is extremely large, the GUI’s hierarchical structure must be exploited to identify the important event sequences to be tested.
This work presents an approach to the reverse engineering of GUI applications. Models enable us to reason about both metrics of the design, and the quality of the implementation of that design. Our objective has been to investigate the feasibility of the approach. We believe this style of approach can feel a gap between the analysis of code quality via the use of metrics or other techniques, and usability analysis performed on a running system with actual users.
Acknowledgements: This work is supported by the Portuguese Research Foundation (FCT)
under contracts: PTDC/EIA-CCO/108995/2008, PTDC/EIA-CCO/108613/2008, and SFRH/ BSAD/782/2008.
Bibliography
[Bel01] F. Belli. Finite state testing and analysis of graphical user interfaces. In
Proceed-ings.of the 12th International Symposium on Software Reliability Engineering, IS-SRE 2001. Pp. 34–42. IEEE, November 2001.
[Ber05] P. Berkhin. A survey on pagerank computing.Internet Mathematics2:73–120, 2005.
[Bum96] P. Bumbulis.Combining Formal Techniques and Prototyping in User Interface
Con-struction and Verification. PhD thesis, University of Waterloo, 1996.
[CH00] K. Claessen, J. Hughes. QuickCheck: A Lightweight Tool for Random Testing of
Haskell Programs. InProceedings of International Conference on Functional
Pro-gramming (ICFP), ACM SIGPLAN, 2000. 2000.
[CH09] J. C. Campos, M. D. Harrison. Interaction engineering using the IVY tool. InACM
Symposium on Engineering Interactive Computing Systems (EICS 2009). Pp. 35–44. ACM, New York, NY, USA, 2009.
[ISO99] ISO/IEC. Software Products Evaluation. 1999. DIS 14598-1.
[J.76] M. T. J. A Complexity Measure.Intern. J. Syst. Sci.2(4):308, 1976.
[LHRM07] P. Li, T. Huynh, M. Reformat, J. Miller. A practical approach to testing GUI systems.
Empirical Softw. Engg.12(4):331–357, 2007.
[MSP01] A. M. Memon, M. L. Soffa, M. E. Pollack. Coverage criteria for GUI testing. In
ESEC/FSE-9: Proceedings of the 8th European software engineering conference held jointly with 9th ACM SIGSOFT international symposium on Foundations of software engineering. Pp. 256–267. ACM Press, New York, NY, USA, 2001.
[Pat95] F. D. Patern`o. A Method for Formal Specification and Verification of Interactive Systems. PhD thesis, Department of Computer Science, University of York, 1995. Available as Technical Report YCST 96/03.
[PC05] W. L. Pearn, W. C. Chiu. Approximate solutions for the maximum benefit Chinese
postman problem.Intern. J. Syst. Sci.36(13):815–822, 2005.
[Sa09] S. Y. Shan, et al. Fast Centrality Approximation in Modular Networks. 2009.
[SAOB02] I. Stamelos, L. Angelis, A. Oikonomou, G. L. Bleris. Code quality analysis in open
source software development.Information Systems Journal12:43–60, 2002.
[SCS06a] J. Silva, J. C. Campos, J. Saraiva. Combining Formal Methods and Functional
Strategies Regarding the Reverse Engineering of Interactive Applications. In
Inter-active Systems, Design, Specifications and Verification, Lecture Notes in Computer Science. DSV-IS 2006, the XIII International Workshop on Design, Specification and Verification of Interactive System, Dublin, Ireland. Pp. 137–150. Springer Berlin / Heidelberg, July 2006.
[SCS06b] J. Silva, J. C. Campos, J. Saraiva. Models for the Reverse Engineering of Java/Swing
Applications.ATEM 2006, 3rd International Workshop on Metamodels, Schemas,
Grammars and Ontologies for Reverse Engineering, Genova, Italy, October 2006.
[SCS09] J. Silva, J. C. Campos, J. Saraiva. A Generic Library for GUI Reasoning and Testing.
InIn ACM Symposium on Applied Computing. Pp. 121–128. March 2009.
[SL89] D. P. Sidhu, T.-k. Leung. Formal Methods for Protocol Testing: A Detailed Study.
IEEE Trans. Softw. Eng.15(4):413–426, 1989.
[SS97] R. K. Shehady, D. P. Siewiorek. A Method to Automate User Interface Testing
Us-ing Variable Finite State Machines. InFTCS ’97: Proceedings of the 27th
Interna-tional Symposium on Fault-Tolerant Computing (FTCS ’97). P. 80. IEEE Computer Society, Washington, DC, USA, 1997.
[TG08] H. Thimbleby, J. Gow. Applying Graph Theory to Interaction Design. Pp. 501–519,
2008.
[Thi03] H. Thimbleby. The directed chinese postman problem.In journal of Software
Prac-tice and Experience, 2003.
[Tip95] F. Tip. A Survey of Program Slicing Techniques. Journal of Programming
Lan-guages, september 1995.
[Ura92] H. Ural. Formal Methods For Test Sequence Generation. In Computer Comm.
Pp. 311–325. 1992.
[YY07] Y. S. Yoon, W. C. Yoon. Development of Quantitative Metrics to Support UI
De-signer Decision-Making in the Design Process. In Human-Computer Interaction.