Cover Page
The handle http://hdl.handle.net/1887/36426 holds various files of this Leiden University
dissertation
Author: Larios Vargas, Enrique
Title:
Design and development of a comprehensive data management platform for
cytomics : cytomicsDB
Design and development of a comprehensive
data management platform for Cytomics
∼
CytomicsDB
∼
The research developed in this thesis was performed at the Imaging and BioInformatics group (Leiden Institute of Advanced Computer Science), the Division of Toxicology (Leiden Academic Center for Drug Research) and with the support of the Database Architecture Group (Centrum Wiskunde&Informatica - Amsterdam), the Netherlands.
This research project has been supported by the BAPE program, EMECW Lot 18, Erasmus Mundus.
Design and development of a comprehensive data management platform for Cy-tomics: CytomicsDB
Cover design by: Terry Zabel
ISBN: 978-94-6259-950-5
Copyright © 2015 by Enrique Larios Vargas. All rights reserved. No part of this thesis may be reproduced or transmitted in any form, by any means, electronic or mechanical, without prior written permission from the author.
Design and development of a
comprehensive data management
platform for Cytomics: CytomicsDB
Proefschrift
ter verkrijging van
de graad van Doctor aan de Universiteit Leiden
op gezag van Rector Magnificus prof. mr. C.J.J.M. Stolker,
volgens besluit van het College voor Promoties
te verdedigen op woensdag 25 November 2015
klokke 10.00 uur
door
Enrique Larios Vargas
Samenstelling promotiecommissie:
promotor: prof. dr. J. N. Kok LIACS, Universiteit Leiden co-promotor: dr. Ir. F. J. Verbeek LIACS, Universiteit Leiden
overige leden: prof. dr. Lucie Kubínová Czech Academy of Sciences, Prague, Czech Republic
dr. Ying Zhang CWI, Amsterdam
I dedicate this thesis to my mother Luveslinda, for her sacrifices and her effort for giving me the best education and also to my five angels on heaven: Padre Vicente, Madre Teodora, my cousin Ivan, my father Paco and my grandmother
Table of Contents
Page
Contents 1
List of Figures 5
List of Tables 7
1 Introduction 9
1.1 Thesis scope . . . 9
1.2 HTS experiments workflow . . . 10
1.2.1 Experiment Design . . . 10
1.2.2 Wet-lab . . . 10
1.2.3 Image acquisition . . . 11
1.2.4 Image analysis . . . 12
1.2.5 Data analysis . . . 13
1.3 Data management in Cytomics . . . 14
1.3.1 Heterogeneity of data . . . 15
1.3.2 Data discovery . . . 16
1.3.3 Interoperability . . . 17
1.3.4 Understandability . . . 18
1.3.5 Data sharing and reusability . . . 18
1.3.6 Transport of data . . . 19
1.4 LIM Systems . . . 20
1.4.1 LIMS environment . . . 20
1.4.2 How a typical LIMS works . . . 21
1.4.3 Benefits of LIMS . . . 22
2 TABLE OF CONTENTS
2 CytomicsDB architecture 25
2.1 Introduction . . . 26
2.2 Automated Workflow of the HTS experiments . . . 27
2.2.1 Plate Layout Design Module . . . 28
2.2.2 Image Analysis Module . . . 28
2.2.3 Data Management Module . . . 31
2.2.4 Data and Pattern Analysis Module . . . 31
2.3 System Architecture of the HTS Analysis Platform . . . 32
2.3.1 The Presentation Layer . . . 32
2.3.2 The Service Layer . . . 32
2.3.3 The Persistence Layer . . . 33
2.3.4 The Repository Layer . . . 33
2.3.5 Flow of Control . . . 34
2.4 Database Design . . . 35
2.4.1 Users and Experiment Sets . . . 36
2.4.2 Plates and Wells . . . 37
2.4.3 Raw Images . . . 37
2.4.4 Results of Image Analysis . . . 38
2.4.5 Results of Data Analysis . . . 39
2.5 Related Work . . . 39
2.6 Conclusions and Future work . . . 40
3 Metadata Management 41 3.1 Introduction . . . 41
3.2 Metadata organization in an HTS experiment . . . 43
3.2.1 Project . . . 43
3.2.2 Experiment . . . 44
3.2.3 Plate-Wells . . . 44
3.2.4 Raw Images . . . 46
3.2.5 Measurements . . . 46
3.3 Case Study in Endocytosis of EGFR: Identification of EGFR dynamics and classification of EGFR phenotype stages . . . 47
3.3.1 Image Acquisition . . . 47
3.3.2 Image Analysis . . . 47
3.3.3 Data Analysis . . . 50
3.4 Related work . . . 50
3.5 Conclusions and Future Work . . . 52
4 Metadata Validation 53 4.1 Introduction . . . 53
4.2 Critical validation in an Automated HTS workflow . . . 54
TABLE OF CONTENTS 3
4.2.2 Image Acquisition . . . 55
4.3 Validation strategies . . . 55
4.3.1 Strategies and algorithms . . . 56
4.4 Implementation . . . 58
4.4.1 Validation subjects . . . 58
4.4.2 The validation workflow . . . 61
4.4.3 The architecture . . . 68
4.5 Analysis of conflict solving strategies . . . 72
4.5.1 Criterias for selecting a strategy . . . 72
4.5.2 Selection of strategies . . . 76
4.6 Conclusions and Future work . . . 78
5 Cluster Integration for Image processing and Pattern recognition 79 5.1 Introduction . . . 79
5.2 The Leiden Life Sciences Cluster . . . 80
5.3 Image Analysis . . . 81
5.4 Data Analysis and Pattern recognition . . . 82
5.5 Implementation . . . 83
5.5.1 The architecture . . . 83
5.5.2 The image and data analysis data flow . . . 86
5.5.3 Image Analysis setup and Results . . . 88
5.5.4 Data Analysis setup . . . 90
5.6 Conclusions and Future work . . . 92
6 Conclusions and Future work 93 6.1 Research questions and Problem statement . . . 93
6.1.1 Designing a software architecture for cytomics . . . 93
6.1.2 Adressing the metadata organization . . . 94
6.1.3 Metadata validation . . . 94
6.1.4 Speeding up data processing . . . 95
6.1.5 Adressing the Problem Statement . . . 95
6.2 Contributions . . . 96
6.3 Future work . . . 96
References 99
Summary 107
Samenvatting 109
List of Publications 113
List of Figures
1.1 Design of a 96 wells plate for an experiment using MCF7 wt cells . . . . 10
1.2 96 wells plate for HTS. . . 11
1.3 Microscopes for HTS. . . 12
1.4 Segmentation and subsequent image analysis . . . 13
1.5 Data analysis . . . 14
1.6 Hardware and Software components in an HTS workflow . . . 15
1.7 Data Lifecycle in a workflow . . . 16
1.8 Diagram of a tyical LIMS environment . . . 21
1.9 Sample work flow diagram . . . 22
2.1 Automated workflow of an HTS Experiment . . . 27
2.2 Web plate layout design GUI . . . 28
2.3 Image and coarse regions . . . 29
2.4 Using our image analysis solution, the phenotypic measurements of (a) live cells and (b) adhesion can be extracted . . . 29
2.5 Phenotypic characterization of the Epidermal Growth Factor (EGF) treat-ment using a highly aggressive cancer cell line, the illustrated features are picked by branch-and-bound feature selection. The EGF-treated cell group shows a significant increased migration velocity . . . 30
2.6 The HTS analysis platform architecture . . . 32
2.7 Flow of control of the HTS platform . . . 34
2.8 Database schema for Project Metadata . . . 35
2.9 Database schema for Experiment Metadata . . . 36
2.10 Database schema for Plate-Well Metadata . . . 36
2.11 Database schema for Raw Images and Measurement Metadata . . . 37
3.1 Structure of the metadata in an HTS experiment . . . 44
6 LIST OF FIGURES
3.3 Structure of the Raw Images metadata . . . 45
3.4 Structure of the Measurements metadata . . . 46
3.5 Web plate layout . . . 48
3.6 Example of set of images generated during the Image Analysis stage . . 49
4.1 Relationship between the entity, its attributes and fact values from data sources . . . 56
4.2 Get candidates . . . 62
4.3 Screening and Marking . . . 63
4.4 Clean up . . . 64
4.5 Update duplex marks . . . 65
4.6 Components diagram of the validation workflow . . . 69
4.7 Interfaces for validating a new siRNA entry . . . 70
4.8 Validation result interface . . . 70
5.1 CytomicsDB Architecture - Cluster Integration . . . 84
5.2 Web Interface for Analysis . . . 84
5.3 Image and Data analysis data flow . . . 87
5.4 Segmentation results using up to 24 nodes . . . 89
5.5 Partitioned concurrent tracking and join times . . . 90
List of Tables
4.1 Query result after checking forETOPOSIDEin the NCBI database. . . . 59
4.2 siRNA example provided by the researchers. . . 59
4.3 Query results from all external data sources. . . 60
4.4 Supported types of attributes in external Data Sources . . . 63
4.5 siRNA example uploaded by the user . . . 65
4.6 List obtained after first stage of siRNA validation . . . 66
4.7 List obtained after second stage of siRNA validation . . . 66
4.8 List of siRNAs candidates retrieved from the NCBI db. . . 67
4.9 Fourth step result - Matrix of similarities . . . 67
4.10 Functions used to implement each strategy . . . 72
4.11 Conflict handling functions and their applicable properties . . . 73
4.12 Strategies and Functions available for siRNAs and Compounds . . . 73
4.13 Strategies and their information availability . . . 74
4.14 Strategies and criterias . . . 78
Chapter
1
Introduction
In this chapter the thesis scope as well as the current key concepts related to this dissertation are introduced. In addition, the thesis structure is outlined.
1.1
Thesis scope
10 Introduction
1.2
HTS experiments workflow
In drug discovery, an HTS workflow is a sequence of operations and activities required to identify starting points for drug design or also called hits. These sequence consist of five stages: (YLL+11): (1)Experiment Design, (2)Wet-lab, (3)Image acquisition, (4)Image analysisand (5)Data analysis.
1.2.1
Experiment Design
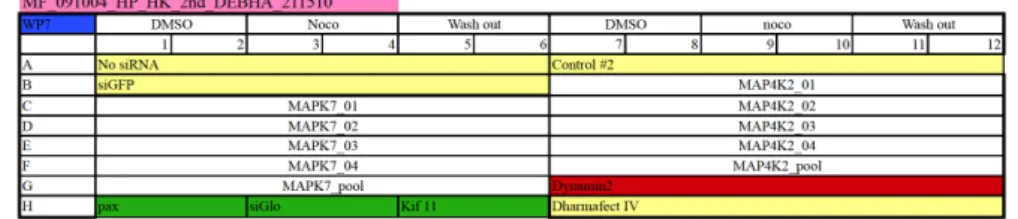
The key component in HTS is the “plate”; this is basically a small container that features a grid of wells and it is considered the principal information carrier of the experiment (c.f. 1.2). A spreadsheet application is used to create a layout of the plate in order to store practical information about the treatment introduced for each well in the cell culture plate. Figure 1.1 displays the design of a 96 well plate; details of the metadata are linked to each well therefore this is also called “plate design”. The “plate design” contains the input data for the plate e.g. metadata and allows to link the output of the plate e.g. image files. Figure 1.1 shows a brief description of the plate design. Wells are identified by a row from “A” to “H” and a column from “1” to “12”. A colour-coded notation in the plate design is used which facilitates the readability of the basic metadata linked to the experiment. For this experiment the MCF7 cell line is used and per well specific genes are switched off; i.e. knocked down, by the use of siRNA transfection which are represented by the not colour-coded wells. The negative controls are shown in light yellow, the positive control for transfection is in green, and the positive control for knockdown and the noco-assay is in red e.g. Dynamin2. The cells from wells B1 to B6 have been transfected with siGFP (light yellow). Wells B1 and B2 were additionally treated with DMSO while wells B3 and B4 have been treated with Nocodazole.
Figure 1.1:Design of a 96 wells plate for an experiment using MCF7 wt cells
1.2.2
Wet-lab
HTS experiments workflow 11
plate (c.f. 1.2). Plates for HTS can have either 24, 96, 384 wells, etc. i.e. multiples of 24. These wells will contain, depending on the type of experiment, culture medium and depending on the layout/design, some chemical compounds. These wells will also contain cell populations, and designed treatments are induced into them (YLL+11). Upon completion of the wet-lab procedure, the plate is prepared for the further readout during the image acquisition stage.
Figure 1.2:96 wells plate for HTS.
(Alv)
1.2.3
Image acquisition
In biomedical laboratories images are usually acquired by measuring photon flux in parallel, using a camera, or sequentially, using a point detector and equipment that scans the area of interest. However, capturing an image from a camera into the computer is straightforward, in most cases image acquisition needs to be tightly synchronized with other computer-controllable equipment such as shutters, filter wheels, x-y stages, z-axis focus drives and autofocus mechanisms; the controls for this are implemented in software and hardware. This automation is necessary to gather desired multiparametric information from a sample to allow the unattended acquisition of large numbers of images in time-lapse series, z-stacks, multiple spatial locations in a large sample or multiple samples in a large-scale experiment. Dedicated image acquisition software is therefore indispensable to communicate with these various components and coordinate their actions such that the hardware functions as quick and flawless as possible as well as allowing the researcher to easily execute the following sequence of acquisition events (EBG+12), i.e.:
1. Manual or automated acquisition.
12 Introduction
3. Single focal plane or three-dimensional stack.
4. Single channel, multiple channels or hyperspectral.
5. Acquisition protocol is predefined or determined on the fly based on analysis of image data.
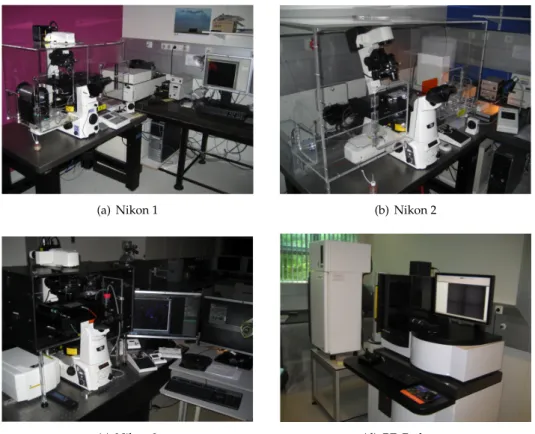
Figure 1.3 shows four different microscopes commonly used in Hight-Throughput Screening.
(a) Nikon 1 (b) Nikon 2
(c) Nikon 3 (d) BD Pathway
Figure 1.3:Microscopes for HTS.
(Tox)
1.2.4
Image analysis
HTS experiments workflow 13
thousands of images are collected by automated microscopy, whether for screening multiple samples, collecting time or z-series data, or other technologies that generate vast volumes of image data. In addition to image analysis in a high-throughput context, image analysis is important for many biological studies: for example, quantifying the amount and localization of a signaling protein, measuring changes in structures over time, tracking invading cancer cells or looking at nonspatial data such as fluorescence-lifetime data (Lak99). Image analysis facilitates data reduction and can help to ensure that results are accurate, objective and reproducible.
For instance, during the image analysis process, raw images from the image acqui-sition (c.f. 1.4(a)) stage are converted to auxiliary image results (c.f. 1.4(b) and 1.4(c)). Quality enhancing filters and segmentation algorithms are executed to extract region of interests (ROIs). Moreover, other types of processing based on ROIs such as object track-ing are also applied. For each image sequence, phenotypic measurements are gathered from ROIs and trajectories. Trajectories are not available for static images (YLL+11).
(a) Original image (b) Binary masks of (a) (c) Trajectories of (a)
Figure 1.4:Segmentation and subsequent image analysis
(YLL+11)
1.2.5
Data analysis
Eliceiri et. al. (EBG+12) conclude that the interpretation of the results from a high-content imaging application requires proper presentation and visualization of the image data. Many data display options are currently available according to the type of microscope used. Image analysis results can be displayed graphically as heat maps, line graphs, bar charts, dose response curves, or scatter plots e.g. (c.f. 1.5(a)) and 1.5(b)). In addition, to interpret data within a plate or set of plates at a glance, thumbnail images of the entire plate can also be displayed.
14 Introduction
each sample with control treatments that are carried out under the same condition but induce no change in the celullar process. Before “hits” are identified, quality control and data normalization are performed to remove systematic errors and to allow comparison and combination of samples from different plates (Di13).
(a) Cell migration (b) Structure dynamics
Figure 1.5:Data analysis
(YLL+11)
1.3
Data management in Cytomics
Finding “hits” contributes to identify targets for drugs.Drug discoveryhas a fundamen-tal intrinsic dedication in increasing the number of novel medicines. However, in order to accomplish this goal, high costs are involved from discovery through clinical trials to approval (SKE07). Thus, the requirements for a more sophisticated IT infrastructure used to assist the drug development process has been exponentially increased during the last decade. Cytomicsstudies introduce information related to the behaviour of the cell systems, exploiting this information is a key factor for the drug development process. High-Throughput Screening (HTS) is one of the most common techniques used inCytomics. In HTS the image dataset size per plate is approximately between 20Gb to 40Gb and depending on the type of experiment performed multiple plates can be used in one experiment and the number of images generated can reach around 100000 images per plate. The large volume of data generated in these experiments make its management a challenge and a necessity.
The current data management challenges inCytomicscan be summarized as follow-ing categories: (1)Heterogeneity of the data, (2)Data exploration, (3)Interoperability, (4)
Data management in Cytomics 15
1.3.1
Heterogeneity of data
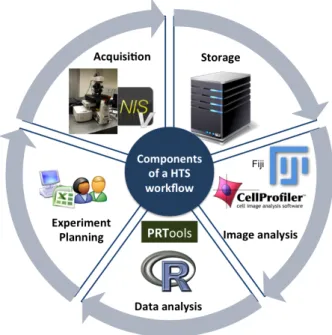
In HTS experiments the diversity of data is one of the main issues to be tackled for the cytomics-based systems. The variety in the data is a consequence of the diversity of harware and software components involved in HTS (c.f.1.6). A summary of these components are:
Figure 1.6:Hardware and Software components in an HTS workflow
Types of microscope. In modern biology, one of the most basic tools is the visual inspection of cells using a microscope and in modern optical microscopy for HTS is commonly used the following types of microscope: (1) Confocal microscopes, (2) Mul-tiphoton microscopes (3) Multispectral microscopes and (4) Fluorescence microscopes. Each one managing different type of variables and parameters.
Image formats. The different types of microscopes have different file formats asso-ciated with them. This means that metadata is sometimes only available in propietary format. Consequently the image files generated will use a propietary format as well. However, these propietary software also includes plugins or tools for exporting or visualizing the images using more standarized format conventions e.g. tiff files.
16 Introduction
analysis performed, for instance plain text files or binary data.
Spreadsheet applications. Spreadsheet applications are still very commonly used by biologist in the HTS workflow for bookkeping metadata related to the design of the experiment. The use of this type of applications have many drawbacks such as: susceptible to errors, difficult to maintain, limited security and accesibility, not shareable, and not suitable for querying.
Legacy systems. In the research groups, there are usually other systems which play a role in the management of laboratory data or other repositories which store logistic information of chemicals, compounds, or other components required in the lab. These systems work most of the time independent of the HTS workflow but the information contained needs to be synchronized with the experiment pipeline.
1.3.2
Data discovery
The drug discovery and development process depend on informed decision making. A Cytomics platform needs to increase the quality and pertinence of information for that decision-making process (SKE07). Therefore, identifying the location of mean-ingful data in the large datasets generated in HTS experiments is the most important challenge.
Figure 1.7:Data Lifecycle in a workflow
(DC08)
Data management in Cytomics 17
systems, to research in bioinformatics, proteomics and pharmacogenetics (HT03). Hey et. al. address the imminent flood of scientific data expected from the next generation of experiments and the critical needs for analytical tools capable of exploiting and automating the process of going from raw data to information to knowledge.
Deelman et. al. (DC08) present from the point of view of data, the lifecycle in a workflow for e-Science expressed in four transformations. This includes the following transformations (c.f. 1.7):
1. Data discovery.
2. Setting up the data processing pipeline.
3. Generation of derived data.
4. Archiving of derived data and its provenance.
Data analysis is often a collaborative process or is conducted within the context of a scientific collaboration. Data discovery is highlighted due to the fact that scientists in a collaboration frequently submit workflows to process datasets and derive scientific knowledge. These collaborators may submit related workflows and build upon earlier work by other scientists. Thus, scientists need to be able to discover information about workflows that have been executed in the past, identify datasets of interest, and locate analysis code and workflow templates.
1.3.3
Interoperability
Interoperability represents the posibility to exchange information between repositories. Additionally, interoperability is a domain specific concept and the heterogeneity of ICT implementations is such that there exist different solution spaces depending on the combination of existing systems and in many cases such solutions are not directly transferable to other cases (Kos06). According to Chen and Doumeingts (CDV08), interoperability has the meaning of coexistence, and autonomy. If systems are interop-erable, this mean that their components are connected by a communication network and can interact; they can exchange services while continuing locally their own logics of operation.
Each of the various types of data handled in the drug discovery process poses its own specific problems for integration into the information systems and decision-making processes (SKE07). The role of standards is thereby becoming crucial. Stan-darization processes should be present in each stage of the scientific data lifecycle.
18 Introduction
create standards to represent scientific data such as data models and standards for query languages.
Developing comprehensive approaches is complex because data interoperability is a problem that goes beyond technical aspects. Data interoperability approaches, in order to be complete, should reconcile all the differences arising between data providers and data consumers with respect to organizational, semantic, and technical characteristics governing their “exchange” of data. The majority of existing solutions focus on technical aspects only with very limited efforts and guidelines being oriented to reconcile differences at the organizational level, probably because this domain presents more complexities than others do (PCC13).
1.3.4
Understandability
In e-Science, the capability of the user to understand the information or knowledge contained in the large repositories generated by each experiment is becoming a crit-ical issue. An HTS dataset is very complex. Therefore there is a huge challenge in organizing all this information so that it remains interpretable. With respect to the mass of data produced, we do not believe that a solution is solely linking together databases containing all the screening, laboratory testing, and chemical information. The scientists whose collaborative work build the “road to the lead” need to efficiently communicate. Only clear-cut analyses at each stage can optimize the process and facilitate such communication (Hey02).
The approach proposed by Heyse et. al. (Hey02) consist of: (1) perform thorough quality control to include only reliable data in further processing stages, (2) standardize, process, condense, and annotate data at each stage as much as needed by the respective experts involved, (3) keep data related to its context using metadata on assays, analyses, and compounds, and (4) provide tools to analyze and interpret large datasets following statistical and biophysical models and standard processes. This makes the overall screening process transparent and traceable.
1.3.5
Data sharing and reusability
Demchenko et. al. (DGDLM13) emphasize that the emergence of computer aided research methods is transforming the way how research is done and scientific data are used. Four types of scientific data are defined:
• Raw data collected from observations and from experiments according to an initial research method.
• Structured data and datasets that have gone through data filtering and processing.
Data management in Cytomics 19
• Data linked to publications to support the wide research consolidation, integra-tion and openness.
Collaboration is possible thanks to the contribution of new results as a consequence of the validation performed by scientists after scientific data has been published. Col-lecting information about the processes involved in the transformation of raw data to published data becomes an extremely important aspect of scientific data management.
There is a close link between interoperability and collaboration. The interoperability achieved by the use of standards for the metadata in HTS experiments, facilitates the understandability, discoverability and thus promotes the collaboration among scientists. Reseachers will be able to improve their contributions thanks to the use of domain-specific metadata information standards.
Reusability of published data within the scientific community is still another aspect to take into consideration. Understandability of the semantics of published data is a key factor for reusability and this has been done manually. However, given the volume of the data, this becomes, so far, impractical in the scale of Big Data science.
1.3.6
Transport of data
Kaisler et. al. (KAEM13) describe the storage and transport issues for big data. Current disk technology limits are about 4 terabytes per disk. So, 1 exabyte would require 25,000 disks. Even if an exabyte of data could be processed on a single computer system, the current systems do not allow to directly attach the requisite number of disks. Access to those data would overwhelm current communication networks. Assuming that a 1 gigabyte per second network has an effective sustainable transfer rate of 80%, the sustainable bandwidth is about 100 megabytes. Thus, transferring an exabyte would take about 116 days, if we assume that a sustained transfer could be maintained. It would take longer to transmit the data from a collection or storage point to a processing point than it would to actually process it.
Two solutions manifest themselves. First, process the data “in place” and transmit only the resulting information. In other words, “bring the code to the data", vs. the traditional method of “bring the data to the code." Second, perform triage on the data and transmit only that data which is critical to the downstream analysis. In either case, integrity and provenance metadata should be transmitted along with the actual data, this will ensure traceability and validation of the data before the processing stage.
20 Introduction
1.4
LIM Systems
A typical approach to the management of large volume of data in a laboratory is a Laboratory Information Management System (LIMS). LIMS is a computer application designed for the analytical laboratory that is designed to administer samples, acquire and manipulate data, and report results via a database. It automates the process of sampling, analysis and reporting (Mah91) (DAJ12).
A more complete definition is provided by Skobelev et. al. (SZK+11), Laboratory information management systems belong to the class of application software intended for storage and management of information obtained in the course of the work of the laboratory. The systems are used to control and manage samples, standards, test results, reports, laboratory staff, instruments, and work flow automation. Integration of laboratory information management systems with the enterprise’s information systems will make it possible to promptly transmit required data to the laboratory and the enterprise administration.
High-throughput screening (HTS) due to the overwhelming amounts of data is pushing forward the need for sophisticated IT infrastructure in order to enhance the laboratory performance. LIM systems have been designed as a first step to face this dilemma. However, the continuous progress in tools, hardware, and heterogeneity of the components involved in HTS make still difficult to completely tackle this problem.
Under the term Laboratory Information Management System, industry-related IT solutions for research, development, service, and production in the fields of chemistry, biology, environmental protection, or medicine are combined. The interdisciplinary object of the life sciences meanwhile characterizes a broad, large class of laboratory information management systems and offers a potential for new general system con-cepts in laboratory automation before the background of innovative Internet technolo-gies (TGDS04) (AMF00).
Figure 1.9 (DAJ12) describes how LIMS assist laboratories in tracking and managing its information resources, particularly the data that represents the laboratory product.
LIMS has contributed in improving the administration of labs data from the perpec-tive of a production environment. However, with respect to the research environment, LIMS has limitations such as: (1) dealing with unstructured data, (2) ensure interop-erability between components in an HTS environment, (3) facilitate experiment data sharing and (4) promote reusability.
1.4.1
LIMS environment
A LIMS is more complex than just a single application and it is better to consider the term environment to specify the set of elements who interact within a laboratory. These elements are shown in Figure 1.8 (DAJ12), i.e:
LIM Systems 21
Figure 1.8:Diagram of a tyical LIMS environment
(DAJ12)
2. Data Analysis tools interfaced directly with the LIMS.
3. Legacy systems and computer systems interfaced with the LIMS.
4. Applications external to the laboratory that are also interfaced to the LIMS e.g. an enterprise resource planning system.
1.4.2
How a typical LIMS works
The LIMS is in charge of the analysis and distribution of the data generated in the laboratory. It becomes the single point of interaction between the data and the different tools and systems used in the laboratory. The data is stored in a single repository and this allows to centralize its flow and access through the organization (DAJ12).
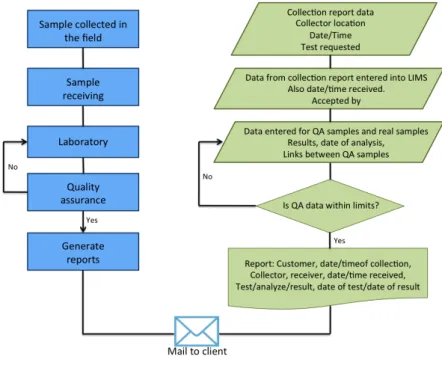
Once the sample is logged into the LIMS package, it automatically takes over the further operations and generates the work sheet/protocol sheet/analytical work record. The workflow contains all the diagnostics required to be carried out for the sample (Figure 1.9).
While carrying out the actual testing, the readings and observations are noted down in the workflow. After completing the diagnostics all data are fed into the LIMS package. It automatically calculates the results, compares the findings with the standards, and also decides about the compliance with the standards. After this it prints out the certificate of analysis in the prescribed format that is already fed into the software.
22 Introduction
required inputs (readings/observations); the desired output format can be selected, and results can be generated in desired options without giving any external formulae for calculation (KGG10).
Figure 1.9:Sample work flow diagram
(DAJ12)
1.4.3
Benefits of LIMS
A LIMS provides benefits for many of the users of a laboratory. However, a LIMS does represent an expense that must be considered. This expense will almost certainly have to be justified by a level of higher management. The following is a brief outline of several of the main benefits identified and realized from current users of LIMS (DAJ12).
1. Information can be obtained with the click of a button rather than having to dig through files.
2. Years of data can be kept easily without the need for traditional archiving.
3. The improvement of business efficiency.
4. Improvement of data quality (all the instruments are integrated).
Thesis structure 23
6. Automated customer reports (Turnaround Time, Work Load).
7. Automated Integration of Hand-held LIMS devices.
8. Automated Quality Control.
9. Daily Quality Reports.
10. Easily accessible data via the web.
LIMS is a useful tool to manage structured information produced in the laboratory. However, an HTS environment is constantly changing due to the diversity of tech-nologies involved which produce continuosly more volume of data. Current datasets generated in HTS are commonly unstructured and not suitable for being stored in a rigid database system. The need to align research data to the FAIR paradigm force the urgent need to design new software architectures which are able to integrate the benefits of LIMS with platforms capable to manage unstructured data in Cytomics.
1.5
Thesis structure
This thesis consists of six chapters: (1)Introduction, (2)CytomicsDB architecture, (3)
Metadata management, (4)Metadata Validation, (5)Cluster Integrationand (6)Conclusion and Discussion.
Chapter 1introduces the scope of thesis as well as its background. In addition, here we review the existing challenges in the management of large volumes of data in Cytomics. Thereafter, the lab management systems that currently manage lab data and their issues for dealing with high-throughput data is briefly described. Moreover, the typical workflow in High-Throughput Screening (HTS) experiments is presented.
Chapter 2describes our research in developing CytomicsDB, a modern RDBMS based platform, designed to provide an architecture capable of dealing with the com-putational requirements involved in high-throughput content.
Chapter 3introduces a semantic approach for organizing the metadata involved in High-Throughput Screening experiments. The main goal is to facilitate the exploration process in the HTS workflow, scientists are aware of semantics and they are pushing forward the need for new approaches in organizing the metadata according to which queries are mostly applied on the scientific data.
Chapter 4 provides a semantic-based metadata validation approach applied in CytomicsDB. The objective is to ensure the integrity, consistency and reliability of the data stored in the platform. This is a critical requirement for image and data analysis and further data exploration of the experiment‘s results.
24 Introduction
Chapter
2
CytomicsDB architecture
In this chapter, we propose a platform for managing and analyzing HTS images resulting from cytomics screens taking the automated HTS workflow as a starting point. This platform seamlessly integrates the whole HTS workflow into a single system. The platform relies on a modern relational database system to store user data and process user requests, while providing a convenient web interface to end-users. By implementing this platform, the overall workload of HTS experiments, from experiment design to data analysis, is reduced significantly. Additionally, the platform provides the potential for data integration to accomplish genotype-to-phenotype modeling studies.
This chapter is based on the following publications:
• K. Yan, E. Larios, S. LeDévédec, B. van de Water and F. J. Verbeek. Automa-tion in cytomics: Systematic soluAutoma-tion for image analysis and management in high throughput sequences. In Proceedings IEEE Conf. Engineering and Technology (CET 2011), volume 7, pages 195–198. 2011.
• E. Larios, Y. Zhang, K. Yan, Z. Di, S. LeDévédec, F. Groffen, and F.J. Verbeek.
26 CytomicsDB architecture
2.1
Introduction
Recent developments in microscopy technology allows various cell and structure phe-notypes to be visualized using genetic engineering. With a time-lapse image-acquisition approach, dynamic activities such as cell migration can be captured and analyzed. When performed in large-scale via robotics, such approach is often referred to as a High-Throughput Screening (HTS). At the work floor this is often called “screen”. In cytometry, HTS experiments, at both cellular and structural level, are widely employed in functional analysis of chemical compounds, antibodies and genes. With automated image analysis, a quantification of cell activity can be extracted from HTS experiments. In this manner, biological hypothesis or diagnostic testing can be verified via machine learning using the results from the image analysis. HTS experiments, supported by automated image analysis and data analysis, can depict an objective understanding of the cell response to various treatments or exposures.
In this chapter, we set our scope to the bioinformatics aspects of HTS. An HTS experiment starts with the design of a culture plate layout containingN×Mwells in
which the cells are kept, cultured and to which experimental conditions are applied. The response of the cells is then recorded through time-lapse (microscopy) imaging and the resulting time-lapse image sequence is the basis for the image analysis. The design of the plate layout is a repository of the experiment as a whole. From a study of the workflow of biologists, we have established an HTS workflow system.
Currently, spreadsheet applications are commonly used for bookkeeping the infor-mation generated during the workflow of HTS experiments. This approach has many drawbacks. It usually takes months to finish a complete experiment, i.e., from the plate design to the data analysis. Furthermore, images produced by the HTS experiments are not linked properly with their metadata and the analysis results. This scenario makes it difficult to do a proper knowledge discovery. So, most of the process within the workflow of HTS experiments are developed manually, which is highly prone to man made errors. Moreover, spreadsheets often differ in format and are not stored in a central place. This makes it hard for scientists from even the same institute to search, let alone to disclose their results in a uniform and efficient way.
To eventually tackle all these issues, we propose anHTS platformfor managing and analysing cytomic images produced by HTS experiments. The platform seamlessly integrates the whole HTS workflow into a single system and provides end-users a convenient GUI to interact with the system. The platform consists of a layered architecture. First, an end-user layer that is responsible for the interaction with the scientists who perform different HTS experiments in cytomics. Then, the middleware layer that is responsible of the management of secure and reliable communication among the different components in the platform. Finally, a database-computational layer, in charge of the repository and execution of the image and data analysis.
Automated Workflow of the HTS experiments 27
experiments, from experiment design to data analysis, is reduced significantly. This is because, among others, in the HTS platform, the design of plate layout is done automatically. Using spreadsheets, it takes an experienced biologist one week to manually finish the mapping of 400-600 gene targets, while it takes less than a day to use the plate design module in the HTS system. It also enables queries over datasets of multiple experiments. Thus, automation in cytomics provides a robust environment for HTS experiments. To sum up, the contributions of this work include:
1. Establishing a workflow system of the HTS experiments (Section 2.2).
2. An integrated platform to automate data management and image analysis of cytomic HTS experiments (Section 2.3).
3. The design of the database to store (almost) all data produced and used in the HTS experiments (Section 2.4).
Finally, we discuss related work in Section 2.5 and conclude in Section 2.6.
Figure 2.1:Automated workflow of an HTS Experiment
2.2
Automated Workflow of the HTS experiments
28 CytomicsDB architecture
2.2.1
Plate Layout Design Module
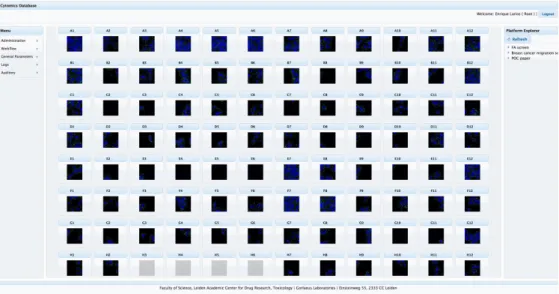
The design of a plate is considered as the cornerstone for an HTS experiment. Therefore, we have developed a Graphical User Interface (GUI) in our HTS platform to construct the layout for a plate (see Figure 2.2). The GUI allows end-users to rapidly deploy, modify and search through plate designs, to which auxiliary data such as experimental protocols, images, analysis result and supplementary literature is attached. In addition, the plate design provides a fast cross-reference mechanism in comparing data from various origins. This module is also used as the front end for the visualisation of results such as using heat maps, cell detection or motion trajectories.
Figure 2.2:Web plate layout design GUI
2.2.2
Image Analysis Module
Automated Workflow of the HTS experiments 29 Pseudo Code 1: Watershed Masked Clustering Algorithm
Perform maxima-seeded watershed segmentation Reverse watershed line into coarse region
for each coarse region rdo
Perform weighted fuzzy C-mean clustering in intensity space I of r
Obtain labeling Create regional mask
end for
Combine regional mask into final object label
(a) Image is divided into several coarse regions
(b) The intensity histogram of the
whole image (c) The intensity histogram of one random coarse region Figure 4. Image and coarse regions
The tracking of objects is accomplished by a customized algorithms deployed in the image analysis package. The fundamental principle behind this tracking algorithm is to estimate the minimum mean shift vector based on given model [1][3].
(a) Cell tracking results (b) Adhesion tacking results Figure 5. Using our image analysis solution, the phenotypic measurements of (a) live cells and (b) adhesion can be extracted.
With the binary masks and trajectories information obtained from image analysis, several phenotypic measurements are extracted for each object. Using state-of-art pattern recognition and statistical analysis, the effect of chemical compound can be easily quantified and compared (cf. Fig. 6). Depending on experiment setting, our package may employ up to 31 phenotypic measurements during the analysis.
Figure 6. Phenotypic characterization of the epidermal growth factor (EGF) treatment using a highly aggressive cancer cell line, the illustrated features are picked by branch-&-bound feature selection. The EGF-treated cell group shows a significant increased migration velocity while the extension
This module is designed as web service API. As the image analysis computation requires large image volumes to be processed, GRID computing is used to obtain results in reasonable time.
C. Image Data Management System
In cytomics, the amount of image data can easily exceed the terabyte-scale. The organization and storage of large volume data is therefore nontrivial. The accessibility of large volume image data already poses an obstacle in the current stage. Unlike other high-content data type such as video streams, bio-image data require a complete error-free quality during transportation. Uncorrected errors are potentially catastrophic as consequences may be accumulated into subsequent stages. In a multiuser environment, the data flow also faces a high-concurrency environment. The database becomes a bottleneck that must handle high concurrency because of the large number of images that are used in the analysis phase.
The platform uses an XML supported database (Oracle) to store all the information related to the metadata of the experiments, measurements and analysis results. This information is hierarchically organized in the XML format, which facilitates the integration with other legacy systems such as the Image Analysis API, Cyttron API [5], File Servers, etc. The platform provides access to the data stored through web services which use XQuery to retrieve particular information requested by the End-user GUI.
Figure 2.3:Image and coarse regions
(CYW+11)
Pseudo Code 1: Watershed Masked Clustering Algorithm Perform maxima-seeded watershed segmentation Reverse watershed line into coarse region
for each coarse region r do
Perform weighted fuzzy C-mean clustering in intensity space I of r
Obtain labeling Create regional mask end for
Combine regional mask into final object label
(a) Image is divided into several coarse regions
(b) The intensity histogram of the
whole image (c) The intensity histogram of one random coarse region
Figure 4. Image and coarse regions
The tracking of objects is accomplished by a customized algorithms deployed in the image analysis package. The fundamental principle behind this tracking algorithm is to estimate the minimum mean shift vector based on given model [1][3].
(a) Cell tracking results (b) Adhesion tacking results
Figure 5. Using our image analysis solution, the phenotypic measurements of (a) live cells and (b) adhesion can be extracted.
With the binary masks and trajectories information obtained from image analysis, several phenotypic measurements are extracted for each object. Using state-of-art pattern recognition and statistical analysis, the effect of chemical compound can be easily quantified and compared (cf. Fig. 6). Depending on experiment setting, our package may employ up to 31 phenotypic measurements during the analysis.
Figure 6. Phenotypic characterization of the epidermal growth factor (EGF) treatment using a highly aggressive cancer cell line, the illustrated features are picked by branch-&-bound feature selection. The EGF-treated cell group shows a significant increased migration velocity while the extension
This module is designed as web service API. As the image analysis computation requires large image volumes to be processed, GRID computing is used to obtain results in reasonable time.
C. Image Data Management System
In cytomics, the amount of image data can easily exceed the terabyte-scale. The organization and storage of large volume data is therefore nontrivial. The accessibility of large volume image data already poses an obstacle in the current stage. Unlike other high-content data type such as video streams, bio-image data require a complete error-free quality during transportation. Uncorrected errors are potentially catastrophic as consequences may be accumulated into subsequent stages. In a multiuser environment, the data flow also faces a high-concurrency environment. The database becomes a bottleneck that must handle high concurrency because of the large number of images that are used in the analysis phase.
The platform uses an XML supported database (Oracle) to store all the information related to the metadata of the experiments, measurements and analysis results. This information is hierarchically organized in the XML format, which facilitates the integration with other legacy systems such as the Image Analysis API, Cyttron API [5], File Servers, etc. The platform provides access to the data stored through web services which use XQuery to retrieve particular information requested by the End-user GUI.
Figure 2.4:Using our image analysis solution, the phenotypic measurements of (a) live cells and (b) adhesion can be extracted
(CYW+11)
30 CytomicsDB architecture
Figure 2.5:Phenotypic characterization of the Epidermal Growth Factor (EGF) treatment using a highly aggressive cancer cell line, the illustrated features are picked by branch-and-bound feature selection. The EGF-treated cell group shows a significant increased migration velocity
(CYW+11)
and multimodal optimization problem (Figure 2.3(b)) into several sub-optimal yet uni-modal optimization problems (Figure 2.3(c)). Such divided-and-conquer strategy provides an extended flexibility in searching intensity thresholds in each image. Con-trary to bottom-up segmentation strategies such as the Otsu algorithm, our solution prevents undertraining by introducing a flexible kernel definition based on the con-genital (intensity) homogeneity of an image. Unlike top-down segmentation strategies such as the level-set algorithm, our current algorithm prevents overtraining by a global overview of the intensity distribution of the region, therefore, it is less sensitive to local intensity distortion; in addition, our algorithm does not require any prior knowledge or manual interference during segmentation while it is mandatory for most existing top-down methods.
The tracking of objects is accomplished by customised algorithms deployed in the image analysis package. The principle behind this tracking algorithm is to estimate the minimum mean shift vector based on a given model (LYdB+10) (YVDvdW09).
With the binary masks and trajectories information obtained from image analysis, several phenotypic measurements are extracted for each object. Using the state-of-art pattern recognition and statistical analysis techniques, the effect of chemical com-pounds can be easily quantified and compared (Figure 2.5). Depending on the experi-ment setting, our package may employ up to 31 phenotypic measureexperi-ments during the analysis.
Automated Workflow of the HTS experiments 31
2.2.3
Data Management Module
In cytomics bookkeeping of the information generated during lab experiments is crucial and the amount of image data can easily exceed the terabyte-scale. However, currently spreadsheets applications are commonly used for storing experiment data. The accessibility of large volume of image data already poses an obstacle in the current stage.
After scientists, having performed HTS experiments, it is necessary to store meta information, including the experiment type, the protocol followed, experimental condi-tions used and the plate design, and associate each well in the plate to the raw images generated during the experiments and the results obtained from the image and data analysis when these processes are completed.
Currently, the large volume of images are stored in a file server and they are accessed following a standard naming convention. The locations of the files are stored in the spreadsheet application used for the experiment, but this is not a practical solution for knowledge discovery later on or querying the results obtained in the analysis process. The platform uses MonetDB, a modern column-based database management system (DBMS) as a repository of the experiments metadata that is used in the HTS Workflow System. Each component of the architecture communicate with the database through web services. This makes the future integration with other APIs more flexible.
2.2.4
Data and Pattern Analysis Module
Typical to the kind of analysis required for cytomics data is that the temporal as well as the spatial dimension is included in the analysis. The spatial dimension tells us where a cell or cell structure is, whereas the time-point informs us when it is at that particular location. Features are derived from the images that are time lapse series (2D+T or 3D+T). Over these features pattern recognition procedures are multi-parametric analysis. It is a basic form of machine learning solution, which is frequently employed in the decision-making procedure of biological and medical research. A certain pattern recognition procedure may be engaged in supporting various conclusions. For example, a clustering operation based on cell morphological measurements may provide an innate subpopulation within a cell culture (LYdB+10) while a classification operation using temporal phenotypic profile can be used to identify of each cell phase during division (NWH+10). The service that deals with the pattern recognition is based on the PR-Tools software package developed at the Delft University of Technology (www.prtools.org).
PR-32 CytomicsDB architecture
Tools within this architecture allows for rapid prototyping with a range of complex mathematical algorithms. In addition, PR-Tools in MatLab has its own GUI and in this manner data mining strategies can be explored by the end-user without in-depth knowledge of machine learning. The flexibility that is accomplished in this manner is efficient for the end-users as well as the software engineers who need to maintain and implement the services for machine learning.
2.3
System Architecture of the HTS Analysis Platform
Figure 2.6:The HTS analysis platform architecture
To automate the workflow of HTS experiments and provide the users with a convenient interface to interact with the system, we have designed anHTS analysis platform(YLL+11) (for short: HTS platform), which has a layered architecture. Figure 2.6 depicts the components in each layer of the architecture.
2.3.1
The Presentation Layer
The HTS platform enables end-users to carry out complete HTS experiments using a single graphical user interface, i.e., theHTS Analysis GUI. This way, even for end-users without extensive knowledge in cytomics, it is easy to learn how to analyse HTS experiments in cytometry. In addition, data sets produced under different conditions or from different HTS experiments are available through one interface. This also counts for the resulting data from each step in an HTS experiment. As a result, end-users can easily view, compare and analyse the different data sets.
2.3.2
The Service Layer
System Architecture of the HTS Analysis Platform 33
APIlayer, with each module corresponding to a module described in Section 2.2. This module structure allows quick development, error isolation and easy extending with more functional modules in the future.
We chose SOAP (Simple Object Access Protocol) messages for invoking the web services and receiving results, because of its approved interoperability in web applica-tions and heterogeneous environments. In case of the HTS platform, because of the presence of legacy systems we must support different programming languages. Using SOAP makes it possible for various languages to invoke operations from each other. Transportation of the data generated by an experiment is integrated into web service calls. Large files are transmitted as attachments of the SOAP messages. To do this, the MTOM (Message Transmission Optimization Mechanism) feature (GMNR05) of the Glassfish Server is used. Ensuring error free data transmission and controlling user access permissions are done at the application level.
2.3.3
The Persistence Layer
The persistence layer is based on the principle of object-relational mapping (ORM) which involves delegating access to a relational database and, which in turn gives an object-oriented view of the relational data, and vice versa (O’N). The Java Persistence API (JPA) framework has been implemented in this layer to keep a bidirectional correspondence between the database and objects. Those Java objects used in this framework are known as Java Entities (KS06). The entities are objects that live shortly in memory but persistently in the database. Besides that, they have all the features of a Java class like instantiation, abstraction, inheritance, relationships and so on. The entities used in CytomicsDB follow the same structure as the tables they map to. CRUD operations are registered as named query methods which are written in Java Persistence Query Language (JPQL). These customized queries can be attached to entities as native queries via JPA.
2.3.4
The Repository Layer
34 CytomicsDB architecture
a database optimised for data mining applications. MonetDB is a leading open source database system that has been designed specially for such applications (Bon02). It has been well-known for its performance in processing analytical queries on large scale data (BMK09). Thus, in our final decision, we use SOAP messages (i.e., XML format) to exchange small sized (meta-)data, but use MonetDB to store a major portion of the data produced and used during the HTS experiments, including all metadata generated during analysis. Additionally, a powerful scientific computer cluster is used to execute computing intensive image analysis tools. The future plan is to move also the raw data and as much as possible operations on them into the database system.
Figure 2.7:Flow of control of the HTS platform
2.3.5
Flow of Control
Database Design 35
Sequence 1 handles a new plate design, which is straightforward: the request is sent to MonetDB and a new entry is created. Sequence 2 handles uploading an HTS image request. Because currently the raw image data is stored separately, this request results in the metadata being stored in MonetDB while the binary data is stored on the file server. Sequence 3 handles an image analysis request, which is passed to the scientific super computer, since the tools for the analysis stage are there. Then the results are sent to MonetDB and stored there (step 3.3). Sequence 4 handles a data analysis request, which is first sent to MonetDB. Then, MonetDB passes both the request and the necessary data (obtained from the image analysis) to the scientific super computer for execution. The results are again stored in MonetDB. Since the most used data is stored at one place, in sequence 5, a view results request can be handled by just requesting data of both image analysis and data analysis from MonetDB. In the GUI, the results are displayed with the corresponding plate layout, as indicated in Figure 2.2.
Summary. In this section, we described the software architecture of the HTS platform, how its main features are processed, and how web services are used for the communi-cation with the DBMS and the dedicated scientific computer cloud. In the next section, we present how all data is stored in the DBMS.
2.4
Database Design
Figure 2.8:Database schema for Project Metadata
36 CytomicsDB architecture
Figure 2.9:Database schema for Experiment Metadata
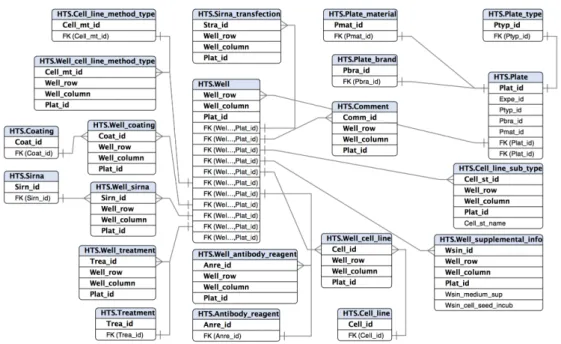
Figure 2.10:Database schema for Plate-Well Metadata
these views and the relationships among the tables.
2.4.1
Users and Experiment Sets
The basic information of a user is stored in the tablehts_user. A user belongs to a
Database Design 37
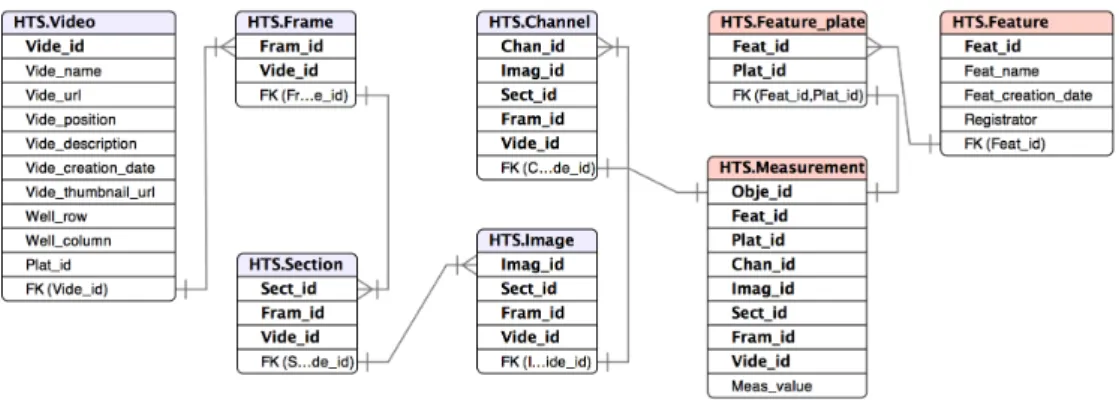
Figure 2.11:Database schema for Raw Images and Measurement Metadata
then also the author of this set of experiments.
Multiple users may work on the same experiment set, but only the author of an ex-periment set can grant another user the access to this set. The tableUser_experiment
stores the data required for validating the access control of all users. Possible values of
Role_experimentinclude: author, expert user, analyst user and guest user.
2.4.2
Plates and Wells
An HTS experiment starts with the design of the layout of a culturePlateofN×M
Wells in which the cells are kept and cultured. An experiment set can contain multiple culture plates, which typically have sizes of (but not restricted to)4×6,6×8,8×12
or16×24wells. A user can createconditionse.g. cell_lines, compounds, siRNA,
coating, etc. to be applied to the wells. Similar to theExperimenttable, restricted access to theconditionsare denoted explicitly according to the privilege granted to the user in tableRole_platform. TableWellkeeps track of which conditions are used by them in each experiment. Thus, one condition can be used in multiple exper-iment sets and accessed by multiple users. However, by referring to the compound primary key(User_id, Expe_id)of User_experiment, a user is restricted to only have access to a condition, if he/she has access to an experiment set using the condition. Additionally, because conditions are applied on individual wells, the table
Well_(condition)is designed to store this information.
2.4.3
Raw Images
38 CytomicsDB architecture
of experiment (denoted byType_idinExperiment) and the microscopy used in the experiment. Currently, four types of structures are supported:
1. 2D (XY): this structure corresponds to one frame containing one image which is composed of multiple channels ([1]Frame→ [1]Image→ [1..n]Channels).
2. 2D+T (XY+T): this structure corresponds to one video with multiple frames. Each frame contains one image composed of multiple channels ([1]Video→ [1..n]Frame→ [1]Image→ [1..n]Channels).
3. 3D (XYZ): this structure corresponds to one frame with multiple sections. Each section contains one image composed of multiple channels ([1]Frame→ [1..n]Sections → [1]Image→ [1..n]Channels).
4. 3D+T (XYZ+T): this structure corresponds to one video with multiple frames. Each frame can have multiple sections and each section contains one image composed of multiple channels ([1]Video→ [1..n]Frame→ [1..n]Sections→ [1]Image→ [1..n]Channels).
These four structures can be represented by the most general one, i.e., 3D+T. The 2D structure can be seen as a video of one frame containing one section. Each frame in the 2D+T structure can be regarded to contain one section. Finally, the 3D structure can be seen as a video of one frame. In the database schema, the generalised structures are captured by five relations, i.e.,Video,Frame,Section,ImageandChannel, connected to each other using foreign keys. Information stored in these relations is similar, namely a name and a description. Only the main tableVideocontains some extra information, e.g., a foreign key referring to the tableWellto denote from which well the image has been acquired. Because currently only the metadata of the raw images are stored in these tables, the location of the image binary data is stored in
Vide_url. The exact type of the video structure can be looked up usingType_idin theExperiment.
2.4.4
Results of Image Analysis
The results of image analysis are auxiliary images which, currently, are binary masks or trajectories. These images are result of the execution of quality enhancing filters and segmentation algorithms employed to extract region of interests (ROIs). The metadata of these images is stored in the tableMeasurement, including the location where the binary data is stored. Moreover, this table also store the phenotypic measurements gathered from ROIs and location of auxiliary images e.g. trajectories. The foreign key
Related Work 39
2.4.5
Results of Data Analysis
The goal of the data analysis stage is converting image data into comprehensive conclu-sions. For achieving this goal basic operations such as feature selection, clustering and classification are applied to the measurements extracted from the image analysis. The parameters used by the operation and the extracted features are respectively stored in
Feature, and are connected to the correspondingMeasurementrecord via foreign keys.
2.5
Related Work
40 CytomicsDB architecture
are processing environments that are very much geared towards the volume of data that is commonly processed in HTS. The Konstanz Information Miner (KNIME) is a good example of such environment. It offers good functionality to process the data but it does not directly map to the workflow that is common in HTS and it does not support elaborate image analysis. Therefore, in order to be flexible, the workflow is directed towards standard packages for data processing and the processes are separated in different services rather than one service dealing with all processing. So, one service specifically for the image processing and analysis (e.g. ImageJ or DIPLIB) and another service for the pattern recognition and machine learning (e.g. WEKA or PRTools). In this manner flexibility is accomplished on the services that one can use.
2.6
Conclusions and Future work
Chapter
3
Metadata Management
This chapter describes our approach in CytomicsDB for building a semantic layer over the data so as to enable querying metadata and at the same time allowing scientists to integrate new tools and APIs taking care of the image and data analysis. These analysis results will become part of the metadata of the whole HTS experiment and will be available for semantic post analysis.
This chapter is based on the following publication:
• E. Larios, Y. Zhang, L. Cao, and F.J. Verbeek. Cytomicsdb: A metadata-based storage and retrieval approach for high-throughput screening ex-periments. Pattern Recognition in Bioinformatics (PRIB 2014). Lecture Notes in Computer Science, vol. 8626, Springer International Publishing, pages 72–84. 2014.
3.1
Introduction
42 Metadata Management
In cytometry, HTS-experiments are usually employed in the context of functional analysis, closing the gap between genomics-proteomics and functional responses on the cellular level. Examples are genome wide siRNA screens, where all existing genes are lowered in activity one at a time using siRNA mediated knock down followed by some cellular-level phenotypic readout, e.g., cell migration speed, focal adhesion dynamics, subcellular morphological changes, cell death.
A next step in the HTS-experiment pipeline is image quantification using image analysis software tools. In this manner, biological hypothesis can be statistically tested using the quantification results from the image analysis stage, and can depict an objective understanding of the cell response to various treatments or exposures.
In a typical HTS workflow, spreadsheet applications are commonly used for book-keeping all information related to the design of the multiwell-imaging plates, image analysis quantification results and even statistical analysis results. This approach has many drawbacks. Firstly, it is extremely difficult to link the data produced during the different stages of an HTS experiment, such as linking the images generated in the HTS experiment and the metadata collected during the design of the plate layout. Secondly, it is highly prone to man made errors. The lack of standards, formats and a central-ized place for storing the information makes it difficult to promote a collaborative environment within or between research groups. Finally, spreadsheet applications are not suitable for knowledge discovery, as they do not allow to combine sophisticated visualization and querying of the (meta)data previously stored.
In our previous work (LZY+12), we presented the initial design of a platform for managing and analyzing HTS images resulting from cytomics screens taking the automated HTS workflow as a starting point. This platformseamlessly integrates the whole HTS workflow into a single system. The platform relies on a modern relational database system to store user data and process user requests, while providing a convenient web interface to end-users. Using this platform, the overall workload of HTS experiments, from experiment design to data analysis, can be significantly reduced. Additionally, the platform provides the potential for data integration to accomplish genotype-to-phenotype modeling studies. In this work, the initial design, particularly, the database model, has been rigorously revised and generalised to manage all kinds of metadata produced by automated HTS systems. We call our systemCytomicsDB, which is designed as a user oriented platform but considers the HTS workflow as a template for managing, visualizing and querying the metadata.
Metadata organization in an HTS experiment 43
1. Ease of promoting scientific collaborations. Since all data in CytomicsDB are centralized, granting access to collaborators or sharing information has been made simple.
2. Flexibility for integration with other legacy systems. It it common to use external APIs for performing image and data analysis results, such as Weka, PRTools. In the design of the architecture of CytomicsDB, special care has been taken to assure the possibility of invoking external API through web services.
3. The web-based architecture allows users easy access to their experiments data from wherever and at any time. The architecture also allows the whole or parts of the system to be smoothly moved to a Cloud based environment.
4. The capability to drill-down through experiments metadata due to the metadata-based approach.
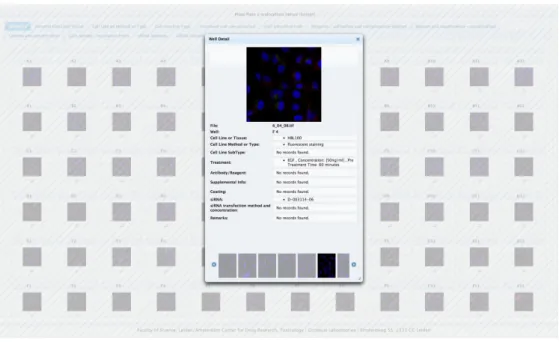
5. A single interface for visualization of all experiments data, including raw images, metadata and analysis results.
6. Pattern recognition (PR) within an experiment and PR across HTS experiments. To sum up, the contributions of this work include:
1. Metadata organization in an HTS experiment (Section 3.2).
2. A case study in endocytosis of epidermal growth factor receptor (EGFR), describ-ing how a Metadata-based RDBMS approach can facilitate the identification of EGFR dynamics and classification of EGFR phenotype stages (Section 3.3). Finally, in Section 3.4 we discuss related work and in Section 3.5 we present our conclusions.
3.2
Metadata organization in an HTS experiment
The metadata of an HTS experiment consists of a variety of types and formats and has been grouped in five levels as showed in Figure 3.1: Project, Experiment, Plate - Wells, Video/Images and Measurements. These levels contain each other in a cascade fashion, for instance: [1] Project contains [1..n] Experiments, [1] Experiment contains [1..n] Plates, [1] Plate contains [24,48,96,384] Wells, [1] Well contains [1..n] Video/Images and finally [1] Well contains [1..n] measurements.