ANALYZING DETERMINANTS OF URBAN VIBRANCY – A BIG DATA APPROACH ON CONNECTING BUILT ENVIRONMENT, SOCIAL ACTIVITY, AND IMAGES OF PLACES
Yan Chen
A Dissertation submitted to the faculty at the University of North Carolina at Chapel Hill in partial fulfillment of the requirements for the degree of Ph.D. in the Department of City and
Regional Planning in the College of Arts and Sciences.
Chapel Hill 2019
Approved by: Yan Song Emil Malizia Nikhil Kaza
© 2019 Yan Chen
ABSTRACT
Yan Chen: Analyzing Determinants of Urban Vibrancy – A Big Data Approach on Connecting Built Environment, Social Activity, And Images of Places
(Under the direction of Professor Yan Song)
This dissertation includes three self-contained and interrelated papers on built environment, urban vibrancy and vibrant places.
Paper 1: Built environment and social activity: Exploring the relationship between place pattern and tweeting in Chicago
found that the built environment significantly influenced tweeting and provides empirical statistical evidence to guide urban planners’ placemaking decisions.
Paper 2: Built environment and social activity: Exploring the relationship between place pattern and tweeting in the U.S.
This study focuses on the relationship between the spatial distribution of geotagged tweets and the key characteristics of built environments as well as the pattern of the features at the census block group (CBG) level within the contiguous U.S. First, we employed a count regression model, setting the Twitter message density by CBG as the dependent variable to test the significance and magnitude of the associations between the built environment and tweeting behavior. Then, we utilized a combined research framework based on cluster analysis, hotspot analysis, and standardized score to explore the built environment pattern of the most vibrant tweeting areas. Results revealed that the built environment significantly influenced tweeting behavior. We further discovered four different built environment pattern types that provides empirical statistical evidence to guide urban planners’ placemaking decisions.
Paper3: Built environment and vibrancy perception: Applications of deep learning and computer vision techniques in streetview.
“吾生也有涯,而知也无涯。以有涯随无涯,殆已!已而为知者,殆而已矣!为善
无近名,为恶无近刑,缘督以为经,可以保身,可以全生,可以养亲,可以尽年。”
- 庄子·内篇·养生主第三
Your life has a limit but knowledge has none. If you use what is limited to pursue what has no limit, you will be in danger. If you understand this and still strive for knowledge, you will be in danger for certain! If you do good, stay away from fame. If you do evil, stay away from punishments. Follow the middle; go by what is constant, and you can stay in one piece, keep yourself alive, look after your parents, and live out your years.
“Zhuangzi, Inner Chapters, Yang Sheng Zhu” – Chapter 3
“虽我之死,有子存焉。 子又生孙。孙又生子。子又有子,子又有孙。 子子孙孙,
无穷匮也,而山不加增,何苦而不平?”
- 列子·汤问
Although I shall die, there is still my son. My son will bear grandsons. And the grandsons will have sons. Those sons will have sons and grandsons. Sons and grandsons will continue without end, but the mountains won’t grow higher. So why should we worry about not flattening them?
ACKNOWLEDGEMENTS
Foremost, I would like to express my sincere gratitude to my advisor Prof. Yan for the countless support of my Ph.D. study, life, and research. I could not have imagined having a better advisor and mentor for my Ph.D.
Besides my advisor, I would like to thank the rest of my thesis committee: Prof. Malizia, Prof. Kaza, Prof. Whittemore, and Prof. Ye, for their insightful comments and generous encouragement, but also for the hard question which incented me to widen my research from various perspectives.
Very special thanks to my father, Prof. Jiuru Chen, for encouraging me to pursue a Ph.D. while I was cringing back in the days. I wish his soul roots in peace and solace in heaven. I owe so much thanks to my mother, Prof. Qing Xia, who was continuously supporting me throughout my life and leaving me free in all my decisions. I am very much thankful to my uncle, Mr. Hong Xia’s family, for making me feel at home all the time while in the U.S. Also, I thank my girlfriend, Miss Zhu, for her sincere support whenever I needed during the days of overwhelmed writings.
TABLE OF CONTENTS
CHAPTER 1: INTRODUCTION ...1
1.1 Statement of The Problem ...1
1.2 Research Questions ...5
1.2.1 Paper 1 ... 6
1.2.2 Paper 2 ... 6
1.2.3 Paper 3 ... 6
CHAPTER 2: LITERATURE REVIEW ...10
2.1 Definition of Urban Vibrancy and Vibrant Places ... 11
2.2 Factors of Urban Vibrancy ...15
2.2.1 Image ... 15
2.2.2 Human demand ... 17
2.2.3 Activity ... 18
2.3 Factors of Vibrancy Places ...20
2.3.1 Fit ... 20
2.3.2 Sense... 22
2.3.3 Access ... 23
2.3.4 Endogenous and exogenous confounding factors ... 24
2.4 Measures of Urban Form and Urban Vibrancy in Big data era ...26
2.4.1 Urban Form Measures ... 26
2.4.3 Big Data and Deep Learning Innovations for Vibrancy Studies ... 32
CHAPTER 3: BUILT ENVIRONMENT AND SOCIAL ACTIVITY: EXPLORING THE RELATIONSHIP BETWEEN PLACE PATTERN AND TWEETING IN CHICAGO ...44
3.1 Introduction ...44
3.2 Literature Review ...46
3.2.1 A new source of data ... 46
3.2.2 Relationships between urban form and human activities ... 47
3.3. Material and Methods ...50
3.3.1 Study area and independent variables ... 50
3.3.2 Independent variables: The built environment ... 51
3.3.3 Hotspot analysis ... 59
3.3.4 Negative binomial models with exposure ... 60
3.4. Results ...63
3.4.1 Hotspots ... 63
3.4.2 Negative binomial regression results ... 66
3.4.3 Standardized regression results ... 71
3.5 Discussion ...73
3.5.1 Limitations and future direction ... 74
3.6. Conclusions ...75
3.5.2 Policy implications ... 76
CHAPTER 4: BUILT ENVIRONMENT AND SOCIAL ACTIVITY: EXPLORING THE RELATIONSHIP BETWEEN PLACE PATTERN AND TWEETING IN THE U.S ...85
4.1 Introduction ...85
4.2 Literature Review ...88
4.2.1 A New Source of Data ... 88
4.2.3 Built environment typology studies ... 93
4.3 Data and Method ...96
4.3.1 Study Area and Dependent Variable ... 96
4.3.2 Built Environment Measures ... 96
4.3.3 Negative Binomial Models with Exposure ... 99
4.3.4 Hot Spot Analysis ... 100
4.3.5 K-means ... 100
4.4 Results ...101
4.4.1 Regression Analysis Results ... 101
4.4.2. Hot Spot Analysis ... 104
4.5 Discussion ...108
4.6 Conclusions ... 111
CHAPTER 5: BUILT ENVIRONMENT AND SOCIAL ACTIVITY: EXPLORING THE RELATIONSHIP BETWEEN PLACE PATTERN AND TWEETING IN THE U.S ...120
5.1 Introduction ...120
5.2 Literature Review ...123
5.2.1 Built environment and urban vibrancy ... 123
5.2.2 Urban form measures and deep learning ... 125
5.2.3 Typologies of urban form ... 128
5.3 Data and Methods ...129
5.3.1 Conceptual framework ... 129
5.3.2 Streetscape Measures: Deep learning and image segmentation... 132
5.3.3 Other measures ... 134
5.3.4 Perception measures ... 135
5.3.5 Empirical analysis ... 136
5.4.1 Correlation matrix ... 137
5.4.2 Regression ... 138
5.4.3 Clustering analysis ... 141
5.4.4 Regression by type ... 149
5.5 Discussion ...151
5.6 Conclusions ...153
CHAPTER 6: CONCLUSION AND FUTURE RESEARCH ...162
6.1 Conclusions ...162
6.2 Policy implications ...164
6.3 Limitations and future research ...165
APPENDIX ...170
Appendix A ...170
Appendix A.1 Urban form measures at the city level ... 170
Appendix A.2 Urban form measures at the community levels ... 175
Appendix A.3 Urban form measures at street levels ... 179
Appendix A.4 Relationship between urban form measures and vibrant place factor ... 182
Appendix B ...184
Appendix B.1 - Subcenter definition ... 184
Appendix B.2 - Employment type definition ... 185
CHAPTER 1: INTRODUCTION
1.1 Statement of the Problem
How does urban planning improve the built environment to make cities more vibrant? This question has long been a keynote concern for urban planning professionals (Lynch, 1952). Jacobs’s (1961) discussion about this topic lays the foundation for today’s concept of “Place-making” and presents it to a larger audience. However, several ingrained attitudes about city planning during that period undermined attempts to create more active and culturally confident cities (Montgomery, 1998). Nevertheless, since the start of the 21st century, the redevelopment of central cities in the United States has been reported in many metropolitan areas across the country, especially after the end of the Great Recession (Malizia, 2016). Currently, there is renewed interest in urban living and public space. Although preferences for suburban living have not faded in the West (particularly in North America), many groups have begun considering central city living as more desirable. Renewed interest in revitalizing Main Streets across North America for commerce, neighborhood identity, and social interaction also evidences this trend (Mehta, 2013).
three factors by reinforcing the users’ abilities to “sense,” “fit,” and “access” the site, which ultimately helps increase urban vibrancy.
Figure 1.1: The components of urban vibrancy.
distribution of human activities or people’s image of places. This dissertation will, therefore, explore the innovative application of big data in urban studies in six ways:
• Acquire and utilize big data using application program interfaces (APIs) from digital platforms. • Analyze the relationship between built environment combination patterns and human behavior. • Utilize deep learning model to extract built environment information at a high resolution,
streetscape level.
• Examine the framework of built environment measures at multiple resolutions (macro, micro, street) for a large-scale area.
• Review the analytic methods of the built environment using unsupervised clustering methods. • Consider the combination of the big data method and traditional statistics methods in urban
studies.
Many studies have shown that urban vibrancy and similar concepts affect a wide range of aspects in our society. Three major impacts are economic growth, social cohesion, and individual health.
spillovers within geographically proximate areas. Similarly, Malizia (2016, 2017) has found that more vibrant city centers are associated with higher office rents and more high-growth firms.
Florida (2002) and Knudsen (2007) further explore this topic in the creative industry sector, showing that the quality of place will highly contribute to the rise of the creative economy. More vibrant urban places will also help cities attract more talented and innovated workers with higher educations, who have been shown to not only be more productive but also to be related to faster rates of income growth (Gottlieb & Fogarty, 2003) and a better ability to deal with economic shocks (Glaeser, 2003). Also, a sense of vibrancy in places will stimulate consuming behaviors (Underhill, 2009), especially for small businesses in a city. This has been shown to be a significant driving force for economic growth (Glaeser, 2010). Furthermore, the recent emergence of a sharing economy will benefit from vibrancy, which could provide more potential customers (Davidson & Infranca, 2016).
For social cohesion, the most vital impact of urban vibrancy would be to increase social diversity, since diversity has always been the core value for urban vibrancy. Jane Jacobs (1961) states that vibrancy, by offering more diversified building and land use, encourages “togetherness” between different activities and people. She also proposes that vibrancy in public spaces will create “eyes on the street,” hence reducing crime in neighborhoods, as shown by Cozens (2008). Moreover, vibrancy helps to build a “sense of community” in a neighborhood, the loss of which leads to many urban issues in the United States.
other such activities, decreasing the risk of obesity and cardiovascular diseases (Reid, Ewing, & Cervero, 2010a; Frank & Engelke, 2001; Handy, Boarnet, Ewing, & Killingsworth, 2002a).
1.2 Research Questions
My dissertation research, via the three papers outlined in Figure 1.2 , intends to show that urban vibrancy is a phenomenon of structured complexity that associated with different built environment factors, but it is perfectly possible to plan for and design a vibrant place. I seek to determine the built environment factors and, more importantly, the built environment patterns related to vibrant places to advance the theoretical and empirical understanding of the relationship between urban form and urban vibrancy. Moreover, I am interested in examining how to overcome the traditional limitations of similar studies by using information communication technology (ICT) and big data analytics. As shown in Figure 1.1, of the three factors of urban vibrancy, “image” and “activity” are possible to measure and study as a proxy for urban vibrancy; human demand cannot be measured in the same way because it is unobservable.
Therefore, the first two papers of my dissertation will assess the individual and interaction effects of different urban form elements on urban vibrancy from the social activity perspective, using tweets as a proxy. The first paper will discuss built environment patterns by introducing several interaction terms into the equation, while the second paper will further explore the relationship by looking at the patterns using unsupervised, statistic clustering methods and enlarging the study from the city to the national level. Finally, the third paper will discuss vibrant places from a subjective viewpoint by collecting human perceptions of places as a proxy.
The research questions for the three papers are as follows:
1.2.1 Paper 1
1. If people have the ability to digitally connect from any place and at any time, do the characteristics of the built environment influence social media behaviors?
2. If the characteristics of the built environment relate to the extent of social media behavior, which of those characteristics significantly relate(s) to those behaviors?
1.2.2 Paper 2
1. How are built environment factors individually associated with tweeting behaviors? 2. How are the patterns of built environment factors associated with tweeting behaviors?
1.2.3 Paper 3
1. How are built environment factors associated with perceptions of vibrancy? 2. How are built environment patterns associated with perceptions of vibrancy?
REFERENCES
Alañón-Pardo, Á., & Arauzo-Carod, J. M. (2013). Agglomeration, accessibility and industrial location: Evidence from Spain. Entrepreneurship and Regional Development, 25(3–4), 135–173. http://doi.org/10.1080/08985626.2012.710263
Batty, M. (2013). Big data, smart cities and city planning. Dialogues in Human Geography, 3(3), 274-279.
Cozens, P. (2008). Crime prevention through environmental design. Environmental criminology and crime analysis, 153.
Davidson, N. M., & Infranca, J. (2016). The sharing economy as an urban phenomenon. Yale Law & Policy Review, 34(2), 16-10.
Duranton, G., & Kerr, W. R. (2015). The Logic of Agglomeration. NBER Working Paper, (21452). http://doi.org/10.3386/w21452
Ewing, R., & Cervero, R. (2010). Travel and the Built Environment: A Meta-Analysis. Journal of the American Planning Association, 76(3), 1–30. http://doi.org/10.1080/01944361003766766
Florida, R. (2002). The rise of the creative class (Vol. 9). New York: Basic books.
Frank, L. D., & Engelke, P. O. (2001). The Built Environment and Human Activity Patterns: Exploring the Impacts of Urban Form on Public Health. Journal of Planning Literature, 16(2), 202–218. http://doi.org/10.1177/08854120122093339
Glaeser, E. L., & Kerr, W. R. (2010). The secret to job growth: Think small.
Glaeser, E. L., & Saiz, A. (2003). The rise of the skilled city(No. w10191). National Bureau of Economic Research.
Gottlieb, P. D., & Fogarty, M. (2003). Educational attainment and metropolitan growth. Economic development quarterly, 17(4), 325-336.
Handy, S. L., Boarnet, M. G., Ewing, R., & Killingsworth, R. E. (2002). How the built environment affects physical activity: Views from urban planning. American Journal of Preventive Medicine, 23(2 SUPPL. 1), 64–73. http://doi.org/10.1016/S0749-3797(02)00475-0
Hogan, M. J., Leyden, K. M., Conway, R., Goldberg, A., Walsh, D., & McKenna-Plumley, P. E. (2016). Happiness and health across the lifespan in five major cities: The impact of place and government performance. Social Science and Medicine, 162, 168–176.
http://doi.org/10.1016/j.socscimed.2016.06.030
Jaffe, A. B., Fogarty, M. S., & Banks, B. A. (1998). Evidence from patents and patent citations on the impact of NASA and other federal labs on commercial innovation. The Journal of Industrial Economics, 46(2), 183-205.
Knudsen, B., Florida, R., Gates, G., & Stolarick, K. (2007). Urban density, creativity and innovation. May 2007.
Lynch, Kevin, and Lloyd Rodwin. 1958. “A Theory of Urban Form.” Journal of the American Institute of Planners 24(4): 201–14.
http://www.tandfonline.com/doi/abs/10.1080/01944365808978281 (May 1, 2016).
Lynch, Kevin. 1984. “Good City Form.” City: 524. http://www.amazon.co.uk/Good-City-Form-K-Lynch/dp/0262620464.
Malizia, E., & Motoyama, Y. (2016). The Economic Development–Vibrant Center Connection: Tracking High-Growth Firms in the DC Region. The Professional Geographer, 68(3), 349-355.
Malizia, E., & Song, Y. (2016). Does downtown office property perform better in live–work– play centers?. Journal of Urbanism: International Research on Placemaking and Urban Sustainability, 9(4), 372-387.
Mehta, Vikas. The street: a quintessential social public space. Routledge, 2013.
Montgomery, John. "Making a city: Urbanity, vitality and urban design." Journal of urban design 3, no. 1 (1998): 93-116.
Puga, D. (2010). The magnitude and causes of agglomeration economies. Journal of Regional Science, 50(1), 203-219.
Sedgley, N., & Elmslie, B. (2004). The geographic concentration of knowledge: Scale, agglomeration, and congestion in innovation across US states. International Regional Science Review, 27(2), 111-137.
Siegel, D., & Griliches, Z. (1992). Purchased services, outsourcing, computers, and productivity in manufacturing. In Output measurement in the service sectors (pp. 429-460). University of Chicago Press.
CHAPTER 2: LITERATURE REVIEW
To give a systematic review of the related literature for my dissertation, this section is divided into four major parts. (1) Definition of Urban Vibrancy and Vibrant Places; (2) Factors of Urban Vibrancy; (3) Factors of Vibrancy Places; (4) Measures of Urban Form.
Figure 2.1 The Framework of Urban Vibrancy and Vibrant Places
2.1 Definition of Urban Vibrancy and Vibrant Places
• The space perspective as vibrant places that link to many users;
• The human perspective as vibrant public life that connect with many places. The first aspect of connection originates from the definition of “place”. Beginning in the late 1970s, geographers such as Yi-Fu Tuan (1977) and Edward Relph (1976) grew dissatisfied with what they felt was a philosophically and experientially anemic definition of place. Relph argues that space is not a void or an isometric plane or a kind of container that holds places. Instead, he contends that to study the relationship of space to a more experientially-based understanding of place, space too must be explored in terms of how people experience it. For Relph, the unique quality of place is its power to order and to focus human intentions, experiences, and actions spatially. “A place is a center of action and intention…The essence of the place lies in the largely unselfconscious intentionality that defines places as profound centers of human existence”. Or as Tuan (1977) stated “place is whatever stable object catches our attention.”
Therefore, public spaces would serve as a stronger role for creating urban vibrancy compared with private spaces because its natural advantage in building social connection. Crowhurst-Lennard and Lennard (1993) engaged this feature from a list of social functions of public spaces, including learning, the development of social competence, the exchange of information, the facilitation of social dialogue, the fostering of social awareness, the enhancement of social integrative functions, and the encouragement of ethical conduct. Scholars in various fields related to urban studies contend that it is the streets, plazas, squares, parks and other urban public spaces that have the potential to be “the stage upon which the drama of communal life unfolds” (Carr et al. 1992). Hester (1975) and Oldenburg (1989) also suggested that associations with people, places, and events contribute to a sense of familiarity and belonging to the community.
highly dependent on this balance between private and public life. As Carr (1992) and Oldenburg (1989) stated, most sense of “vibrancy” is coming from the senario that the active use of public space, in other words, the high frequency of public activity. When it comes to the critics of decentralization and suburbanization, several scholars mention that intensity and variety of public life functions are diminishing (Oldenburg 1987; Carr 1992; Sorkin 1992). Therefore, the vibrancy is a life style that is more oriented to public life compared with the opposite private life style. For instance, people would be more likely to eat, drink, play and meet a friend at public places such as restaurants, bar, playgrounds, parks, transits. In contrast, for a private oriented life pattern, people could eat, sleep play, meet friends just at home or work place, Carr (1992) and Oldenburg (1989) also found the change towards private life balance usually occurred with many urban issues in the last century, such as urban sprawl and central city decay. As Banerjee (2001) argued that it’s very important for designers to focus more on supporting and creating opportunities for public life, in this way people can connect with and use many more places compared with more private life-oriented pattern.
For the component of urban vibrancy and its relation to urban form, there has been many discussions. Relph(1976) describes this persistent identity in terms of three components: (1) the place’s physical setting; (2) its activities, situations, and events; and (3) the individual and group meanings created through people’s experiences and intentions in regard to that place. As the model shown in figure 2.3, Montgomery (1998) tries to summarize factors that are building the “sense of place” (or “place making”) based on the previous works of Canter (1977) and Punter (1991). In his model, activity, urban form and urban image are the three major components of place. Therefore, in another perspective, my model would be adding the concept of “human demand” into his “sense of place” model, serving as a new vertex, which provides a complete explanation of how the place will be vibrant. There are other proposed criteria that are less systematical framed. Carr et al. (1992) put forth a holistic and comprehensive description, suggesting that ideal public space is responsive, democratic and meaningful. Mehta (2013) based on the framework of Gehl (1987) and Carr et al. (1992), proposed five principles for the quality of public spaces, inclusiveness, pleasurability, safety, comfort, meaningful activities.
2.3. Generally, it is a positive loop relation between the three major components – “Image”, “Demand”, “Activity”, which are connect by three feature of built environment – “Sense”, ”Fit” and ”Access”. When people “sense” the “activity” or the possibility of activities in the places, they would create an “image” about the location. If this “image” “fit” our “demand” in nature, in other word, desirable, it could encourage people to “access” the place to conduct similar “activity”. Then this positively reinforcing loop relationship could keep increasing the vibrancy in site until it reaches the maximum capacity. In other books (Jacobs 1961, Gehl 1987), it usually was called as “self-reinforcing” or “self-simulating” process. Detailed explanations for the factor of urban vibrancy and factor of built environment of vibrant places are stated in the following sections.
2.2 Factors of Urban Vibrancy
2.2.1 Image
A large number of studies in place-making has focused on the image factor. Using cognitive mapping methods, Lynch (1960) summarizes the city image into five elements, including path, edge, district, node, and landmark. This categorization is still very influential for the urban form studies today. But it’s a little difficult to explain the relationship between urban form and human behavior. Therefore I think it’s not applicable for urban vibrancy researches. For other works in the urban planning field, Gehl (1987) analyzes the physical properties of human senses (such as smell, hearing, seeing) and social distances. Like many other authors (Jacobs 1961, Christopher et al. 1977; Lynch, 1984), Gehl believes there must be a correspondence between the dimension of space and a sense of place. Kitamura et al. (1997) find that these psychosocial measures are more important in explaining transportation choices than objective measures. Important perceptions about the qualities of places, for example, are traffic safety, safety from crime, cleanliness, attractiveness, and pedestrian friendliness. Beyond that, architecture, landscape architecture, and urban planning literature tries to summarize numerous perceptual qualities that may relate to urban form and human behavior (Handy, 1992; Ewing, 2000, Ewing, 1996, Ewing et al., 2005a, Ewing and Handy 2009). Among them, Ewing and Handy (2009) made a solid quantitative attempt to comprehensively and objectively summarized and measure those subjective qualities that would affect walking behavior. After reviewing related literature, 51 perceptual quality were selected. Then nine central elements are selected using ratings from an expert panel, and five of them were successfully operationalized in the final validation, which could be categorized the concept of the image into five sub-components: identity, enclosure, human scale, transparency, and complexity
being similar to a lens through which stimuli are perceived and become focused. However, in the lens model, cues have only a certain probability of being useful (a concept called probabilism). James Gibson’s affordance (1979) is a perspective that takes an ecological approach to perception. In contrast to Brunswik(1956), Gibson believes that, rather than perceiving individual features or cues, human organize those features into a recognizable pattern (affordance) based on an arrangement of cues that provide perceptions. There are also other models like Kaplan preference framework or Pleasure-Arousal framework (Russell, J. A., Ward, L. M., & Pratt, G., 1981) which is meaningful but focus more on the psychology side, therefore too hard to connect with the urban planning topics.
2.2.2 Human demand
Human demand dimension refers to what people want. It represents the needs or intentions deeply rooted in our humanity, such as safety or comfort. If the perceived image of the place meet our demand, it would turn to mental motivations that lead to certain behavior on the site. It serves as the driving force for people to utilize and connect with various places. Unlike image or activity, this quality cannot be detected or accessed by outside observers, yet it does exist in our perception and reaction process, based on the individual's values, beliefs, and ideas. This human nature/demand factor has to be considered because it is the fundamental feature that everyone shares to make a general statement about the vibrant settlement that is relevant and responsive to any human context.
summaries five core human needs that influence the appeal a certain public space has on us. He believes as human beings people would seek 1) comfort, 2) relaxation, 3) passive engagement, 4) active engagement, and 5) discovery in public space. Metha (2013) based on the framework of Gehl (1987) and Carr et al.(1992), proposed five human demand principles that relate to urban vibrancy, inclusiveness, pleasurability, safety, comfort, meaningful activities. Moreover, Crowhurst-Lennard and Lennard (1987, 1995) engaged the literature from several disciplines to develop a list of social demand, including learning, the development of social competence, the exchange of information, the facilitation of social dialogue, the fostering of social awareness, the enhancement of social integrative functions, and the encouragement of ethical conduct.
2.2.3 Activity
Activity refers to what people do in the place. In order to have effective design and management of the place, it is also essential to understand the role that those places play in people’s life. Places are proposed, built and assessed with assumption about what should be done in them. The activity component might serve as the most important factor and aspect of urban vibrancy. As described by Montgomery (1998), vibrant places tend to be places of "many and varied comings and goings, meetings, and transactions." Whyte clearly defines the sense of crowdness as the central criteria for the goodness in urban spaces, as he said “What attract people the most is the people” (Whyte 1980).
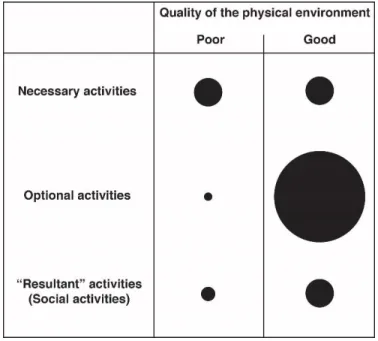
Figure 2.4 the type of activities (Gehl, 1987)
Necessary activities include behaviors that are more or less compulsory, such as commuting, shopping for food, which is only slightly affected by the physical framework. Optional activities happen if people have an instinctive motivation to do so and if time and place make it possible, such as taking a walk to get a breath of fresh air. According to Gehl (1987), this relationship is particularly important in connection with physical planning.
More importantly, Gehl believe necessary and optional activities serve as a prerequisite for social activities. Social activities are all activities that depend on the presence of others in public spaces such as children at play, greetings, and conversations. Social activities include a broad spectrum of diverse activities. For instance, there could be many passive visual and audible contacts or what Gehl (1987) call for "low-intensity contact": watching people and hearing what is happening. This modest, unpretentious form of contact is the most widespread social city activity anywhere.
only stop but also spend time with space. Therefore, they serve as a prerequisite of urban vibrancy - connecting people together in places. Gehl (1987) described this as “living cities. Therefore, ones in which people can interact with one another, are always stimulating because they are rich in experiences”. Whyte (1980) believes that the best-used plazas are sociable places, with a higher proportion of couples than you find in less-used places, more people in groups, and more people meeting people, or exchanging goodbyes. Jacobs (1961) maintain that making contact, and assimilating children are the primary use of streets other than transportation.
2.3 Factors of Vibrancy Places
As stated in the framework, to build places that promoting urban vibrancy, the urban form needs to meet three major requirements: “Fit”, “Sense”, “Access”, which connect the three components of urban vibrancy together as a self-reinforcing loop. These factors are also consistent with the five factors that Lynch (1981) proposed as conditions of good city form – vitality, fit, sense, access, control. Since this dissertation mainly focus on the built environment features at places and higher resolution level, the lack of vitality and control factor is reasonable because they primarily concern city-level and non-spatial issues. When all factors manage to work together to such pleasing ends, a feeling of physical and psychological well-being happens, the feeling that space is a thoroughly vibrant place in which to be.
2.3.1 Fit
structure connects with our other human nature and demands, the match between environments, our sensory and mental capabilities, and our cultural constructs.
For example, the fitness of vibrant places could be provided by building physical setting to meet the demand of people’s stationary and lingering activity demand including walking, standing, and sitting, by providing sidewalks or street furniture. Whyte (1978) pays close attention to this issue. He claims that the most popular plazas tend to have considerably more sitting space than the less well-used ones. He also suggested providing a choice of sunny or shady areas (weather permitting); try to 'borrow' light (using reflective surfaces) if space is north facing or overshadowed; wind and drafts are usually unwelcome. Water should be accessible and not just for looking at; moving water can help to create a quiet and restful feeling by masking the worst aspects of street noise. Also, food and seamless connection with the street is vital. More importantly, external stimulus - the 'spark' – is needed to get people talking to each other such as the street performer, 'character,' physical object (e.g., sculpture), sight /view, etc.
In addition, the fitness of vibrant places could also be provided by creating desirable psychological image. For instance, the concept human scale refers to “a size, texture, and articulation of physical elements that match the size and proportions of humans and, equally important, correspond to the speed at which humans walk.(Ewing and Handy 2009)” Christopher et al. (1977) state that any buildings over four stories tall are out of human scale and will lead to psychological pressure. They also find that a person’s face and a loud voice can just be recognizable at 70 feet, and more detail could be a catch at 48 feet. These set the limits of human scale for social interaction. Gehl (1987) made a similar test for this “social distance” ranging from 0ft to 12 ft.
noticeable differences to which a viewer is exposed per unit of time. As Gehl (1987) noted, an interesting walking network will have the “psychological effect of making the walking distance seem shorter,” by virtue that the trip is “divided naturally, into manageable stages.”
2.3.2 Sense
Sense refers to the how people perceive mentally differentiate and structure the activities or potential activities in the places, or how activities and built environments that evokes a strong image in an observer’s. It’s highly related to concepts like “identity”, “transparency” or “atmospherics” that previous literatures discussed.
For “identity”, Kevin Lynch (1960) described it as “shape, color, or arrangement which facilitates the making of vividly identified, powerfully structured, highly useful mental images of the environment.” A highly imageable city is well formed, contains distinct parts, and is instantly recognizable to anyone who has visited or lived there. It is one whose elements are easily identifiable and grouped into an overall pattern. For the identity feature, Landmarks are believed to be a key component. In the book “the architecture of the city,” Rossi (1982) claims the city is a binary existence of landmarks that define it and matrix that supports it. “Landmark” does not necessarily denote a grandiose civic structure or even a large object. In the words of Lynch, it can be a doorknob or a dome. What is essential is its singularity and location, in relationship to its context, background and the city at large.
trees in most urban settings work against transparency (Arnold 1980).
In marketing, the term atmospherics is used to describe the discipline of designing commercial spaces. Atmospherics was coined by Philip Kotler in a 1973 article in the Journal of Retailing. Kotler argues that the tangible product is only a small part of the total consumption package. Buyers sense the total product, which includes services, warranties, packaging, advertising, financing, pleasantries, images and so on. Atmospherics covers three major art forms important to retail: architecture: exterior structure, interior design, and the design of window displays. The atmosphere of a commercial space performs three functions: creating attention, messages (communication) and affect.
2.3.3 Access
Access refers to the availability for people to reach other persons, activities, resources, services, information, or places, not only the quantity but also the diversity of the elements that can be achieved. In order to encourage more people to participate the activities to increase the vibrancy on site. The built environment must provide the accessibility function for the ease of access to people, activities, and resources. It mainly concerns the human demand of access mention by Lynch, also connected to other demands as well.
different people and businesses that can afford different levels of rents. Moreover, there should be a dense concentration of people, including residents, to promote visible city life.
Moreover, the fourth requirement of Jacobs is about permeability - the blocks size should be small to increase path options between people's origins and destinations, normally, enhance social and economic development. The concept of permeability is captured partly by the level of connectivity of street networks. According to Benfiel et al., (1999), better permeability could enhance the easiness of traveling, thus increasing the probability of using alternative travel modes such as biking, walking or taking the transit. Also, a large body of studies has indicated that proximity to effective, safe and convenient public transport would lead to more travel to the site by walking.
2.3.4 Endogenous and exogenous confounding factors
This model has various endogenous and exogenous confounding factors that might affect the urban vibrancy in places but is not addressed in most of the previous literature. For endogenous factors, the main issue I consider would be the interaction effect of each factor because they don’t performed independently in reality. For exogenous confounding factors, they can be divided into two levels, the regional context that is much beyond the scale of each site and personal social-economic status/preference that much more detailed than the scale of site.
combined in practice in a general sense. He notices the potential conflicts between them, but no theory is proposed to take it further. Without that rank or sequencing, the theory can only link the built environment to the human demands, not the “human value” he claimed. Montgomery (1998) stress that it is essential to consider form, activity, and image in tandem because each should reinforce the other. He did not discuss this further too. A similar issue occurs in Gehl(1987) and Whyte(1980) too. Condon (2012) and Jacobs (1961)’s solution is embracing all the strategies they mention. Condon calls the rule “love one rule, love them all” and Jacobs call it “all are necessary.”
I would argue that the endogenous factor can be addressed, it makes exogenous factor become impossible to be included. Implementing all strategies in any case at any place is unrealistic. Further efforts should be made to answer which strategy or pattern would work best in which kind of situation context. Their discussion of each rule is slightly over-simplified and often isolated from other factors. “Love them all” is a too simple answer to handling the complex landscapes in the city.
The regional context issue refers to the interaction of endogenous factor with external context. For instance, in the book of Christopher et al. (1977), I think the vibrancy spirit in the urban environment of the book falls into the same limitation of the spirit in the Arts and Crafts Movement in the U.S.A. during the 1910s and 1920s. Both ideas have a naïve undergoing assumption lying behind - When space is fixed, everything about the quality of life is fixed. But we live in a world of “complex system” that every element should be considered contextualized. This is a fundamental view of the world. Space is only part of it, not all of it.
Whyte’s most case study focus only in New York- the most walkable and dense city in U.S. The representativeness of these sites clearly is not good enough to make universal inference.
The personal socio-economic factor is more complicated. Jacobs (1961) mentioned some social effect on the urban vibrancy from the perspective of a self-destructive factor, deadening influence of massive single elements in cities, population instability as an obstacle to diversity growth, and effects of public and private money. The self-destruction of successful districts occurs by ousting less affluent dwellers and businesses. She as well as Condon (2010) also mentioned social policy of affordable housing to increase the diversity of people in the community. Whyte (1980) criticize the phenomenon that some low-income visitors are treated as “undesirable” factor by the owner of the public space, which damages the urban vibrancy. Also, the analysis of it would be highly dependent on the availability of the data.
2.4 Measures of Urban Form and Urban Vibrancy in Big data era
2.4.1 Urban Form Measures
How the built environment would influence, the human behavior has been discussed in urban planning field for a long time by multiple discipline but can be placed in two categories: place-making and transportation.
(1984) proposed a normative theory framework for good urban form that includes vitality, sense, fit, access, control, efficiency, and justice. Jan Gehl (1987) performed a deeper analysis of this relationship between urban form and human activity by categorizing activities into three sub-types: necessary activities, optional activities, and social activities. He suggested that optional and social activities are more influenced by the built environment than necessary activities; Gehl attributes this difference to the compulsory nature of necessary activities. Montgomery (Montgomery, 1998) summarized existing literature and proposed twelve physical conditions for good placemaking. Metha (V. Mehta, 2007) applied a similar method as Whyte to record street life in Boston and found that people are equally concerned with the social, land use, and physical aspects of streets.
In recent years, scholars also explore the relationship between built environment and human activity in space from travel or physical activity perspectives. Cervero and Kockelman (1997) first examined the connection between the density, diversity, density factors of the built environment and travel demand. This framework has been refined in later studies by incorporating destination accessibility, distance to transit, and demographic factors into research. It later developed into the “6Ds” theory that has been supported by more than 50 studies (Reid Ewing & Cervero, 2010b). Ewing et al. (2015) measured twenty streetscape features for 588 blocks in New York City to exam their association with walking behavior. They found three features of them are significantly and positively associated with pedestrian count on the street. Handy et al.(2002b) provided a theoretical framework for how the built environment influences physical activity patterns that have been supported by subsequent research (Brownson, Hoehner, Day, Forsyth, & Sallis, 2009; Reid Ewing, Schmid, Killingsworth, Zlot, & Raudenbush, 2008; Hoehner, Brennan Ramirez, Elliott, Handy, & Brownson, 2005; Popkin, Duffey, & Gordon-Larsen, 2005)
multi-discipline, multi-scale, multi-resolution phenomenon (Cutsinger et al., 2005, Clifton et al.,2008 , Ewing et al., 2002 ,Frenkel and Ashkenazi, 2008,, Jaeger et al., 2010, and Torrens, 2008). Meanwhile, urban vibrancy is a concept that built across multi-disciplines, which complicates relative exploration on the relationship with the built environment. This discussion tries to propose relevant urban form measurements at a different scale and to draw a conceptual framework on the association between urban form and urban vibrancy in the multi-dimensional perspective. For the research of urban vibrancy using new data sources, I believe this change of data will lead to a profound fusion of all different measurement metric from all disciplines. Due to this trend of fusion, I simplified the Clifton et al. (2008) five dimension geographical into 3 dimensions as the equation shown below – city level that much beyond the place and neighborhood scale ,community level that at the place and neighborhood scale and street level that refers to . Then will take an inter-discipline review for each of them.
𝑽𝒊𝒃𝒓𝒂𝒏𝒄𝒚 = 𝒇(𝑭𝒐𝒓𝒎𝒄𝒊𝒕𝒚, 𝑭𝒐𝒓𝒎𝒄𝒐𝒎𝒎𝒖𝒏𝒊𝒕𝒚, 𝑭𝒐𝒓𝒎𝒔𝒕𝒓𝒆𝒆𝒕, 𝑬)
E represents all the other the exogenous and endogenous factors. The detail review of factor is shown in the Appendix.
2.4.2 Urban Vibrancy Measures
To measure the urban vibrancy, the method need to approach form the three components of vibrancy proposed in this article. Except the human demand is generally unobservable, there are plenty of studies exploring methods to measure human activities and image to discuss urban vibrancy or related topics.
2.4.2.1 Activities
be unreliable because it heavily relies on human memory. As Cook and Campbell (1979) pointed out, people tend to report what they believe a researcher expects to see or reports what reflects positively on their own abilities, knowledge, beliefs, or opinions. Another concern about self-reported data centers on whether subjects can accurately recall past behavior. Cognitive psychologists have warned that the human memory is fallible (Schacter, 1999); therefore, the reliability of self-reported data is tenuous. User-generated content on social media can also be considered as a type of self-reported data; however, this information is recorded immediately and therefore is less likely than traditional self-reported data to be affected by researchers or human memory.
Another type of information recording human activity would be observational data. But in this method, investigators must survey, observe, and record on-site to track behavior, which makes it limited in time and scale. William Whyte (Whyte, 1980) tried to improve on this process by using time-lapse photography; however this technique still requires people to detect and analyze all pictures taken in the study; furthermore, research through time-lapse photography is still limited to daytime and, at most, the community scale. Collecting data from social media websites can address the deficiencies of the traditional data collection method; it allows researchers to collect data that is being produced during all hours of the day from around the world with detailed locational information.
to collect because most of them are too trivial to recall. Geo-tagged twitter data could serve as a proxy to observe such activities, because tweeting is a completely optional behavior, people has to stay at a place to post those messages, it comes from our desire for social communication with other people. Therefore, it could offer us more understanding of how to make a lively place.
2.4.2.2 Image
The urban vibrancy can also be observed through the subjective perception in our mind. There have been few studies directly focused on measuring vibrancy perception directly. However, many kinds of research for the related concept has been discussed, such as liveliness, satisfaction, attractiveness, happiness. The methods for measuring such perception can generally be categorized into two types: Perception survey and visual preference survey
the same time can introduce more bias because outcomes may be correlated with measurement error on the independent variable (i.e., the same-source bias problem).
An alternative method is neighborhood audits / visual preference survey, which is mainly conducted by field interview or expert panel. In a visual preference survey, individuals are shown images or video of the environment and asked to reveal their perception for whether they view the place as safe, attractive, clean, etc. (Clifton, Livi Smith, & Rodriguez, 2007;Ewing & Clemente, 2013; Ewing & Handy, 2009; Harvey, Aultman-Hall, Hurley, & Troy, 2015; Hoehner et al., 2005; S. Lee & Talen, 2014). Neighborhood audits enable researchers to define theoretically relevant measures and allow assessment of reliability and validity. However, audits are time-consuming and expensive to conduct largely due to the costs of travel; as a result, they are typically limited to small, geographically circumscribed study areas. Audits may also be perceived by residents as intrusive, and can involve safety problems for research staff. Some studies have conducted neighborhood “windshield surveys” in which researchers drive through a neighborhood to make observations, sometimes recording videotape for later coding. Windshield surveys may reduce concerns about the safety of research staff, but coding neighborhood characteristics from a moving vehicle provides less detail than coding on foot. Although videotape recording allows more detailed and careful coding, it also increases costs substantially.
also not applicable for large-scale study with big sample size.
2.4.3 Big Data and Deep Learning Innovations for Vibrancy Studies
2.4.3.1 Urban form
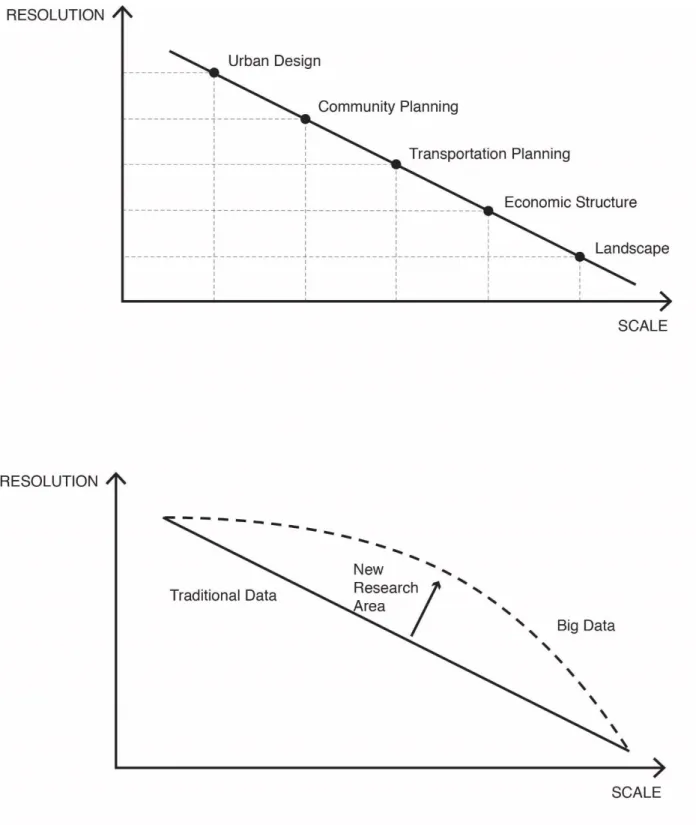
The measurement of urban form is highly dependent on the nature of data sources (Clifton et al., 2008). Therefore, the recent trend of big data and open data will inevitably propose more opportunities for this topic. First is the trend of releasing open data by many governments such as New York, Chicago offers the public much valuable information to recognize the city. Second, with the spread of GPS and smartphone devices, more and more information is provided with geotags to report the samples exact locations. The change is shown in the equation below.
D = Sg∗ St∗ Rg∗ Rt
The first chart in Figure 2.5 shows how each discipline are isolatedly associated with the resolution and scale of the data, summarized from Clifton et al. (2008)’s research. Therefore, traditionally economic research usually won’t use the measure of urban design because the scale is too small. Vice versa because the resolution would be too low. However, as shown in the second figure, the feature of big data offered research the data with high resolution and scale at the same time, such as geo-tagged social media will have exact geo-location and exact send time. Thus, when using the new data sources for urban studies, the requirement of each discipline’s metric would be satisfied at the same time, offering opportunities of the new research area.
2.4.3.2 Activities
In general, the researches using the newly emerged social media data has suggested our online behavior data is related to our real-world activity, however, there are few studies that have attempted to use this big data from empirical perspective to discuss its relationship with built environment. In contrast, many empirical planning studies that focusing the relationship between built environment and human behavior are limited by their traditional data sources. Therefore, this paper attempts to increase our understanding on the association between the built environment and human behavior by using social media data in ways that using traditional survey data cannot achieve.
noticed this new behavior and the considerable potential of its data to transform traditional analytics; some refer to the phenomenon of posting geotagged data as “volunteered geographical information” (Goodchild, 2007).
The field of urban planning has also recognized the potential benefits of using social media data to study human activity. Evans-Cowley (2011) analyzed information posted on Twitter to facilitate public participation for the Strategic Transportation Mobility Plan (STMP) of Austin, Texas. Schweitzer (2014) examined sentiment towards public transit on social media websites like Twitter and how sites like Twitter influence the tone of public comments. Lansley and Longley (2016) classified geotagged tweets from Inner London to provide geo-temporal Twitter profiles of behavioral and social attitudes. Nadai et al. (2016) used mobile phone data to test Jane Jacobs’s four urban form conditions for urban vibrancy and found those conditions to be indeed associated with urban life.
2.4.3.3 Images
REFERENCES
Alañón-Pardo, Á., & Arauzo-Carod, J. M. (2013). Agglomeration, accessibility and industrial location: Evidence from Spain. Entrepreneurship and Regional Development, 25(3–4), 135–173. http://doi.org/10.1080/08985626.2012.710263
Alexander, C. (1977). A pattern language: towns, buildings, construction. Oxford university press.
Alexander, C. (1979). The Timeless Way of Building. New York Oxford University Press. http://doi.org/10.1080/00918360802623131
Arnold, H. F. (1980). Trees in urban design. Retrieved from https://www.cabdirect.org/cabdirect/abstract/19810674072
Banerjee, T. (2001). The future of public space: Beyond invented streets and reinvented places. Journal of the American Planning Association, 67(1), 9–24. http://doi.org/10.1080/01944360108976352
Batty, M. (2013). Big data, smart cities and city planning. Dialogues in Human Geography, 3(3), 274–279. http://doi.org/10.1177/2043820613513390
Brownson, R. C., Hoehner, C. M., Day, K., Forsyth, A., & Sallis, J. F. (2009). Measuring the Built Environment for Physical Activity. State of the Science. American Journal of Preventive Medicine. http://doi.org/10.1016/j.amepre.2009.01.005
Calthorpe, P. (1993). The next American metropolis: Ecology, community, and the American dream. Princeton architectural press.
Campbell, A., Converse, P. E., & Rodgers, W. L. (1976). The quality of American life : perceptions, evaluations, and satisfactions. Russell Sage Foundation.
Canter, D. (1977). The Psychology of Place.
Carr, S., Francis, M., Rivlin, L. G., & Stone, A. M. (1992). Public space. Cambridge University Press (Vol. 40). http://doi.org/10.1007/s11007-006-9038-x
Cervero, R., & Kockelman, K. (1997). Travel demand and the 3Ds: Density, diversity, and design. Transportation Research Part D: Transport and Environment, 2(3), 199–219. http://doi.org/10.1016/S1361-9209(97)00009-6
Christopher, A., Sara, I., & Murray, S. (1977). A Pattern Language: Towns, Buildings, Construction.
Ciccone, A., & Hall, R. E. (1996). Productivity and the Density of Economic Activity. American Economic Review, 86(1), 54–70. http://doi.org/10.1126/science.151.3712.867-a
Cozens, P. M. (2008). New urbanism, crime and the suburbs: A review of the evidence. Urban Policy and Research. http://doi.org/10.1080/08111140802084759
Crampton, J. W., Graham, M., Poorthuis, A., Shelton, T., Stephens, M., Wilson, M. W., & Zook, M. (2013). Beyond the geotag: Situating “big data” and leveraging the potential of the geoweb. Cartography and Geographic Information Science, 40(2), 130–139. http://doi.org/10.1080/15230406.2013.777137
Cutsinger, J., Galster, G., Wolman, H., Hanson, R., & Towns, D. (2005). Verifying the multi-dimensional nature of metropolitan land use: Advancing the understanding and measurement of sprawl. Journal of Urban Affairs, 27(3), 235–259. http://doi.org/10.1111/j.0735-2166.2005.00235.x
Davidson, N. M., & Infranca, J. J. (2016). The Sharing Economy as an Urban Phenomenon. Yale
Law & Policy Review, 34(2), 215–279. Retrieved from
http://search.ebscohost.com/login.aspx?direct=true&db=afh&AN=118436221&site=ehost-live
Duany, A., & Talen, E. (2002). Transect planning. Journal of the American Planning Association, 68(3), 245–266. http://doi.org/10.1080/01944360208976271
Dubey, A., Naik, N., Parikh, D., Raskar, R., & Hidalgo, C. A. (2016). Deep learning the city: Quantifying urban perception at a global scale. In Lecture Notes in Computer Science (including subseries Lecture Notes in Artificial Intelligence and Lecture Notes in Bioinformatics) (Vol. 9905 LNCS, pp. 196–212). http://doi.org/10.1007/978-3-319-46448-0_12
Ewing, R., & Cervero, R. (2010). Travel and the Built Environment: A Meta-Analysis. Journal of the American Planning Association, 76(3), 1–30. http://doi.org/10.1080/01944361003766766
Ewing, R., & Handy, S. (2009). Measuring the unmeasurable: Urban design qualities related to walkability. Journal of Urban Design, 14(1), 65–84. http://doi.org/10.1080/13574800802451155
Ewing, R., Schmid, T., Killingsworth, R., Zlot, A., & Raudenbush, S. (2008). Relationship between urban sprawl and physical activity, obesity, and morbidity. In Urban Ecology: An International Perspective on the Interaction Between Humans and Nature (pp. 567–582). http://doi.org/10.1007/978-0-387-73412-5_37
Florida, R. (2004). The Rise of the Creative Class.
Frank, L. D., & Engelke, P. O. (2001). The Built Environment and Human Activity Patterns: Exploring the Impacts of Urban Form on Public Health. Journal of Planning Literature, 16(2), 202–218. http://doi.org/10.1177/08854120122093339
Gehl, J. (1971). Life between buildings: using public space Copenhagen.
Gehl, J. (1987). Life Between Buildings: Using Public Space. The City Reader.
Gibson, J. (1979). The Ecological Approach to Visual Perception. Retrieved January 20, 2018,
from
https://books.google.com/books?hl=zh-CN&lr=&id=8BSLBQAAQBAJ&oi=fnd&pg=PP1&dq=The+Ecological+Approach+to+Visual+
Perception ,
1979&ots=zOv79Nwn5w&sig=Rs-T7mSCqeorVXxOX-Cd1kksMsU#v=onepage&q=The%2520Ecological%2520Approach%2520to%2520Visual%252 0Perception%25EF
Gieseking, J. J., Mangold, W., Katz, C., Low, S., & Saegert, S. (2014). The People, Place, and Space Reader. Google Books, (June 2016), 168–172. http://doi.org/10.4324/9781315816852
Gottlieb, P. D., & Fogarty, M. (2003). Educational attainment and metropolitan growth. Economic Development Quarterly, 17(4), 325–336. http://doi.org/10.1177/0891242403257274
Handy, S. L., Boarnet, M. G., Ewing, R., & Killingsworth, R. E. (2002). How the built environment affects physical activity: Views from urban planning. American Journal of Preventive Medicine, 23(2 SUPPL. 1), 64–73. http://doi.org/10.1016/S0749-3797(02)00475-0
Hester, R. T. (1975). Neighborhood space. Dowden Hutchinson and Ross.
Hoehner, C. M., Brennan Ramirez, L. K., Elliott, M. B., Handy, S. L., & Brownson, R. C. (2005). Perceived and objective environmental measures and physical activity among urban adults. In American Journal of Preventive Medicine (Vol. 28, pp. 105–116). http://doi.org/10.1016/j.amepre.2004.10.023
Hogan, M. J., Leyden, K. M., Conway, R., Goldberg, A., Walsh, D., & McKenna-Plumley, P. E. (2016). Happiness and health across the lifespan in five major cities: The impact of place and government performance. Social Science and Medicine, 162, 168–176. http://doi.org/10.1016/j.socscimed.2016.06.030
Jacobs, J. (1961). The Death and Life of Great American Cities. In New York (Vol. 71, p. Alexander, C., Ishikawa, S., Silverstein, M. (19). http://doi.org/10.2307/794509
Jaffe, A. B., Fogarty, M. S., & Banks, B. A. (2003). Evidence from Patents and Patent Citations on the Impact of NASA and Other Federal Labs on Commercial Innovation. The Journal of Industrial Economics, 46(2), 183–205. http://doi.org/10.1111/1467-6451.00068
Jaffe, A. B., Trajtenberg, M., & Henderson, R. (1993). Geographic Localization of Knowledge Spillovers as Evidenced by Patent Citations. The Quarterly Journal of Economics, 108(3), 577– 598. http://doi.org/10.2307/2118401
Jofre-Monseny, J., Marín-López, R., & Viladecans-Marsal, E. (2011). The mechanisms of agglomeration: Evidence from the effect of inter-industry relations on the location of new firms. Journal of Urban Economics, 70(2–3), 61–74. http://doi.org/10.1016/j.jue.2011.05.002
Kelly, J., Ruther, M., Ehresman, S., & Nickerson, B. (2017). Placemaking as an Economic Development Strategy for Small and Midsized Cities. Urban Affairs Review, 53(3), 435–462. http://doi.org/10.1177/1078087416657895
Kim, J., & Kaplan, R. (2004). Physical and Psychological Factors in Sense of Community. Environment and Behavior, 36(3), 313–340. http://doi.org/10.1177/0013916503260236
innovation. Innovation, (May), 1–39. Retrieved from http://www.creativeclass.com/rfcgdb/articles/Urban_Density_Creativity_and_Innovation.pdf
Kotler, P. (1973). q as a marketing tool. Journal of Retailing, vol: 49 (4, pp: 48-65. Retrieved from http://belzludovic.free.fr/nolwenn/Kotler - Atmospherics as a marketing tool (cité 171) - 1973.pdf
Lennard, H., Crowhurst, H., & Lennard, H. L. (1993). Urban space design and social life. Companion to Contemporary Architectural Thought, 39-43.
Lynch, K. (1960). The Image of the City. Retrieved January 20, 2018, from
https://books.google.com/books?hl=zh-CN&lr=&id=_phRPWsSpAgC&oi=fnd&pg=PA1&dq=Lynch+1960&ots=jHz77g3Gmm&sig=Ft Yq3gzWGdxx1j5gdkY1J8w7W6A#v=onepage&q=Lynch 1960&f=false
Lynch, K. (1981). A theory of good city form. Retrieved January 20, 2018, from http://www.openbibart.fr/item/display/10068/1196183
Lynch, K. (1984). Good city form. City. Retrieved from http://www.amazon.co.uk/Good-City-Form-K-Lynch/dp/0262620464
Lynch, K. (1984). Good city form. City. Retrieved from http://www.amazon.co.uk/Good-City-Form-K-Lynch/dp/0262620464
McHarg, I. L. (1969). Design with nature. Design. http://doi.org/10.1111/j.1399-0004.2010.01592.x
Mehta, V. (2007). Lively streets: Determining environmental characteristics to support social behavior. Journal of Planning Education and Research, 27(2), 165–187. http://doi.org/10.1177/0739456X07307947
Mehta, V. (2013). The street: A quintessential social public space. The Street: A Quintessential Social Public Space. http://doi.org/10.4324/9780203067635
Montgomery, J. (1998). Making a city: Urbanity, vitality and urban design. Journal of Urban Design, 3(1), 93–116. http://doi.org/10.1080/13574809808724418
start-ups in the United States. Regional Studies, Regional Science, 4(1), 232-246.
Oldenburg, R. (1989). The Great Good Place. The Great Good Place, 368. Retrieved from http://books.google.com/books?id=0aOjHGdSKLMC
Popkin, B. M., Duffey, K., & Gordon-Larsen, P. (2005). Environmental influences on food choice, physical activity and energy balance. Physiology & Behavior, 86, 603–613. http://doi.org/10.1016/j.physbeh.2005.08.051
Puga, D. (2010). The magnitude and causes of agglomeration economies. Journal of Regional Science, 50(1), 203–219. http://doi.org/10.1111/j.1467-9787.2009.00657.x
Punter, J. (1991). Participation in the design of urban space. Landscape Design, 200(1), 24-27.
Reid Ewing, Amir Hajrasouliha, Kathryn M. Neckerman, Marnie Purciel-Hill, W. G. (2015). Streetscape Features Related to Pedestrian Activity. Journal of Planning Education and Research, 1. http://doi.org/10.1177/0739456X15591585
Relph, E. (1976). Place and placelessness (Vol. 1). Pion.
Russell, J. A., Ward, L. M., & Pratt, G. (1981). Affective quality attributed to environments: A factor analytic study. Environment and Behavior, 13(3), 259–288. http://doi.org/10.1177/0013916581133001
Salesses, P., Schechtner, K., & Hidalgo, C. A. (2013). The Collaborative Image of The City: Mapping the Inequality of Urban Perception. PLoS ONE, 8(7). http://doi.org/10.1371/journal.pone.0068400
Sedgley, N., & Elmslie, B. (2004). The geographic concentration of knowledge: Scale, agglomeration, and congestion in innovation across U.S. states. International Regional Science Review, 27(2), 111–137. http://doi.org/10.1177/0160017603262401
Siegel, D., & Griliches, Z. (1992). Purchased services, outsourcing, computers, and productivity in manufacturing. In Output Measurement in the Service Sectors (pp. 429–460). http://doi.org/10.3386/w3678
https://books.google.com/books?hl=zh-CN&lr=&id=QMhohDJgHIYC&oi=fnd&pg=PR11&dq=Sorkin+1992&ots=xOakTplEq9&sig= XCiJbkgkTUrSbmN90IwMu5ciwyE#v=onepage&q=Sorkin 1992&f=false
Sorkin, M. (1992). Variations on a theme park: The new American city and the end of public space. Macmillan.
Tuan, Y. F. (1977). Space and place: The perspective of experience. U of Minnesota Press.
CHAPTER 3: BUILT ENVIRONMENT AND SOCIAL ACTIVITY: EXPLORING THE RELATIONSHIP BETWEEN PLACE PATTERN AND TWEETING IN CHICAGO 3.1 Introduction
Human activity patterns have consistently evolved with technological advancements. For example, during the past 30 years, the internet and social media have increasingly connected people with each other. Ofcom (2015) reported that internet users older than 16 years spent more than twenty hours online each week; moreover, the amount of time spent online had significantly increased since 2005, when it was estimated at about ten hours per week. A report by Global Web Index (2015) states that a typical internet user spends 1.77 hours per day on social networking websites. This new type of activity, social media behavior, has rapidly become a crucial part of our lives and a behavioral change that researchers cannot ignore.
Improving built environments to better support human activities has become a central goal of urban planning. Lynch and Rodwin (1958) proposed, “understanding the varied effects of different physical forms, and of the locations of human activities in relation to physical form, is or should be the principal analytical skill of the physical planner.” However, with the development of internet and mobile network, social interaction is no longer constrained by the extent of accessibility to physical infrastructure, and people are electronically communicating
by posting messages wherever adequate mobile phone service exists.
fundamentally change society by breaking the historical link between physical location and human social interaction. This notion has been challenged by many scholars (Humphreys 2010; Moores 2012), and, therefore, it would be useful to determine whether and/or how much the spatial components of the built environment matter in the distribution of this new type of human activity. Therefore, this study focused on the following two research questions.
1. If people have the ability to digitally connect from any place and at any time, do the characteristics of the built environment influence social media behaviors?
2. If the characteristics of the built environment relate to the extent of social media behavior, which of those characteristics significantly relate to those behaviors?
This study used geotagged data from Twitter (in this study, Twitter messages are referred to as “tweets” and the behavior is referred to as “tweeting”), a globally popular message-based social networking service. We capitalized on Twitter’s massive amount of publicly available data to improve our understanding of the influence of physical form on human behavior. To that end, we investigated whether the built environment and spatial layout of a city (Chicago) were associated with tweeting, where tweeting spatially clustered, and the characteristics of the built environment closely associated with social networking (tweeting).