Optimizing Transaction Performance in
Adaptive Server
®Enterprise 12.5
A Technical White Paper
Table of Contents
1. Overview ...1
2. Transaction Logging Subsystem ...1
3. Log Device...2
3.1 Selecting the Disk Device ...2
3.2 Log Page Size ...2
3.3 Log on a Separate Database Device ...3
3.4 Guidelines for Configuring Log Disks ...3
4. Log Cache Configuration ...3
4.1 Configuring the Log I/O Size ...4
4.2 Guidelines for Configuring Log Cache...5
5. User Log Cache ...5
5.1 Guidelines for Configuring the User Log Cache ...6
6. Advanced ASE Logging Feature ...6
1. Overview
The transaction logging subsystem is one of the most critical components of a database server. To be able
to accomplish the goal of providing recoverability of databases, transactions write log records to persistent
storage. Since a number of such log record writes is directly dependent on the number of executing
transactions, the logging system can potentially become a bottleneck in high throughput OLTP
environments. All the users working on a particular database share the log; thus, to guarantee high
performance of the application, it is essential for the DBA to monitor and configure the log to provide for
best throughput and response time of the application. Out-of-the-box, Adaptive Server Enterprise (ASE)
already provides a high performance logging subsystem that scales to thousands of users and very large
database (VLDB) environments. ASE also provides options for the DBA to customize the logging subsystem
to satisfy their unique environments for best throughput and response times.
There are two aspects of optimizing the logging subsystem.
1. To follow the best practices in writing SQL applications to use the logging subsystem efficiently.
2. To configure and tune the logging subsystem to get the best performance out of it.
The former is the responsibility of application designer while the later is the responsibility of the database
administrators. In this paper we discuss only the aspects pertaining to system configuration, which is the latter
part.
ASE provides a rich set of options to monitor and configure the logging subsystem for high throughput OLTP
systems. Apart from implementing various cutting edge solutions to resolve logging contentions, ASE allows
the administrator to fine tune the logging subsystem to suit the application behavior and requirements. In this
paper, we present the ASE logging subsystem architecture and explain how one can monitor and tune the
subsystem to get the best performance out of it.
2. Transaction Logging Subsystem
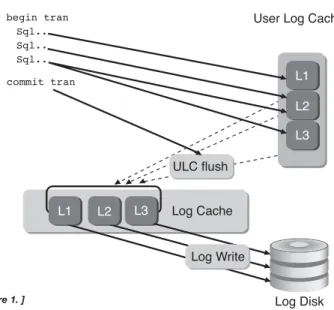
Figure 1 illustrates how traditional logging is done in ASE. Each user task has a private log cache, which it uses
to save the log records during transaction processing. This is known as the User Log Cache (ULC). The User
Log Cache is private to the task and not visible to other tasks. ULC eliminates the need to insert every log
record to the shared log cache. This resolves a major contention that would have otherwise been caused by
every task trying to insert their log record into the shared log cache. Figure 1 shows that the user transaction
has populated 3 log pages, L1-L3 in the ULC.
During the commit operation, these pages are first transferred to the shared log cache. To do so, the user task
acquires a lock guarding the end of the log and then copies the contents of the ULC to the shared log cache.
This is the only time tasks contend to acquire lock on the log. This operation is known as ULC flush. Once the
flush is complete, the task releases the log lock and then proceeds to write these pages to the disk. It does so by
walking through all the dirty pages in the shared log cache and issuing writes on those pages. Once the writes
complete the task returns indicating the completion of the "commit" operation. In case of transaction abort or
system crash, the log will be read to perform undo operations to reverse any modification caused by this
transaction.
There are three kinds of resources involved in the transaction logging subsystem. They are:
• Log Device • Shared Log Cache • ULC
It is essential to understand how these resources are consumed and manipulated, so that one can configure
them properly.
3. Log Device
It is vital for the response time and throughput of an application to properly configure the log device. One of
the main characteristics of logging, is that data is written in a sequential fashion.
3.1 Selecting the Disk Device
Log disks demand faster response time than the data devices. It is best to have log disk service time well under
5 milliseconds. With the ever increasing speed of CPUs, OLTP applications can hit the throughput ceiling very
quickly with a slow log disk. Here are some of the best practices to follow while choosing the log disk.
• RAID 0/1 array with controller having NV RAM to cache the write data
• Stripe size of the RAID being same or less than log page size (i.e. if log page size is 2K, you can have stripe size being 2k or 1k)
• For best results, the log should be kept on a separate physical disk. Since data access is random in nature, mixing log and data together can cause excessive disk arm movement. Such irregular arm movements can result in longer latency and service time. Any delay in writing log pages can cause critical resources like locks held for longer time
• It is recommended to use ‘raw devices’ instead of file systems to host logs. By its nature, log is a write intensive device and file system performs poorly when there are more writes than reads
• It is recommended to keep the log device under a separate controller to eliminate any operating system or device contention
3.2 Log Page Size
Selecting database page size has a direct impact on the performance, because of its direct influence on the
number of log pages generated. If server page size is 2k and if each transaction generates a large number of log
pages, then the server will be issuing too many log page writes. In such cases, increase the page size to see if the
number of I/Os (including the log page) go down. It is very important to note that by increasing the page size
for the database, we not only affect the I/O on the log pages, but also on the data pages.
On the other hand with a large page size, if the system is not writing enough log records to fill the log page, then
the server may be issuing writes on the last log page more than once. Writing a half-filled last log pages can cause
context switches to the task. The ASE logging system has group commit algorithm in place to reduce the number
of such partial writes on the last log page. But if the page fills too slowly, then it is not practical to delay writing
the last log page until it is completely filled. So, it is essential to pick the proper page size based on the rate at
which the log pages are filled.
3.3 Log on a Separate Database Device
Transaction log writes occur frequently so it is imperative that the log device does not contend with other I/O in
the database, which is typically random in nature. It is recommended that log be kept on a separate database
device backed by an isolated disk underneath. Keeping data and log on the same device can result in:
• Writes mixed with reads
• Irregular write pattern causing longer disk latency
• Server issuing writes to ensure consistency when trying to maintain log and data on the same device
3.4 Guidelines for Configuring Log Disks
• Make sure that log disk is isolated from other data disks and has optimal response time; it is recommended to have a hardware level redundancy to ensure recoverability (ex. Hardware RAID 0/1)
• Select appropriate database page size based on the transaction throughput and number of log pages generated by individual transactions
• Always keep log on separate database device
4. Log Cache Configuration
The log cache represents the working set of log pages in memory. If no named cache were configured for the
transaction log, the log pages would reside in the "default data cache". However, having the log pages reside in the
default data cache can result in poor response time under a high throughput OLTP environment. This is
because the log pages may replace data pages residing in the cache. To avoid such I/Os, it is recommended to bind
log to its own cache and keep it separate from the data pages. The following snippet shows how it can be done.
First, configure a cache for the log by putting the following options in the server configuration file:
[Named Cache:log_cache] cache size = <SIZE> cache status = log only cache replacement policy = DEFAULT local cache partition number = 1
Bind the cache to the log by doing the following:
sp_bindcache "log_cache", <DBNAME>, "syslogs" go
Note, that the database has to be put in "single user" mode and checkpoint needs to be issued once this
option is set.
Size of the log cache depends on the transaction rate and the response time for rollbacks. Larger cache size will
help to reduce the transaction rollback response time, as it can potentially cache a large part of the log pages
required for the rollback.
4.1 Configuring the Log I/O Size
Log I/O size specifies the unit of I/O on the transaction logs. To accomplish a particular unit of log I/O, the
cache for the transaction log would need to be configured with the appropriate pool size. In general, high
throughput OLTP systems stand to benefit doing larger units of I/O for the transaction log. ASE provides an
easy mechanism to configure a different I/O size for the log independent of I/O size for data pages.
The following section provides some guidelines on how to determine the ideal log I/O size for a production
environment. Running sp_sysmon against the production system can provide clues on what needs to be done.
Based on the report generated by sp_sysmon, one can make inferences on tuning the log I/O size.
• Increase the log I/O size if:
- The log device is overloaded because the server is issuing too many writes; with large I/O size, multiple writes are coalesced to a single write request
- Throughput is a very important requirement and the Group commit logic is effective; look at the "Last Log Page Writes" in the taskmgmt section of sp_sysmon, and ensure that all the values are relatively low.
Task Management per sec per xact count % of total --- -- ---Task Context Switches by Engine 0
Last Log Page Writes 13.8 0.01 256 0.05 %
- There are stringent response time requirements and the system throughput is also high, then in such cases ensure that there are sufficient CPU resources available to ensure group commit works well; for more information on this please refer to "Task Management" section under the chapter "Monitoring Performance with sp_sysmon" in the Performance & Tuning manual
• Decrease the log I/O size if:
- The transaction profile section of sp_sysmon indicates a low transaction rate
- Response time is a very critical requirement for the application and throughput is not as important. One should ensure that the I/O subsystem has enough bandwidth to be able to handle the extra I/O. If not, decreasing the log I/O size could potentially cause response time degradation
- The value of "Avg # writes per log page" sp_sysmon report is much higher than the minimum possible value (e.g. 0.5 in the case of 2k server page size where log I/O is configured to be 4k)
To be able to increase the log I/O size the following steps are to be followed.
a. Configure a buffer pool whose buffer size is the same as the desired log I/O size. The following example
shows how to configure a 4k buffer pool of 50M size on a log cache named ‘log_cache’:
[Named Cache:log_cache] cache size = 100M cache status = log only cache replacement policy = DEFAULT local cache partition number = 1
[4K I/O Buffer Pool] pool size = 50M wash size = 4000 K local async prefetch limit = DEFAULT
b. After creating the buffer pool, the I/O size for the log can be configured as follows:
1> use mydb 2> go
1> sp_logiosize "4K" 2> go Log I/O size is set to 4 Kbytes. The transaction log for database 'mydb' will use I/O size of 4
Kbytes.
(return status = 0)
The default log I/O size for a 2K page sized server is 4K. So, if a 4K pool exists for the default data cache when
no named cache exists for the transaction log or for the named cache to which the transaction log is bound,
the server will automatically perform 4K log I/O.
4.2 Guidelines for Configuring Log Cache
The following section provides a general set of guidelines on configuring the log cache for best results.
1. For high throughput OLTP databases, it is recommended to dedicate a named cache to the transaction log
of the database.
2. It is also recommended to have a large I/O pool for the named cache. The default log I/O size for a 2K
page sized server is 4K. So having a 4K pool would help improve the log I/O performance under certain
scenarios which were explained earlier.
3. If the application is sensitive to rollback response time, then it is important to take that into account while
sizing the named cache and the associated buffer pools.
4. If the applications use triggers that reference inserted and deleted tables extensively, that would also play a
role in sizing the named cache.
5. If the application performs deferred mode updates frequently, then the named cache size for the
transaction log should take that into account.
5. ULC
There is one user log cache for each configured user connection. ASE uses these user log caches to buffer the
user transaction log records, which reduces the contention at the end of the transaction log especially for SMP
systems. When a user log cache becomes full or when another event occurs (such as when the transaction
completes), ASE "flushes" all log records from the user log cache to the database transaction log. The server
configuration parameter, "user log cache size" controls the size of ULC allocated for each user connection.
This option can be changed by editing the configuration file or by using the sp_configure interface as shown
below.
[User Environment]
user log cache size = 4096 user log cache spinlock ratio = DEFAULT
or
1> sp_configure "user log cache size",4096 2> go
Parameter Name Default MemoryUsed ConfigValue RunValue Unit Type --- -- --- ----user log cache size 2048 0 4096 2048 bytes static
5.1 Guidelines for Configuring the ULC
To determine the correct size for the user log cache, identify the maximum number of log records written by
the applications transaction and configure the ‘user log cache size’ to that value. The ULC size should also be
validated, by running sp_sysmon during the representative workload. If the value for "ULC Flushes to Xact
Log" is high on account of "by Full ULC" then increasing the "user log cache size" would help. In the following
snippet, the percentage of ULC flushes on account of the ULC being full is 70%, so increasing the ULC size in
this case would help.
ULC Flushes to Xact Log per sec per xact count % of total --- --- --- --- --- by Full ULC 21.0 55.0 5435 70.0 %
If there is a high percentage of "ULC Flushes to Xact Log" on account of "By change of database", it would
help to see if the application can potentially use a single database.
ULC Flushes to Xact Log per sec per xact count % of total --- --- --- --- ---
by change of database 13.0 30.0 4356 57.0 %
If there is a high percentage of "ULC Flushes to Xact Log" on account of "By Other", one of the potential
causes could be on account of having a number of row locked tables. Selectively identifying tables, which
require row level locking scheme using sp_object_stats and having page level locking scheme for the remaining
tables, could potentially alleviate this problem.
ULC Flushes to Xact Log per sec per xact count % of total --- --- --- --- ---
by Other 0.0 0.0 8934 89.0 %
If the "Log Semaphore Requests" waited value is a high percentage, it would help to evaluate some of the
"Advanced ASE logging features" such as "Async Log Service". More details are provided in the "Advanced ASE
logging features" section.
6. Advanced ASE Logging Feature
Sybase ASE has proven time and again as the database server of choice for high throughput OLTP applications
having very stringent response time requirements. Server consolidation and database consolidation are real
trends emerging in the market. Customers are constantly upgrading their hardware from 4-8 CPU systems to
16-32 and even to 64 CPU machines capable of executing millions of transactions for easier management and
lower total cost of ownership. ASE’s architecture keeps pace with the ever-increasing number of CPUs.
Additional CPUs, increases contention on some of the key shared resources such as the log and spinlocks
guarding other key resources. To enable ASE to scale on such state of the art hardware, a new service called
"Asynchronous Logging" is introduced in ASE 12.5.0.3. The core idea of this service is to eliminate the burden
of writing the log data by the user tasks and chartering dedicated threads to write the ULC data to the log
cache and also flushing the log cache to disk. This may improve the performance significantly while
eliminating the log contention almost completely.
To enable the Asynchronous Logging service on a specific database in ASE 12.5.0.3, issue the following command.
sp_dboption <db Name>, "async logging service", "true"
This service should be used if the databases experience all the following symptoms:
• Heavy contention on the last Log page
Log Semaphore Requests
Granted 0.8 2.0 20 20.0 % Waited 3.2 8.0 80 80.0 % --- --- --- ---- ---Total Log Semaphore Req 4.0 10.0 100
• Heavy contention on the cache manager spinlock for the log Cache
Cache: default data cache per sec per xact count % of total --- --- --- --- --- Spinlock Contention n/a n/a n/a 54.0 %
• Log I/O device bandwidth is under utilized
By enabling Asynchronous Logging services on a specific database, two dedicated system threads will now be
chartered to do flushing of User log Cache and writing the log pages from shared log cache to the disk, for that
database. It is not recommended to enable this feature under lighter load conditions or on a system with less than
four CPUs. For more information please refer to ASE 12.5.0.3 Manual under What’s New in ASE 12.5.0.3.
7. Conclusion
An optimal logging subsystem is critical to providing high levels of throughput and to satisfy stringent
response time requirements. This paper has covered the critical aspects of the logging subsystem and
summarized the best practices in tuning each component as:
• Log Device
- Ensure that the I/O response times on the log device are within reasonable bounds
- Do not mix log and data on the same device
• Log Cache
- It is best recommended to configure 4K log I/O for typical high throughput OLTP systems
- Having a separate named cache for the transaction log for high throughput databases is highly recommended
• ULC
- Ensure that the ULC is adequately sized based on the amount of log records each transaction in the application generates
- The ULC can significantly reduce the load on the logging subsystem in highly concurrent OLTP environments
• Asynchronous Logging Service
- Use this feature to address logging contentions on a high throughput OLTP systems running on high-end SMP machines
Sybase ASE has time and again demonstrated exceptional levels of scaling on industry standard benchmarks,
OLTP benchmarks such as TPC-C and other customer benchmarks. This has been made possible largely on
account of efficient and scalable logging in ASE. More detailed information on each of the topics covered in this
Sybase, Inc.
Worldwide Headquarters
One Sybase Drive
Dublin, CA 94568-7902 USA Tel: +800 8 SYBASE www.sybase.com
Copyright ©2003 by Sybase, Inc. All rights reserved. Sybase, the Sybase logo and Adaptive Server are trademarks of Sybase, Inc. All other trademarks are property of their respective owners. ® indicates registration in the United States of America. Specifications subject to change without notice. Some of the functionality described herein may be sold separately. Printed in Canada.
Argentina +5411 4313 4488
Australia +612 9936 8800
Austria +43 1 504 8510
Belgium +32 2 713 15 03
Brazil +5511 3046 7388
Bulgaria +359 2 986 1287
Canada +905 273 8500
Central America +506 204 7151
Chile +56 2 330 6700
China +8610 6856 8488
Colombia +57 1 218 8266
Croatia +385 42 33 1812
Czech Republic +420 2 24 31 08 08
Denmark +45 3927 7913
Ecuador +59 322 508 593
El Salvador +503 245 1128
Finland +358 9 7250 200
France +33 1 41 91 96 80
Germany +49 69 9508 6182
Greece +30 1 98 89 300
Guatemala +502 366 4348
Honduras +504 239 5483
Hong Kong +852 2506 6000
Hungary +36 1 248 2919
India +91 22 655 0258
Indonesia +62 21 526 7690
Israel +972 3 548 3555
Italy
+39 02 696 820 64
Ivory Coast +225 22 43 73 73
Japan +81 3 5210 6000
Kazakstan +7 3272 64 1566
Korea +82 2 3451 5200
Malaysia +603 2142 4218
Mexico +5255 5093 8500
Netherlands +31 20 346 9290
New Zealand +64 4473 3661
Nigeria +234 12 62 5120
Norway +47 231 621 45
Panama +507 263 4349
Peru +511 221 4190
Philippines +632 750 2550
Poland +48 22 844 55 55
Portugal +351 21 424 6710
Puerto Rico +787 289 7895
Romania +40 1 231 08 70
Russian Federation +7 095 797 4774
Slovak Republic +421 26 478 2281
Slovenia +385 42 33 1812
South Africa +27 11 804 3740
South Korea +82 2 3451 5200
Spain +34 91 749 7605
Sweden +46 8 568 512 00
Switzerland +41 1 800 9220
Taiwan +886 2 2715 6000
Thailand +662 618 8638
Turkey +90 212 325 4114
Ukraine +380 44 227 3230
United Arab Emirates +971 2 627 5911
United Kingdom +44 870 240 2255
Venezuela +58 212 267 5670
Asian Solutions Center +852 2506 8700
For other Europe, Middle East, or Africa inquiries: +33 1 41 90 41 64 (Sybase Europe)
For other Asia Pacific inquiries: +852 2506 8700 (Hong Kong)
For other Latin America inquiries: +925 236 6820