ESSAYS ON WHEN MORE IS MORE AND LESS IS LESS: MARKETING INVESTMENTS AND PRODUCTIVITY, FIRM VALUE, AND STOCK MARKET
Chanil Boo
A dissertation submitted to the faculty of the University of North Carolina at Chapel Hill in partial fulfillment of the requirements for the degree of Doctor of Philosophy in the
Kenan-Flagler Business School (Marketing).
Chapel Hill 2016
Approved by: William P. Putsis Tarun Kushwaha Sriram Venkataraman Adam Reed
ii © 2016 Chanil Boo
iii
ABSTRACT
Chanil Boo: Essays on When More is More and Less is Less: Marketing Investments and Productivity, Firm Value, and Stock Market
(Under the direction of William P. Putsis)
Understanding marketing accountability has been of great interest to business scholars and practitioners. To obtain deeper insights, I investigate the links between marketing
investments, marketing productivity, and firm value. I specifically focus on a merger and acquisition where both budget and productivity adjust to align with marketing strategy. I use mergers as a context for the investigation of the dynamic and outcomes of marketing as a
financial investment. As such, the empirical approach and managerial implication are not limited to mergers and acquisitions. The results can be extended to other circumstances, such as
managerial change and any economic or structural shocks (for example, divestitures, IPO, SEO, alliances, and joint ventures) and to other strategic decisions of a firm under the circumstances in which the necessity of aggressive marketing competes with financial inflexibility.
iv
marketing strategy, and a key to this is that marketing delivers relevant information to the investors. However, what studies leave less explored is the empirical measurement and test of information asymmetry that has a decisive effect on marketing investment and firm value. To address this, I estimate the degree and effects information asymmetry has on returns to marketing investments in a merger, a natural setting where information asymmetry is most likely to exhibit the greatest effect on the relation between a firm and investors.
In Essay 2, I design a test and then provide empirical evidence that enhances a discussion as to how marketing managers should allocate their marketing investments, while considering a firm’s marketing productivity and firm value. In particular, the study focuses on two aims: 1) the sources and effects of merger-induced changes in marketing productivity, and 2) the link
between marketing and other functions of a firm in creating competitive advantage. Despite a number of attempts at modeling marketing credibility, comprehensive approaches are lacking duet to several challenges to estimating marketing productivity that researchers face (Dutta et al. 1999; Rust et al. 2004; Narasimhan et al. 2006). The dearth of research in this area is primarily because most studies have only emphasized discrete facets of marketing productivity. As such, empirical analysis, which would provide a marketing manager with holistic assessment and diagnosis and also implementable guidelines, are needed. To address this, I estimate the degree and effects changes in marketing productivity has on firm value in a merger, while providing accounts of multi-faceted aspects of marketing productivity and taking into account the effect of other functional areas such as R&D and operation.
v
vi
ACKNOWLEDGEMENTS
The successful completion of the dissertation process could not have been possible without the support and comprehension of some people.
First of all, I am grateful to my supervisor, Professor William P. Putsis, for his immense guidance and recommendations throughout the process. He inspired me to join this program in the first place and his ongoing encouragement and support were instrumental in my sticking with this through the end. Thank you! To the members of my committee: Tarun Kushwaha, Paige Ouimet, Adam Reed, and Sriram Venkataraman. I am honored to have you serve on my committee and greatly appreciate your unending support, encouragement, and ideas. The high quality meetings have enabled me to conduct the research in a strategic way.
vii
TABLE OF CONTENTS
ABSTRACT ... iii
ACKNOWLEDGEMENTS ... vi
TABLE OF CONTENTS ... vii
LIST OF TABLES ... x
CHAPTER 1 – INTRODUCTION ... 1
1.1 Research Question and Motivation ... 1
1.2 Research Framework ... 2
1.2 Dissertation Structure and Preview ... 4
CHAPTER 2 – ESSAY 1: POST-MERGER RETURNS TO MARKETING INVESTMENTS ... 9
2.1 Introduction ... 9
2.2 Related Literature and Contribution ... 11
The Impact of Mergers on Firm Value ... 12
The Impact of Mergers on Marketing Metrics ... 12
Marketing Assets to Enhance Firm Value in a Merger... 13
Marketing as a Moderator in the Marketing-Finance Interface ... 16
2.3 Conceptual Framework and Hypotheses ... 16
Post-Merger Marketing Investments... 16
Positive Signaling Effects of Marketing Investments ... 19
The Degree of Information Asymmetry and Marketing investments ... 20
2.4 Data and Measures ... 21
Sample... 21
Measures ... 23
2.5 Empirical Analysis and Results ... 26
Mergers and Information Asymmetry ... 26
viii
Information Asymmetry, Marketing Investments, and Firm Value ... 31
Dynamic Panel General Method of Moments (GMM) ... 32
2.6 Conclusion ... 39
Discussion ... 39
Theoretical Implications ... 40
Managerial Implications ... 41
Limitations ... 42
CHAPTER 3 – ESSAY 2: POST-MERGER RETURNS TO MARKETING PRODUCTIVITY ... 43
3.1 Introduction ... 43
3.2 Conceptual Framework ... 46
Resource-Based View and M&A... 46
Marketing Productivity ... 48
R&D Productivity ... 49
Operation Productivity ... 49
Productivity, Mergers, and Firm Value ... 50
3.3 Data and Measures ... 51
Sample... 51
Measures ... 52
3.4 Empirical Analysis and Results ... 54
Data Envelopment Analysis (DEA) ... 54
Measuring Marketing Productivity ... 57
Measuring R&D Productivity ... 58
Measuring Operation Productivity ... 58
Modeling the Relation between Functional Productivity and Firm Value ... 59
Results ... 60
3.5 Conclusion ... 68
Discussion ... 68
Theoretical Implications ... 69
Managerial Implications ... 70
ix
CHAPTER 4 – ESSAY 3: STOCK MARKET REACTION TO MERGER
ANNOUNCEMENT AND MARKETING INVESTMENTS POST-MERGER ... 72
4.1 Introduction ... 72
4.2 Conceptual Framework ... 74
Why Do Acquirers React to the Stock Market Reaction? ... 74
Related Studies and Contribution ... 75
4.3 Empirical Analysis and Results ... 77
Empirical Analysis ... 77
Sample... 78
Results ... 79
4.4 Conclusion ... 84
Discussion ... 84
Limitations ... 84
x
LIST OF TABLES
Table 1 — Related Literature and the Incremental Contributions of the Study ... 14
Table 2 — Research on the Effects of Limited Financial Resources on Marketing Strategy and Firm Performance ... 18
Table 3 — Descriptive Statistics of Financial Variables for the Completed Sample and Two Control Samples ... 24
Table 4 — Measurements of Information Asymmetry ... 25
Table 5 — Descriptive Statistics of the Changes in Information Asymmetry in a Merger ... 28
Table 6 — Marketing Investment Changes between the Merger Year and Non-Merger Year .... 30
Table 7 — Abnormal Returns under Different Post-Merger Marketing and Information Asymmetry... 32
Table 8 — Dynamic Panel GMM Estimation Results: All Samples ... 37
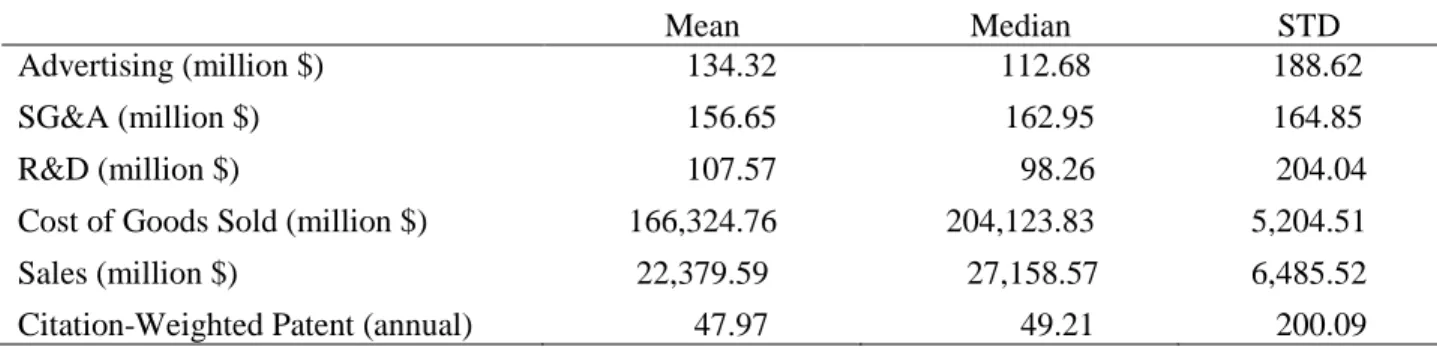
Table 9 — Descriptive Statistics... 53
Table 10 — Advertising, Marketing, and R&D Investments through a Merger ... 60
Table 11 — DEA Estimation Results: Parameter Estimates of Marketing, R&D, and Operation Productivity Pre- and Post-Merger ... 62
Table 12 — GMM Estimation Results: Parameter Estimates of the Relation between Firm Value and Marketing, R&D, and Operation Productivity ... 67
Table 13 — Descriptive Statistics of the Merger Announcement Returns ... 79
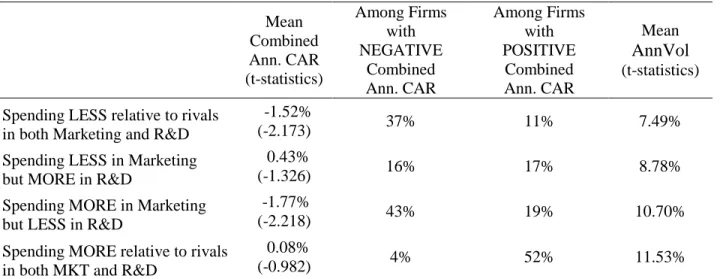
Table 14 — Reaction to the Merger Announcement and Post-Merger Investment patterns ... 81
1
CHAPTER 1 – INTRODUCTION
1.1 Research Question and Motivation
2
1.2 Research Framework
3
4
1.2 Dissertation Structure and Preview
In Essay 1, I explore a contingency framework in which the expectation of investors plays a moderating role in the links between marketing investments and firm value. Specifically, I design a test and then provide empirical evidence that enhances a discussion about how the degree of information asymmetry between an acquirer and investors affects a firm’s marketing investments and firm value. Generally, it is the investors who have less information about the firm than the firms do as the managers have special knowledge or resources that can significantly affect the firm’s value. This information asymmetry can create a “lemons problem” (Akerlof 1970). Because buyers are likely to accept a price that reflects an average quality with lack of information, the low-quality lemons are more likely to enter the market than the high-quality companies. The potential for the lemons problem necessitates that firms create and implement corporate strategies that promote efficient delivery of information about firms’ true value. In the present globalized world, the situation is more complex as investment is the key component that contributes to the general management of a firm and there are increasing opportunities for investors. Marketing is one of the most effective signaling mechanisms for establishing better communication between a firm and the financial market. Accordingly, I estimate the degree and the effects information asymmetry has on returns to marketing investments in a merger, a setting where information asymmetry is likely to have a large effect on the relation between a firm and investors.
5
I employ a dynamic panel General Method of Moments (GMM) approach (Arellano and Bover 1995; Blundell and Bond 1998), which allows for the modeling of the dynamic endogeneity. An initial examination of the data shows that, on average, mergers lead to acquirers’ significant disinvestment in their marketing in the years following a merger. However, I also find that stock returns are greater for acquirers that invest more than their competitors do following the merger. Additionally, I find that the effects of post-merger marketing investments are contingent on the degree of information asymmetry. The results show that the positive impact of marketing on firm value is stronger and slowly decreases when the degree of information is higher compared to when the degree of information is lower.
6
more questions than answers (Hitt et al. 1990, 1991). To address this, I estimate the degree and effects changes in marketing productivity have on the link between marketing investments and firm value in a merger, while providing accounts of multi-faceted aspects of firm productivity.
I use a sample that consists of 153 public U.S. acquirers in chemical and rubber, electronic equipment, and automotive industry. These specific industries were chosen because they are characterized by intensive use of marketing assets as well as other functional assets. I utilize the Data Envelopment Analysis (DEA) to measure marketing productivity (Banker et al. 1984; Charnes et al. 1978). This method allows for the identification of a set of action priorities for marketing managers and quantification of the gains of implementing such strategies. An initial examination of the data shows that mergers lead to acquirers’ significant disinvestment in their marketing relative to a firm’s rivals post-merger. However, empirical results show that increases in marketing are associated with increases in sales post-merger. Furthermore, I find a negative association between the marketing productivity increase and firm value. This
juxtaposition could lead to difficult decisions for the marketing manager. Superior marketing investment is more likely to lower the level of marketing productivity, but this low productivity tends to achieve higher stock prices. I provide the underlying theoretical rationale for the negative association between productivity and firm value as well as an understanding of the conditions under which aggressive marketing investments lead to a win-win outcome for acquirers.
In Essay 3, I investigate the two-way information flows between acquiring firm managers and investors in the stock market. Specifically, I design a test and then provide empirical
7
evidence of the effects marketing investment and productivity have on the acquirer’s financial firm value. In Essay3, I find the evidence of the effects stock market has on the acquirer’s marketing and R&D investment post-merger. The underlying rationale is that the stock return and volatility are useful sources of information (Hayek 1945). Because one of the fundamental roles of the stock market is to produce and aggregate of information, firms extract information from the stock fluctuation and consider it when making corporate investment decisions. The hypothesis implies that the stock market possesses information that is new to firms although managers are generally better-informed than investors about the fundamental and prospects of a firm (Luo 2005; Chen et al. 2007). This information is more likely to be related to the weakness of the merger plan the acquirer has overlooked, such as the potential competition following a post-merger integration. To address this, I estimate the degree and effects the stock return and stock volatility at the time of a merger announcement have on the mangers’ investment patterns in marketing and R&D post-merger.
In order to comprehend the post-merger investment decisions, I categorize acquirers into four groups based on the pattern of marketing and R&D investments. Firms are grouped
8
fluctuation as the degree of information is higher. The results are consistent with the contingent role of information asymmetry found in the Essay 1 and 2.
Through these three studies, I provide an overview of the links between marketing investments, marketing productivity, and firm value. My theoretical and empirical analyses inform specific assessment and diagnosis techniques and implementable guidelines that marketing managers may use in practice, which I discuss further in subsequent chapters. Collectively, the findings from this dissertation contribute new knowledge to the field of
9
CHAPTER 2 – ESSAY 1: POST-MERGER RETURNS TO MARKETING INVESTMENTS
2.1 Introduction
The purpose of the current study is to design a test and then to provide empirical evidence that enhances a discussion as to when and how a firm’s marketing investments affect its
performance in the financial market. Recent literature has sought the performance implication of the marketing assets (for a summary, see Srinivasan and Hanssens 2009). Furthermore, studies have emphasized that information is not a separate factor in determining and executing
marketing strategy of a firm. The relationship between information and firm performance is central to any marketing strategy and, in particular, to the context addressed here. A key to this is a firm’s marketing actions, which serve as the fundamental path through which information is delivered to the markets. In the original seminal piece on the signaling aspect of marketing, Nelson (1970) argued that the mere fact that a firm is advertising more than competition suggests that it is of superior quality. Spence (1974) is the classic paper on the process of signaling in the economics literature. However, what previous studies leave less explored is the empirical measurement and test of information asymmetry that has a decisive effect on marketing investment and firm performance. To study this question, I estimate the degree and effects information asymmetry has on returns to marketing in a merger, a natural setting where
10
Mergers and acquisitions continue to be popular vehicles for firm survival and growth (Barney 1991; Wernerfelt 1984). The resource-based view (RBV) considers mergers as strategic corporate investments taken in order to meet customer needs by integrating assets and
capabilities that exist inside and outside the firm’s boundaries. The post-merger years are eminently unique; mergers often significantly change the outlook of a firm and its industry, which increases the degree of information asymmetry for both the acquirer and investors. Therefore, I contend that examining the effect of marketing and information asymmetry in the post-merger period is particularly important and relevant relative to other contexts (e.g., contractions or equity offerings). Unlike other contexts, a merger transaction requires a considerable amount of managerial and financial resources that otherwise could support marketing. As a result, acquirers may face a temporary competitive disadvantage in terms of marketing investment because mergers expose acquirers to a significantly greater debt-to-equity ratio. Often the popular and business press suggests merger integration is the focus of post-merger activity and thereby recommends spending less on advertising. However, I argue that increasing marketing investment can enhance firm value by delivering critical information about an acquirer’s current and future operations. Moreover, I contend that the degree of information asymmetry is a moderating variable that determines the direction and efficacy of marketing adjustments. Accordingly, I design a test to answer following questions: 1) Should acquirers increase or decrease marketing investments throughout a merger to enhance firm value? 2) What factors should acquirers consider when determining their marketing investment? The findings provide useful insights for acquiring-firm managers to allocate resources in marketing.
11
Standard & Poor’s, and Chicago Booth’s Center for Research in Security Prices (CRSP) between 1990 and 2010. An initial examination of the data shows that, on average, mergers lead to
acquirers’ significant disinvestment in their marketing in the years following a merger, which seems to directly reflect the recommendations of the business press. However, I also find that, in fact, stock returns are greater for acquirers that invest more than their competitors do following the merger. The results suggest that, in this case, the greater marketing spend reveals managers’ private information about their firms’ business prospects and alleviates concerns stemming from the merger, thereby contributing positively to firm value. Besides the main effect, I find that the effects of post-merger marketing investments are contingent on the degree of information asymmetry. The results show that the positive impact of marketing on firm value is stronger and more slowly decreases when the degree of information is higher than when the degree of
information is lower. In order to quantify the effect and intricacy among mergers, firms, and investors, I employ a dynamic panel General Method of Moments (GMM) approach (Arellano and Bover 1995; Blundell and Bond 1998), which allows for the modeling of the dynamic endogeneity. Further, I use a unique benchmark to make counterfactual comparisons.
I structure the rest of the paper as follows: I begin by presenting the related literature and theoretical background, from which I derive the hypotheses. Next, I describe the data sources and operationalization of measures, followed by the research method employed. Finally, I conclude by discussing the results, suggesting implications, and summarizing limitations.
2.2 Related Literature and Contribution
12
The Impact of Mergers on Firm Value
The literature has long been intrigued with understanding the magnitude of abnormal returns to acquiring firms and the factors affecting those returns (Jensen and Ruback 1983; Agrawal et al. 1992; Fuller et al. 2002). Agrawal et al. (1992), using an exhaustive sample of mergers, find that stockholders of bidding firms suffer a significant loss over the five-year period. Andrade et al. (2001) summarize a large body of evidence spanning four decades and report that announcement return to bidders is generally zero or slightly negative. Loughran and Vijh (1997) find significantly positive excess returns over the period of 1970–1989 but only when firms complete cash-tender offers. Rau and Vermaelen (1998) report that the poor performance of low book-to-market “glamour” causes the long-term underperformance of acquiring. Shleifer and Vishny (2003) argue for the influence of managerial hubris and overvaluation as explanations. Other factors investigated include merger type, relative size, strategic orientation, and both firms’ structures (Loughran and Vijh 1997; Fuller et al. 2002; Moeller et al. 2004; Haleblian et al.
2012). This study contributes to this literature by identifying a marketing strategy that ultimately can improve an acquirer’s short- and long-term stock returns.
The Impact of Mergers on Marketing Metrics
Research addressing marketing metrics in mergers mainly finds the decreased activity in R&D and innovation activity in the post-merger period. Hitt et al. (1990, 1991) suggest that an acquirer’s lower commitment to innovation post-merger is anticipated, and as a result,
13
Ahuja and Katila (2001) argue that the size of acquired knowledge enhances innovation output, while Prabhu et al. (2005) contend that high depth and breadth of knowledge base produce more innovations. Finally, Bena and Li (2014) show that firms with prior technological linkages between two merging entities produce more patents post-merger. This study contributes to this literature by examining a different marketing metric, advertising investments in a merger, and its subsequent impact on the acquirer’s firm value.
Marketing Assets to Enhance Firm Value in a Merger
In contrast to finance literature, considerable marketing research has investigated the effects of marketing assets on the merger performance. Early research using a survey
14
Table 1
Related Literature and the Incremental Contributions of the Study
Key Issue and Main Finding Publications Incremental Contribution
The Impact of Mergers on Firm Value Key issue: Whether and how mergers improve a firm’s long-term stock returns as well as announcement returns
Agrawal, Jaffe, and Mandelker (1992) Loughran and Vijh (1997)
Rau and Vermaelen (1998)
Fuller, Netter, and Stegemoller (2002) Shleifer and Vishny (2003)
Moeller, Schlingemann, and Stulz (2004)
This study contributes to this literature by identifying a marketing strategy that ultimately can improve an acquirer’s short- and long-term stock returns by delivering information.
Main finding: An acquirer, on average, suffers a significant loss post-merger. This finding is consistent across different industries and time periods.
The Impact of Mergers on Marketing Metrics Key issue: Whether and how mergers affect a firm’s marketing metrics such as R&D (innovation)
Hitt, Hoskisson, and Ireland (1990)
Hitt, Hoskisson, Ireland, and Harrison (1991) Ahuja and Katila (2001)
Prabhu, Chandy, and Ellis (2005) Seru (2014)
Bena and Li (2014)
This study examines a different marketing metric, advertising investments in a merger, and its subsequent impact on the acquirer’s firm value.
Main finding: Acquisitions, on average, lead to lower investments in R&D. However, the negative impacts may be affected by several factors, including merger type, prior knowledge bases, and relatedness of a merger.
Marketing Assets to Enhance Firm Value in a Merger Key issue: The effect of an acquirer's pre- and
post-merger marketing assets on the merger performance
Capron and Hulland (1999) Homburg and Bucerius (2005) Sorescu, Chandy, and Prabhu (2007) Bahadir, Bharadwaj, and Srivastava (2008) Swaminathan, Murshed, and Hulland (2008) Wiles, Morgan, and Rego (2012)
This study proposes and demonstrates a different perspective that compares pre- and post-merger periods and can determine an acquirer's long-term firm value, rather than focusing on either pre- or post-merger.
15
Marketing as a Moderator in the Marketing-Finance Interface Key issue: Whether and how advertising may
moderate firm performances in several external shocks
Joshi and Hanssens (2009) Steenkamp and Fang (2011) Chen, Liu, and Zhang (2012) Kurt and Hulland (2013) Xiong and Bharadwaj (2014) Gao, Xie, Wang, and Wilbur (2015)
This study contributes to this literature by showing the moderating role of marketing in a different event: mergers and acquisitions. This study propose that advertising can be used as a strategic variable to reduce information asymmetry in the post-merger period. Main finding: A firm’s advertising affects
performances in specific events, including movie releases, third-party reviews,
16
Marketing as a Moderator in the Marketing-Finance Interface
Recently, marketing research has paid increasing attention to the impacts of marketing strategies on performances (Srinivasan and Hanssens 2009). As a result, past studies have
investigated the moderating role of advertising in several external shocks. The main thesis is that investors would look to firms’ advertising activities for a signal to reduce the degree of
asymmetry of information (Spence 1974; Nelson 1974). However, findings on the signaling role of advertising are mixed, depending on a firm’s financial condition. Specifically, Steenkamp and Fang (2011) report that increasing advertising has significantly positive effects during
contractions. In contrast, Kurt and Hulland (2013) argue that investors may view an increasing in advertising negatively when equity issuing firms have weaker financial flexibility than their industry peers. This study contributes to this literature by presenting evidence of the positive signaling role of advertising in a merger and acquisition. I propose that marketing can be used as a strategic variable to reduce the degree of information asymmetry between the firm and
investors, despite the financial disadvantage in the post-merger period.
2.3 Conceptual Framework and Hypotheses
Post-Merger Marketing Investments
17
the market by adopting predatory strategies, such as advertising wars. By doing so, the
competitors would seek not only to communicate the value of their own growth opportunities but also to strategically negate the effect of the acquirer’s marketing strategies in order to take advantage of similar opportunities that the acquirer would have cultivated. Acquirers,
acknowledging the possibility of being confronted with the fierce reactions by their competitors, may not aggressively increase their marketing investments post-merger because the increased leverage would limit a firm’s ability to respond in a timely manner. Accordingly, I argue that the downward direction of marketing adjustments to be observed in a year following a merger announcement, when compared to the years preceding the merger announcement. Hence, I hypothesize the following:
18
Table 2
Research on the Effects of Limited Financial Resources on Marketing Strategy and Firm Performance
Authors Study Context Findings
Chevalier (1995) Leveraged buyouts Highly leveraged supermarkets compete less
aggressively
Kovenock and Phillips (1995) Leveraged buyouts Highly leveraged firms are less likely to make major investments
Zingales (1998) Deregulations Highly leveraged trucking firms are less likely
to survive in price wars Hanka (1998) All industries except financial and utilities
firms
More leveraged firms tend to hire more part-time employees and pay lower wages
Khanna and Tice (2000) Walmart’s Entry Firms with greater leverage decrease
investments in resisting Walmart’s entry Peyer and Shivdasani (2001) All industries except financial firms Leverage motives firms to focus on short-term
cash flows, which decreases long-term firm value
Grullon, Kanatas, and Kumar (2006) New funding raised More leveraged firms tend to invest less in advertising
Gielens, Van De Gucht, Steenkamp, and
Dekimpe (2008) Walmart’s Entry European retailers with higher leverage perform more poorly as a result of disinvestments
Kurt and Hulland (2013) IPO and SEO firms Financial flexibility moderates the positive impact of marketing on firm value
Phillips and Sertsios (2013) Airlines firms Leveraged firms increase prices and decrease product quality for short-term revenues Malshe and Agarwal (2015) All industries except financial firms Leverage reduces customer satisfaction and
19
Positive Signaling Effects of Marketing Investments
Recent research explores the signaling role of marketing investment contributes in various economic shock contexts, including movie releases, contractions, and product recalls (Table 1). However, results are indecisive. For example, Luo (2008) investigates the relation between marketing spending and initial public offering (IPO) performance. The results uncover that the benefits of pre-IPO marketing spending are positive and not trivial. An issuer’s
marketing helps reduce underpricing and boost trading volume in the stock market. On the other hand, Mizik and Jacobson (2007) suggest that cutting marketing investment leads to a higher stock price in the short-term in the context of equity offering. However, the authors argue that the stocks are temporarily overestimated in that the misevaluation corrects adequately in the long run, suggesting the myopic behavior such as cutting marketing does not have a significant impact in the long term.
While these studies document the effectiveness of marketing in coping with firm-level economic changes, relatively little is known about the opposite: how firms’ marketing
investment adjusts to deal with the microeconomic changes and, as a result, how firm
performance improves correspondingly. One notable exception is Kurt and Hulland (2013), who find that adopting an aggressive investment is the preponderant marketing strategy of equity-issuing firms. The authors argue that increased marketing can enable managers to communicate to investors about their firms’ future prospects and therefore and aggressive marketing
20
(2011) highlight the use of marketing investment measures relative to firms’ competitors. They argue that theorizing based on the relative metrics is important not only because it reflects competition firms are facing but also because it is useful in investigating how firms react to changing economic conditions. Hence, I hypothesize the following:
H2: Investing more in marketing relative to its rivals in a year following a merger announcement is positively associated with an acquirer’s firm value.
The Degree of Information Asymmetry and Marketing investments
A merger creates uncertainty and intensifies the information asymmetry between acquirers and investors, which may ultimately lead to lower firm value (Bartov and Bodnar 1996). Information asymmetry raises transaction costs and reduces expected liquidity in the stock market. I argue that marketing can alleviate these consequences by reducing the degree of information asymmetry between the firm and investor. In most cases, acquirers have private information not only about the quality of firms’ products but also about the true financial value of firms’ post-merger growth opportunities (Chemmanur and Yan 2009). In general, information asymmetry can be reduced by three mechanisms: 1) carrying legally binding forces such as contractions, 2) monitoring by outside agents, and 3) signaling (Nelson 1974; Spence 1974). Between firms and financial market agents, marketing, among various instruments, is a credible signal because investors interpret the increased investments as a manager’s effort to reduce information asymmetry (Srinivasan and Hanssens 2009). Such a proactive adjustment in
21
sign and the magnitude of the expected strategic profit, which are likely to be positive and greater when the degree of information asymmetry is higher.
The premise of the prediction is that, in the post-merger period, acquirers have incentives to reduce the degree of information asymmetry in order to maximize firm value. In fact, when increasing marketing investments, the managerial desire for a reduction of information
asymmetry and thereby a maximization of firm value should outweigh other factors, including a firm’s limited financial resources and market position post-merger. Hence, I argue that the degree of information asymmetry is an important conditioning variable to consider when
examining the positive impacts of marketing investment on firm value. The higher the degree of information asymmetry, the more positive impacts of marketing investments is expected. High information asymmetry increases uncertainty in return on investment and therefore enhances potential incentives of both managers and investors to reduce the level of information asymmetry. To the extent that firms are able to convey information about their true value and future cash flow, the reduced information asymmetry manifests in stock prices. The positive reaction in the financial market to managers’ effort on reducing the uncertainty is more likely to be apparent in the samples of acquirers with greater information asymmetry. Hence, I hypothesize the following:
H3: The positive impact of an acquirer’s marketing investments in a year following a merger on firm value is moderated by the degree of information asymmetry.
2.4 Data and Measures
Sample
22
Standard & Poor’s to collect firms’ annual financial/accounting information, including marketing investment, sales revenue, and several control variables. I use the Chicago Booth’s Center for Research in Security Prices (CRSP) to collect stock market–related data to estimate short- and long-term stock return. The data treatment and merging procedure closely parallel those in the prior literature (Sorescu et al. 2007; Swaminathan et al. 2008).1 This merging process using the SDC, COMPUSTAT, and CRSP database leads to a pooled cross-sectional time series panel with a total of 2,855 observations.
I also construct control samples to compare the effects and causal relation between marketing investments, information asymmetry, and firm performance. I use two different groups of firms as controls for the empirical analysis. The first group comprises the firms that have no plan to merge, and the second group comprises the firms that had plans to merge but did not complete the merger.2 First, I match each M&A firm with a firm that is not involved in a merger on the basis of sales, total asset, and industry. The matched firms are carefully selected with in the same two-digit SIC industry codes when the firm has the closest sales and total asset to the M&A firm’s sales and total asset in year of a merger. The matched sample comprises 2,855 observations. The second control sample is the withdrawn mergers to address the
counterfactual scenario of how an acquirer would have invested in marketing and performed in
1 Prior literature (Croci and Petmezas 2009) finds that, for companies that engage in a series of acquisitions, merger
announcement returns are not independent. Therefore, following Prabhu et al. (2005), I retain only the biggest transaction in terms of deal value to eliminate the confounding effects of sequential mergers. The final sample consists of mergers across all industries to preserve reliable and generalizable results. However, I test whether the effect is unique in the financial sector (SIC6000-6999). The result is not sensitive to the inclusion of the financial sector.
2 Matching based on the observable variable is one of the popular strategies that can be used in this situation. The
23
the absence of a merger.3 The use of the withdrawn sample as a control strengthens the investigation, as the merger decision is made endogenously and strategically. As a result, the acquirer is likely to substantially differ from an average or randomly chosen matched firm, both at the time of a merger and in future periods. To keep every aspect of the compiling of the
completed and withdrawn samples consistent, I use similar steps to compile the latter, except that I only retain observations with the deal status of “Withdrawn” in the SDC database. Next, I screen out any merger attempts that are withdrawn due to reasons directly related to marketing strategy of two merging firms.4 I categorize several cancellation reasons mainly based on the deal synopses in the SDC M&A database and manual search in LexisNexis and Factiva to supplement. The withdrawn sample comprises 589 mergers. I present, in Table 3, the descriptive statistics of selected variables for the completed, matched, and withdrawn samples.
Measures
I focus on both short- and long-term financial market performance. First, I estimate annual stock return by compounding the monthly stock returns for a given fiscal year. Short-term performance uses 12 consecutive monthly stock returns starting from the January after a merger is announced. Long-term performance uses 24 (2-year) consecutive monthly stock returns. To control for the value risk (Fama and French 1993), I use the risk-adjusted abnormal stock return.5
3 Not all pursued acquisitions are ultimately completed due to several reasons such as regulatory intervention,
competing offer, or disagreement between management and board. Similar empirical design has been used in a different context in finance literature to avoid the potential endogeneity problem (Savor and Lu 2009, Seru 2014).
4 This allows for the use of the withdrawn sample as a strong control. In order to keep out various endogenous
reasons for the merger withdrawal, I also test an even smaller sample of merger attempts that are withdrawn due to regulatory objections only (i.e., anti-trust issues). The results remain unchanged.
5 However, the overall findings remain unchanged by the use of size-adjusted or equally weighted market portfolio
24
Table 3
Descriptive Statistics of Financial Variables for the Completed Sample and Two Control Samples Completed Sample Matched Sample Withdrawn Sample Total Assets
Mean 10,591 10,692 10,237
Median 801 874 653
Std. 78,498 78,264 88,003
Book-to-Market Value
Mean 0.46 0.48 0.49
Median 0.38 0.35 0.37
Std. 0.58 0.63 0.83
Marketing Intensity
Mean 0.01 0.01 0.01
Median 0.00 0.00 0.00
Std. 0.03 0.03 0.03
Liquidity
Mean 0.25 0.23 0.24
Median 0.22 0.21 0.23
Std. 0.21 0.21 0.22
Sales Growth
Mean 1.35 1.23 1.68
Median 1.16 1.56 1.08
Std. 3.58 4.76 10.66
Note: Total Assets is reported in dollars. Book-to-Market Value is the ratio between book value of common stock at the year of a merger and the stock price multiplied by the number of shares outstanding at the year of a merger. Marketing Intensity is advertising expenditure divided by total asset at the year of a merger. Liquidity is calculated by dividing the sum of debt in current liabilities and long-term debt by total asset at the year of a merger. Sales Growth is sales at the year of a merger scaled by lagged sales.
I construct marketing investment as a firm’s advertising expenditure scaled by the total assets in the same year for several reasons. First, given the interest in marketing as a source of signals, advertising expenditure will be more appropriate and precise because advertising investment is highly correlated with overall marketing budget. Several studies in related
25
effect of marketing that is not associated with integration tasks. The advertising expenditure item excludes any financial value of marketing resource used for the post-merger integration.6
Table 4
Measurements of Information Asymmetry
Authors Measures of Information Asymmetry Study Context Dierkens (1991) Standard deviation of the market-adjusted,
three-day abnormal return at the
announcement, the residual volatility of the equity of the firm, the number of public announcements published, volume of trading
Equity issues
Bartov and Bodnar (1996)
Bid-ask spread, volume of trade General
Krishnaswami and Subramaniam (1999)
Forecast error, standard deviation of forecasts, normalized forecast error, volatility in
abnormal returns around earnings
announcements, residual volatility in daily stock returns
Spin-offs
Frankel and Li (2004) Profitability, intensity of insider trades General Chae (2005) Company size, number of analysts, bid-ask
spread, industry dummies
Scheduled and unscheduled information-revealing announcement Moeller, Schlingemann,
and Stulz (2007)
Standard deviation of the earnings
announcement, abnormal return, the firm’s idiosyncratic volatility
Acquisitions
Duartea, Han, Harforda, and Young (2008)
PIN, institutional ownership percentages, whether firms is covered by analysts, number of news reports
Regulation fair disclosure
Officer, Poulsen, and Stegemoller (2009)
R&D intensity, idiosyncratic return volatility Acquisitions
Armstrong, Core, Taylor, and Verrecchia (2011)
Bid-ask spread, R&D, scaled accruals quality, analyst coverage
General
6 Reporting marketing investment in financial statement is not compulsory. Thus, firms may use their discretion in
26
I follow the finance literature (Dierkens 1991) and use two different proxies to measure the information asymmetry (IA). The first measure focuses on the behavior of the financial market at the merger announcement. This IA_anno variable is measured as the standard deviation of the market-adjusted, three-day (-1, +1) abnormal returns around the merger announcement. The CRSP value-weighted index is used as a proxy for the market portfolio. A volatile reaction in the financial market at the merger announcement suggests that the degree of information asymmetry is higher for the merger. The second measure focuses on the firm’s private
information that is not yet shared with the financial market. This IA_resi variable is measures as the standard deviation of the market-adjusted daily stock price abnormal return in the year. This residual volatility captures the degree of information between the firm and investors that remains after removing the uncertainty that is common to the managers and financial market. A higher dispersion in the residual suggests that the degree of information asymmetry is higher for the merger.7
2.5 Empirical Analysis and Results
Mergers and Information Asymmetry
In this study, the merger and acquisition is implicitly assumed to increase the degree of information asymmetry at the time of a merger announcement and in future periods. In the following, I test this in two ways. First, I compare the levels of information asymmetry of the completed sample with those of both control samples at the merger announcement. If the announcements of a merger are subject to greater information asymmetry issues, one should
7 To obtain the comparable announcement returns and measure of information asymmetry for the matched sample, I
27
observe higher levels of information asymmetry for the completed sample relative to the
28
support the notion that mergers increase the degree of information asymmetry in the stock market.
Table 5
Descriptive Statistics of the Changes in Information Asymmetry in a Merger (1) Completed Sample (2) Matched Sample (3) Withdrawn Sample Difference (1)-(2) Difference (1)-(3) IA_anno (-1, +1) Mean 0.2581 0.0444 0.1639 0.2137*** 0.0942
Median 0.2561 0.0373 0.1492 0.2188*** 0.1069
IA_resi
Mean
year t-2 0.0227 0.0256 0.0221 -0.0029 0.0006 year t-1 0.0238 0.0244 0.0239 -0.0006 -0.0001 Year t 0.0736 0.0234 0.0678 0.0502*** 0.0058 year t+1 0.0233 0.0237 0.0467 -0.0004 -0.0234** year t+2 0.0228 0.0248 0.0319 -0.0020 -0.0091*
Median
year t-2 0.0195 0.0165 0.0164 0.0030 0.0031 year t-1 0.0183 0.0171 0.0168 0.0012 0.0015 Year t 0.0294 0.0168 0.0271 0.0126*** 0.0023 year t+1 0.0186 0.0162 0.0251 0.0024 -0.0065** year t+2 0.0189 0.0161 0.0236 0.0028 -0.0047**
*** p < .01, ** p < .05, * p < .10
Note: The IA_anno (-1, +1) is the standard deviation of the market-adjusted, three-day (-1, +1) abnormal returns around the merger announcement. The IA_resi is the standard deviation of the market-adjusted daily stock price abnormal return in the corresponding year given that a merger occurs at year t. Tests on means and medians are based on t-tests and Wilcoxon tests, respectively.
Mergers and Marketing Investments
Hypothesis 1 predicts that an acquirer increases its marketing investments pre-merger and then decreases its marketing investments post-merger. To test, I run the following regression:
Marketing Investment𝑖𝑡+1− Marketing Investment𝑖𝑡+𝑘 = 𝛽0+
𝛽1(𝑀&𝐴𝑖𝑡+1− 𝑀&𝐴𝑖𝑡+𝑘) + 𝛽2(𝐶𝑜𝑛𝑡𝑜𝑟𝑙𝑖𝑡+1− 𝐶𝑜𝑛𝑡𝑟𝑜𝑙𝑖𝑡+𝑘)
+ 𝜀𝑖 (1)
29
merger is announced in the previous year and 0 otherwise. Control is a vector of control
variables that could affect an acquirer’s marketing investment: financial flexibility, size, book-to-market ratio, market share, and cashpmt. All control variables are defined as illustrated in Data and Measures section. I also control for a firm’s lagged marketing investment, year, and industry. Finally, I control for cross-sectional heterogeneity across firms by running a random effect regression. In equation (1), 𝛽1 is the primary interest because it gauges the difference in
marketing investments between a year following a merger announcement (year t+1) and the pre-merger years (year t-2, year t-1, and year t). A firm’s marketing investment changes in year t+1 could occur due both to the firm’s anticipation of merging and to the firm’s product market considerations. In equation (1), after controlling for the effects of several product market factors (Control vector), 𝛽1 captures the portion of changes in marketing investments that is attributable to a merger decision. This model more accurately calculates the average adjustments level in marketing investment that is associated with the managers’ post-merger decision than
autoregressive model (Chemmanur and Yan 2009). I expect 𝛽1 to be significantly negative for the completed sample to be consistent with H1.
30
Table 6
Marketing Investment Changes between the Merger Year and Non-Merger Year
*** p < .01, ** p < .05, * p < .10
Note: This table summarizes the results from the random effect regression on Marketing Investment in the merger year and non-merger year. The Marketing
Investment a firm’s advertising expenditure scaled by its total asset. The independent variables consist of M&A, a dummy variable equal to 1 if the merger is
announced in the previous year and 0 otherwise; Financial Flexibility, a ratio of the sum of debt in current liabilities, long-term debt, and cash to total assets; Size, the relative size of the firms measured by the relative equity; Book-to-Market Ratio, a ratio of the natural log of book value of common stock to the natural log of the product of number of shares outstanding and end-of-year- stock price; Market Share, a firm’s sales relative to industry sales in the past year. Industries are
identified using two-digit SIC codes.
Completed Sample Matched Sample Withdrawn Sample
(Year t+1) - (Year t-2)
(Year t+1) - (Year t-1)
(Year t+1)
- (Year t) Δ(t-2) Δ (t-1) Δ (t) Δ(t-2) Δ (t-1) Δ (t) M&A -0.014
*** -0.011 *** -0.012 ** 0.010 ** 0.007 ** 0.011 ** 0.013 *** 0.009 ** 0.000 (0.004) (0.003) (0.006) (0.006) (0.003) (0.006) (0.005) (0.005) (0.004) Financial Flexibility 0.009 *** 0.011 ** 0.041 *** 0.010 ** 0.016 *** 0.009 ** 0.011 ** 0.027 ** 0.005 ** (0.003) (0.004) (0.004) (0.005) (0.006) (0.005) (0.005) (0.012) (0.002)
Size 0.032
** 0.019 *** 0.006 ** 0.003 ** 0.001 ** 0.000 ** 0.010 ** 0.007 ** 0.011 ** (0.015) (0.006) (0.003) (0.002) (0.000) (0.000) (0.005) (0.003) (0.005) Book-to-Market
Ratio
0.006 *
.008 0.002
0.003 *
0.002 0.002 0.007
*
0.006 0.005 (0.003) (0.006) (0.003) (0.002) (0.002) (0.003) (0.004) (0.004) (0.005) Market
Share
-0.147 -0.111 0.123 0.008 -0.021 0.036
*
31
Table 6 also exhibits the results for the matched and the withdrawn samples. The 𝛽1 for the matched sample is significantly positive over the years, suggesting that an acquirer’s rivals increase their marketing investment in year t+1 as expected. Competitors seek to take advantage of an acquirer’s temporary financial inflexibility by aggressively investing in marketing. The 𝛽1
for the withdrawn sample is significantly positive prior to a merger but is insignificant following a merger, suggesting that the failed acquirers increase their marketing investments in the merger year but not in the following year. Overall, the results show that a successful acquirer
aggressively invests in marketing pre-merger and then reduces its marketing post-merger, supporting H1.
Information Asymmetry, Marketing Investments, and Firm Value
Table 7 presents the results of a univariate analysis that directly investigates whether the short-term abnormal returns (in year t+1) differ across post-merger marketing investment. The results demonstrate the effect of two post-merger marketing investment strategies, spending more or less than industry average, under different degrees of information asymmetry. Two measures of information asymmetry, IA_anno and IA_resi, are used. An acquirer is classified to have a “high” (“low”) degree of information asymmetry when a firm falls into the top (bottom) quartile of portfolios sorted on each information asymmetry proxies.
32
low, proactive marketing investments results in significantly positive stock prices (0.0078). The results also show that some acquirers can benefit from investing less in marketing (0.0081), which explains why acquirers tend to reduce their marketing post-merger, as presented in Table 6. However, Table 7 offers preliminary evidence that not all acquires can gain from passive marketing activities. The results suggest that when ignoring a critical moderating factor such as the degree of information asymmetry, managers might mistakenly conclude that investing less in their marketing relative to rivals does not affect stock prices following a merger.
Table 7
Abnormal Returns under Different Post-Merger Marketing and Information Asymmetry Degree of Information Asymmetry
Around Merger Announcement (IA_anno)
Degree of Information Asymmetry in Merger Announcement Year
(IA_resi𝑡)
High Low High Low
Investing MORE than rivals
0.0114*** 0.0078** 0.0103** 0.0065
Investing LESS than rivals
-0.0089** -0.0043 -0.0127*** 0.0081*
*** p < .01, ** p < .05, * p < .10
Note: The short-term abnormal return reported here is cumulative abnormal return calculated by using 12 monthly stock returns in year t+1, starting from the January after a merger is announced. A firm is classified on the basis of whether its marketing investment in year t+1 is greater than industry average or not. Industries are identified using two-digit SIC codes. The IA_anno is the standard deviation of the market-adjusted, three-day (-1, +1) abnormal returns around the merger announcement. The 𝐼𝐴_𝑟𝑒𝑠𝑖𝑡 is the standard deviation of the market-adjusted daily stock price abnormal return in the merger year. A firm is classified to have a “high” (“low”) degree of information
asymmetry when a firm falls into the top (bottom) quartile of portfolios sorted on the basis of IA_anno and 𝐼𝐴_𝑟𝑒𝑠𝑖𝑡.
Dynamic Panel General Method of Moments (GMM)
To further examine the impact of post-merger marketing investments and information asymmetry, I specify a cross-sectional model as:
33
+ β4 Performanceit+k-1 + β5 Controlit+1 + ηi + εit+1 (2)
where i stands for firm, t for time (year), and k=1, 2. The dependent variable, Performance, is either short- or long-term stock performance. Short-term performance (k=1) uses 12 consecutive monthly stock returns starting from the January after a merger is announced. Long-term
performance (k=2) uses 24 consecutive monthly stock returns. To incorporate the competitive factors in marketing investments within a firm’s industry, the industry-level average of
marketing intensity is calculated using the ratio of each firm’s marketing investment to its total asset. RelativeMarketing is a difference between the marketing intensity of a focal firm and industry average. Industries are identified using two-digit SIC codes. Information Asymmetry is either IA_anno, the standard deviation of the market-adjusted, three-day (-1, +1) abnormal returns around the merger announcement, or IA_resi, the standard deviation of the market-adjusted daily stock price abnormal return in the merger announcement year. Control is a vector of control variables including financial flexibility, size, book-to-market ratio, market share, cashpmt, and merger type. The ηi is a time-invariant unobservable firm fixed effect and εit+1 is a random error representing all unobservable components on the dependent variable.
As discussed earlier, both heterogeneity and endogeneity display empirical challenges in studying mergers, marketing investment, and firm performance simultaneously. Previous studies tend to follow Heckman’s two-step method. However, marketing investment may also be
34
heterogeneity. Past research has shown that dynamic panel GMM is preferable over fixed effects or Heckman’s model to handle the empirical challenge (Arellano and Bover 1995; Blundell and Bond 1998; Dutt and Padmanabhan 2011; Rego et al. 2013; Kumar et al. 2014).8
Here, the dynamic panel GMM estimation consists of four steps. First, I begin with a “levels-levels” model specification that includes firm performance as a dependent variable and both marketing investments and one-year lagged performance as independent variables (eq. 2). Second, the estimation proceeds by first differencing all variables in the equation, eliminating firm and year fixed effects as well as potential omitted variables bias. Third, I use the first two lagged values of variables as instruments. Still, endogeneity remains unsolved because Δ
Marketing Investmentit+1 can be influenced by Δ Performanceit. Finally, I use the two-stage least squares (2SLS) method where the predicted value of marketing investment can be obtained using the instrument variables, past performances. I employ a difference GMM estimator using the predicted value of marketing investment as an independent variable in the aforementioned model.
The inherent weakness of dynamic panel GMM model arises due to the use of internal instrumental variables, which raises a potential problem of determining the optimal length of lags. Specifically, increasing the number of lags to be more exogenous may lead to the instruments of weaker validity. Following previous studies (Dutt and Padmanabhan 2011; Rego et al. 2013; Kumar et al. 2014), I include lags of one and two years. This allows for a sufficient horizon for past information to affect current performance expectations (Wintoki et al. 2012; Hoechle et al. 2012). In addition, I report the Hansen J and C statistics for the validity of instruments provided
8 If it is believed that there is a dynamic relationship between present values of the independent variable and past
35
by two tests, the Hansen test of over identification and a difference-in-differences Hansen test of exogeneity, with AR(1) and AR(2) test statistics.
The dynamic panel GMM model estimation results for all three samples are presented in Table 8. In addition to the estimation results for the central parameters of interest, the test statistics of model fit, serial correlation, and instrument variable validity are reported. All the serial correlation and instrument validity tests support the use of dynamic panel GMM model proposed. Pertaining to the hypothesized main effects for the completed sample, results using IA_resi𝑡 show that marketing has significantly positive impacts on the following years’ stock
returns (year+1: 3.533, year+2: 2.215), supporting H2. The coefficients indicate that the positive signaling effect of aggressive marketing investments relative to industry rivals dominates. While marketing has a positive effect for the matched sample (year+1: 2.137), the positive effects are stronger and longer (p < 0.05) for the acquirers. It may be that when a firm experiences a merger, marketing becomes more powerful as a signal and therefore a necessity of marketing investments increases. With respect to the contingent effects of information asymmetry, the interaction
between marketing and information asymmetry has a positive effect on stock return (year+1: 1.548, year+2: 1.214). The positive relationship between post-merger marketing and information asymmetry is stronger and longer (p < 0.01) for a successful-acquirer sample than for matched-firm (year+1: 1.116) and withdrawn-acquirer samples (year+1: 1.971). Considering the positive main effect of marketing on performance, the positive significant interaction suggests that when the degree of information asymmetry is higher, marketing has an even larger effect on
performance. These results also hold when IA_anno is substituted into the same equation. To ensure the significance of the moderating factor, I also estimate the GMM model without
36
fit improves when incorporating the information asymmetry factors. The presence of direct and indirect effects of information asymmetry leads to identification of conditions under which marketing investment post-merger can positively contribute to stock return. These results
37
Table 8
Dynamic Panel GMM Estimation Results: All Samples
DV: Stock Performance
Information Asymmetry: IA_anno (-1, +1) Information Asymmetry: IA_resi𝑡 Completed Sample Matched Sample Withdrawn Sample Completed Sample Matched Sample Withdrawn Sample Year +1 Year +2 Year +1 Year +2 Year +1 Year +2 Year +1 Year +2 Year +1 Year +2 Year +1 Year +2 Marketing 2.397 1.587 1.845 0.815 2.862 1.682 3.533 2.215 2.137 1.170 2.145 1.514
*** ** ** ** *** * *** **
(0.90) (0.79) (0.92) (0.94) (1.21) (1.06) (1.13) (1.05) (0.82) (0.96) (1.08) (0.95) Information
Asymmetry
-1.681 -0.871 -1.351 -0.927 -1.837 -1.371 -4.351 -2.179 -1.061 -1.073 -2.296 -1.374
*** ** ** *** * ***
(0.64) (0.68) (0.65) (0.63) (0.84) (0.88) (1.08) (1.39) (0.65) (0.68) (0.87) (0.93) Marketing
*Information Asymmetry
1.216 1.037 1.483 1.143 1.638 1.337 1.548 1.214 1.116 0.732 1.971 1.236
** * *** ** *** ** ** ***
(0.60) (0.58) (0.54) (0.62) (0.70) (0.71) (0.50) (0.57) (0.55) (0.51) (0.73) (0.79) Lagged
Stock Performance
0.915 0.852 1.412 1.041 0.562 0.268 0.914 0.643 1.371 0.847 0.316 0.115
*** *** ** * ** ** **
(0.31) (0.32) (0.66) (0.63) (0.32) (0.36) (0.46) (0.301) (0.68) (0.66) (0.34) (0.39) Financial
Flexibility
-0.349 -0.318 -0.291 -0.203 -0.422 -0.337 -0.260 -0.134 -0.222 -0.137 -0.390 -0.351
* *** * * ** **
(0.27) (0.24) (0.13) (0.12) (0.20) (0.21) (0.14) (0.13) (0.17) (0.14) (0.23) (0.25) Size 0.000 0.000 0.000 0.000 0.000 0.000 0.000 0.000 0.000 0.000 0.000 0.000
(0.00) (0.00) (0.00) (0.00) (0.00) (0.00) (0.00) (0.00) (0.00) (0.00) (0.00) (0.00) Book-to
-Market Value
1.637 1.548 1.216 1.009 2.123 1.829 1.738 1.602 1.518 1.117 1.952 1.720
*** ** ** ** *** *** ** ** *** ** *** **
38
Wald 2103 2503 1975 2762 173 254 2234 2610 2856 2176 314 251
AR(1) 0.04 0.02 0.02 0.09 0.01 0.03 0.03 0.03 0.01 0.06 0.02 0.01
AR(2) 0.15 0.24 0.31 0.24 0.36 0.42 0.27 0.18 0.47 0.16 0.27 0.35
Hansen J 0.48 0.41 0.40 0.48 0.22 0.27 0.33 0.34 0.21 0.25 0.29 0.16 Hansen C 0.55 0.32 0.42 0.41 0.12 0.19 0.12 0.38 0.39 0.28 0.24 0.18
*** p < .01, ** p < .05, * p < .10
Note: This table summarizes the results from the dynamic panel GMM model of stock performance for year+1 and year+2 following a merger announcement on marketing, information asymmetry, lagged stock performance, and controls. The dependent variable, Performance, is either short- or long-term stock
39
Table 8 also reveals, with respect to non-hypothesized effects for withdrawn sample, that marketing has a positive effect (year+1: 2.145), information asymmetry has a negative effect (year+1: -2.296), and the interaction term has a significant positive effect (year+1: 1.197) of stock return. Collectively, this may indicate that when a firm fails to complete a merger, an aggressive marketing can be interpreted as a recovery effort in order to reduce the negative effects of the news in the financial market. For investors, the cancellation of the merger proposal reveals negative information about the merging firms such as poor growth opportunity or
incompetency of management. Chi-square tests indicate that the net impact of marketing, calculated as a sum of three coefficients of the direct and indirect effects (1.046), is statistically positive and different from zero at the 5 percent level. This noteworthy finding suggests that a marketing manager at such a firm may adopt a more aggressive marketing post-cancellation to prevent potential performance loss. In addition, this finding further supports H3 because the withdrawn sample is also a subject of higher information asymmetry in year t as shown in Table 5. This finding confirms that adopting a marketing investment decision that considers the degree of information asymmetry may be an important part of strategy with respect to firm value.
2.6 Conclusion
Discussion
40
if they invested more than their competitors. However, not all acquirers benefit equally. The results demonstrate the contingent role of information asymmetry on a subset of main effects. I observe that the impact of marketing investment is stronger and longer when the degree of information is high.
Theoretical Implications
This study enriches the market-based assets literature (Srivastava et al. 1998) by
demonstrating the role of marketing investment in a merger. To the best of knowledge, this study is one of the first to link marketing investments with a merger transaction and firm value. This unique perspective offers important insights into marketing strategy and performance of
acquiring firms. However, the findings are not limited to mergers and acquisitions. For example, they could be extended to other strategic decisions of a firm under the circumstances in which the necessity of aggressive marketing competes with financial inflexibility. In addition, this study adopts the emerging contingency perspective by theoretically addressing and empirically
showing that the degree of information asymmetry moderates the relationship.
Furthermore, the findings advance empirical research on mergers and acquisitions on several fronts. First, I show the potential of the market-based asset framework in resolving complex problems, such as merger success. Strategic fit and integration procedure are among the most important and widely studied factors affecting merger success. However, this study
41
to reveal the moderated, simultaneously endogenous, and heterogeneous effects of post-merger marketing spending.
Managerial Implications
It has been said that acquirers’ attention is more likely to be taken away as they are dealing with suddenly increased firm size, new environments, and complicated integration tasks and managers are more likely to have fewer resources available for marketing strategy. In fact, the results show that combined firms significantly decrease marketing investment post-merger. However, I advocate the opposite. Executives may consider allocating capital to marketing for at least two reasons. First, aggressive marketing limits uncertainty about the merger decision. Second, business performance can be improved due to the signaling role of marketing. However, firms have finite resources in post-merger years, hindering their willingness to invest. A typical observation is that a firm prioritizes investment by sorting it into necessity and discretionary. What’s usually missing is a careful cost-benefit analysis that establishes the credibility of marketing investment. This study helps acquiring firm managers understand intricacies of the post-merger marketing. Although the opportunity cost tends to increase sharply, it would be disastrous for an acquirer to cut marketing investments.
42
2007; Swaminathan et al. 2008; Kurt and Hulland 2013). Third, the findings suggest that firms need to ensure that they have superiority with respect to industry rivals’ marketing investments. Neither benchmarking nor investing more is a trivial task for the acquirer. Yet the findings suggest that such extra marketing efforts may be worthwhile. Finally, this research highlights the need for an immediate advertising investment, as suggested by Tables 7 and 8. In sum, when designing post-merger marketing project, managers need to allocate budgets while accounting for its effectiveness, rivals’ investment, information asymmetry, and shorter-term time horizon of execution.
Limitations
This study has several limitations. First, the use of advertising expenditure as a proxy is limited. Although I believe advertising captures a more relevant facet of marketing in a merger context (McAlister et al. 2007), it would be worthwhile to examine the importance of marketing as a source of information in several directions. For example, in some industries, the role of advertising may be limited, and future studies may wish to employ alternative measures. Future research also may explore the importance of the quality of marketing. Second, this study
suggests that acquirers can outperform competitors as a result of the communication with
investors. If so, what other kind of channels of communication are common? For firms with poor advertising or that are in industries in which advertising is less effective, other sources of
43
CHAPTER 3 – ESSAY 2: POST-MERGER RETURNS TO MARKETING PRODUCTIVITY
3.1 Introduction
This dissertation focuses on understanding marketing accountability by investigating the links among marketing investments, marketing productivity, and firm value. While the relations between marketing investments and firm value is studied in the previous chapter, less is explored about the links between marketing productivity and firm value. The current chapter examines the relationships by analyzing 1) the sources and effects of merger-induced changes in marketing productivity, and 2) the links between marketing and other functions in creating firm value and competitive advantage.