BLOOMING WHERE THEY’RE PLANTED: CLOSING COGNITIVE ACHIEVEMENT GAPS WITH NON-COGNITIVE SKILLS
Elaina Michele Sabatine
A dissertation submitted to the faculty of the University of North Carolina at Chapel Hill in partial fulfillment of the requirements for the degree of Doctor of Philosophy in the School of Social Work
Chapel Hill 2019
ABSTRACT
ELAINA SABATINE: Blooming Where They’re Planted: Closing Cognitive Achievement Gaps With Non-Cognitive Skills
(Under the direction of Dr. Melissa Lippold)
For the last several decades, education reform has focused on closing achievement gaps between affluent, white students and their less privileged peers. One promising area for addressing achievement gaps is through promoting students’ non-cognitive skills (e.g., self-discipline, persistence). In the area of non-cognitive skills, two interventions – growth mindset and stereotype threat – have been identified as promising strategies for increasing students’ academic achievement and closing achievement gaps. This dissertation explores the use of growth mindset and stereotype threat strategies in the classroom, as a form of
academic intervention.
Paper 1 examines the extant evidence for growth mindset and stereotype threat interventions. Paper 1 used a systematic review and meta-analysis to identify and analyze 24 randomized controlled trials that tested growth mindset and stereotype threat interventions with middle and high school students over the course of one school year. Results from meta-analysis indicated small, positive effects for each intervention on students’ GPAs. Findings highlight the influence of variation among studies and the need for additional research that more formally evaluates differences in study characteristics and the impact of study characteristics on intervention effects.
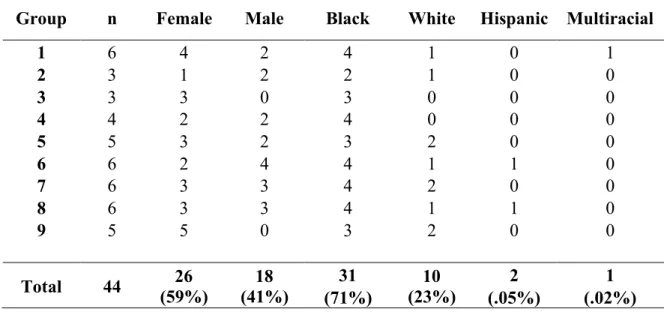
9 focus groups with 44 middle school students in 3 rural, low income middle schools.
Emergent themes included participants’ beliefs that all students are smart, that some teachers feel that certain students are smarter than others, and that students feel smartest when their teachers provide instrumental support and show emotional care. Findings highlight the capacity for middle school students to observe concepts like ability, identity and stereotypes in their teachers’ behavior and the resulting impact on their motivation and beliefs about the nature of intelligence.
Per Frances Sabatino e Abramo Manzi, chi hanno capito il valore delle donne che hanno ricevuto un'istruzione,
ACKNOWLEDGMENTS
I’d like to begin by thanking my chair, Melissa Lippold, for her guidance and support throughout my doctoral program and, especially, during the dissertation process. I would also like to extend my gratitude to my committee members: to Amy Blank Wilson, for going above and beyond in providing her expertise and knowledge of qualitative methods and analysis; to Din Chen for his encouragement and willingness to discuss in great detail each analytic decision of my meta-analysis; to Jill Hamm, for sharing her wealth of knowledge and experience with education research and school-based intervention; and finally, to Natasha Bowen, who encouraged me to pursue a doctorate in social work and who was instrumental in helping me to view education from a social work lens – without her, I would never have ended up in this program nor would I hold this degree. I’d also like to thank Kirsten Kainz for sharing her support, humor and perspective throughout my time in the program.
scientists who refused to let me succumb to the stereotypes imposed on me by my own educational experiences: that a tender heart and creative mind is necessarily less empirical, methodical or capable. My great hope is that all students could be so lucky to grow up surrounded by people who believe so fully in their abilities.
To the Dream Team, I cannot express how thankful I am for the incredible fortune of having arrived in Chapel Hill at the same time as y’all. I can say with 100% certainty that I would not have completed the process without y’all, nor would I want to. Thanks for your humor, brilliance and strength. To the Less Fam, much of this dissertation is the direct result of our friendship – from the chats in our classrooms at the end of long days or in the Belly of the Whale on long road trips. Thanks for always being willing to deconstruct worldviews, to view things from different angles and – especially – to bring Thomas to the long hours and tough days. Y’all are a gift.
To the students of ENC STEM, I hope y’all never doubt your capacity for growth and the power embedded in the core of who you are. Y’all never cease to surprise me with your brilliance, energy and love. Thanks for continually investing in our family. You are changing the narrative of what’s possible for students in Eastern North Carolina.
TABLE OF CONTENTS
LIST OF TABLES ... x
LIST OF FIGURES ... xi
INTRODUCTION... 1
References: Introduction ... 5
PAPER I: STEREOTYPE THREAT AND GROWTH MINDSET: A META-ANALYSIS OF INTELLIGENCE BELIEFS AS INTERVENTION TARGETS FOR IMPROVING ACADEMIC OUTCOMES………...7
Introduction ... 7
Methods: Systematic Review ... 14
Results: Systematic Review ... 16
Methods: Meta-Analysis ... 21
Results: Meta-Analysis ... 34
Discussion ... 36
Conclusion... 47
References: Paper I ... 48
Tables: Paper I ... 57
Figures: Paper I ... 73
PAPER II: MINDSETS AND STEREOTYPES OF INTELLIGENCE: TEACHER BEHAVIORS THAT MOTIVATE STUDENTS TO ACHIEVE………...80
Introduction ... 80
Results ... 101
Discussion ... 113
Conclusion... 126
References: Paper II ... 127
Tables: Paper II... 136
Appendices: Paper II ... 138
PAPER III: TRANSLATING GROWTH MINDSET AND STEREOTYPE THREAT THEORIES TO THE CLASSROOM: A QUALITATIVE ANALYSIS………..139
Introduction ... 139
Methods ... 148
Results ... 157
Discussion ... 165
Conclusion... 173
References: Paper III ... 174
Tables: Paper III ... 182
Appendices: Paper III ... 183
SUMMARY ... 185
LIST OF TABLES
Table 1.1: List of excluded studies ... 57
Table 1.2: Description of stereotype threat studies ... 58
Table 1.3: Description of growth mindset studies ... 62
Table 1.4: Effects of stereotype intervention ... 64
Table 1.5: Effects of growth mindset intervention ... 66
Table 1.6: Meta-analysis of stereotype threat intervention on GPA of threatened students ... 68
Table 1.7: Meta-analysis of growth mindset intervention on GPA of all students ... 69
Table 1.8: One study removed sensitivity test for stereotype threat meta-analysis ... 70
Table 1.9: One study removed sensitivity test for growth mindset meta-analysis ... 71
Table 1.9: One study removed sensitivity test for growth mindset meta-analysis, with Brougham (2016) removed ... 72
Table 2.1: Demographics of focus groups ... 136
Table 2.2: Summary of themes ... 137
LIST OF FIGURES
Figure 1.1: Identification of eligible studies. ... 73
Figure 1.2: Risk of bias assessment across stereotype threat studies.. ... 74
Figure 1.3: Risk of bias assessment across growth mindset studies... ... 75
Figure 1.4: Summary of outcomes, populations and samples for stereotype threat studies... ... 76
Figure 1.5: Summary of outcomes, populations and samples for growth mindset studies... ... 77
Figure 1.6: Forest plot for meta-analysis of stereotype threat intervention on GPA... ... 78
INTRODUCTION
BLOOMING WHERE THEY’RE PLANTED: CLOSING COGNITIVE ACHIEVEMENT GAPS WITH NON-COGNITIVE SKILLS
For decades, education reform has focused on identifying and addressing factors that contribute to gaps in academic performance between affluent, white students and their less privileged peers – often, students of color and students from low income families (Kena et al., 2016). Many reform efforts have focused on meeting students’ social and emotional needs and the resulting impact on their school performance (Brown, 2013). To describe the importance of supporting students’ social and emotional development, Heckman and Rubenstein (2001) popularized the term non-cognitive skills to refer to factors like self-discipline and perseverance, which they observed as key characteristics separating students who dropped out of high school and those who persisted through graduation. Subsequent research has examined the schools’ role in supporting students’ acquisition of non-cognitive skills as a strategy for improving students’ academic performance.
Growth Mindset and Stereotype Threat as Interventions
Specifically, several studies have looked at students’ beliefs and experiences with school, examining students’ perceptions of ability and sense of belonging as critical factors in promoting students’ development of non-cognitive skills and in predicting students’
encouraging students to hold a growth mindset of ability has been associated with gains in academic performance, particularly among low income students and students of color (e.g., Blackwell, Trzesniewski, & Dweck, 2007; Good, Aronson, & Inzlicht, 2002; Paunesku, Walton, Romero, Smith, Yeager, & Dweck, 2015; Yeager et al. 2014; Yeager et al., 2016). In addition, Cohen and colleagues (2006) have extended Steele and Aronson’s (1995) work on the phenomenon of stereotype threat to explore the interplay between students’ beliefs about their identities, their sense of belonging in school and how well the perform in class.
Negative stereotypes that link specific identities (e.g., gender, race/ethnicity) to low ability can create threat that suppresses academic achievement, but interventions to reduce threat via identify affirmation have been linked with long-term improvements in students’ achievement (e.g., Cohen, Garcia, Purdie-Vaughns, Apfel, & Brzustoski, 2009; Sherman et al., 2013).
evaluation efforts where teachers implement growth mindset and stereotype threat intervention strategies.
Dissertation Papers
Paper 1, “Stereotype Threat and Growth Mindset: A Meta-Analysis of Intelligence Beliefs as Intervention Targets for Improving Academic Achievement,” consolidates the research that has been conducted on growth mindset and stereotype threat interventions and their effects on student achievement (e.g., grades, GPA, test scores). Paper 1 assesses intervention effects first by conducting a systematic literature review to consolidate the randomized controlled trials that have tested each intervention and second by conducting meta-analyses that separately summarize each intervention’s effects. Paper 1 also includes a discussion of factors that may affect intervention success, contributing to the knowledge base around how and for whom these interventions should be implemented.
teachers’ behavior. Such measures would be a helpful resource in future intervention evaluations, including structural models that can provide more detail on the mechanisms among teacher behaviors, students behaviors and student achievement.
Paper 3, “Translating Growth Mindset and Stereotype Threat Theories to the Classroom: A Qualitative Analysis,” provides a basis for understanding how teachers organically implement growth mindset and stereotype threat strategies in their classrooms when they have been exposed to information and resources about the two theories. Paper 3 uses qualitative data from classroom observations and interviews with middle school teachers in a high need school to explore ways that teachers integrate these theories into their daily practice. In addition, teachers discussed the impact of using these strategies – including both benefits and drawbacks – which provides helpful context for future implementation of these strategies in schools.
REFERENCES: INTRODUCTION
Blackwell, L. S., Trzesniewski, K. H., & Dweck, C. S. (2007). Implicit theories of
intelligence predict achievement across an adolescent transition: A longitudinal study and an intervention. Child Development, 78(1), 246-263.
doi:10.1111/j.1467-8624.2007.00995.x
Brown, E. (2013). No child left behind and the teaching of character education. ABNF Journal, 24(3), 77-82.
Cohen, G. L., Garcia, J., Apfel, N., & Master, A. (2006). Reducing the racial achievement gap: A social-psychological intervention. Science, 313, 1307–1310.
doi:10.1126/science.1128317
Cohen, G. L., Garcia, J., Purdie-Vaughns, V., Apfel, N., & Brzustoski, P. (2009). Recursive processes in self-affirmation: Intervening to close the minority achievement
gap. Science, 324(5925), 400-403. doi:10.1126/science.1170769
Dweck, C. S. (1999). Self-theories: Their role in motivation, personality, and development. Philadelphia, PA: Psychology Press.
Dweck, C. S. (2006). Mindset: The new psychology of success. New York, NY: Random House.
Edwards, A. R., Esmonde, I., Wagner, J. F., & Beattie, R. L. (2017). Learning mathematics. In R. E. Mayer & P. A. Alexander (Eds.), Handbook of research on learning and instruction (pp. 57–80). New York, NY: Routledge.
Good, C., Aronson, J., & Inzlicht, M. (2003). Improving adolescents' standardized test performance: An intervention to reduce the effects of stereotype threat. Journal of Applied Developmental Psychology, 24(6), 645-662.
doi:10.1016/j.appdev.2003.09.002
Heckman, J. J., & Rubinstein, Y. (2001). The importance of noncognitive skills: Lessons from the GED testing program. American Economic Review, 91(2), 145-149. doi:10.1257/aer.91.2.145
Kena, G., Hussar, W., McFarland, J., de Brey, C., Musu-Gillette, L., Wang, X., ... & Barmer, A. (2016). The Condition of Education 2016. NCES 2016-144. National Center for Education Statistics.
Paunesku, D., Walton, G. M., Romero, C., Smith, E. N., Yeager, D. S., & Dweck, C. S. (2015). Mind-set interventions are a scalable treatment for academic
Sherman, D. K., Hartson, K. A., Binning, K. R., Purdie-Vaughns, V., Garcia, J., Taborsky-Barba, S., . . . Cohen, G. L. (2013). Deflecting the trajectory and changing the narrative: How self-affirmation affects academic performance and motivation under identity threat. Journal of Personality and Social Psychology, 104(4), 591-618. doi:10.1037/a0031495
Steele, C. M., & Aronson, J. (1995). Stereotype threat and the intellectual performance of African Americans. Journal of Personality and Social Psychology, 69, 797–811. doi:10.1037/0022-3514.69.5.797
Yeager, D. S., Romero, C., Paunesku, D., Hulleman, C. S., Schneider, B., Hinojosa, C., ... & Trott, J. (2016). Using design thinking to improve psychological interventions: The case of the growth mindset during the transition to high school. Journal of Educational Psychology, 108(3), 374. doi:10.1037/edu0000098
Yeager, D. S., Purdie-Vaughns, V., Garcia, J., Apfel, N., Brzustoski, P., Master, A., ... & Cohen, G. L. (2014). Breaking the cycle of mistrust: Wise interventions to
PAPER I
STEREOTYPE THREAT AND GROWTH MINDSET: A META-ANALYSIS OF INTELLIGENCE BELIEFS AS INTERVENTION TARGETS FOR IMPROVING
ACADEMIC OUTCOMES
Growth Mindset
Several decades of mindset research reveal that students’ beliefs about their intelligence are powerful predictors of behavior and achievement (Gonida, Kiosseoglu, & Leondari, 2006; Kloosterman, 1988; Stipek & Gralinski, 1996). Based on seminal work in social psychology by Dweck (1999; 2006) and colleagues, the concept of a growth mindset was borne out of literature on learned helplessness and implicit intelligence theories. Whereas an incremental view of intelligence (growth mindset) states that ability can be increased with effortful practice, an entity view (fixed mindset) states that ability is a stable and predetermined quality that cannot be changed. Research and classroom data consistently show that students’ mindsets drive their level of classroom engagement (Dinger et al., 2013; Elliot & Church, 1997), which is necessary for academic success (Johnson, Crosnoe, & Elder, 2001; Park, Holloway, Arendtsz, & Bempechat, 2012; Sciarra & Seirup, 2008). Students with a growth mindset show greater effort, higher school enjoyment and more positive affect than their peers - and they maintain these behaviors even after they are
unsuccessful on academic tasks (Cimpian, Arce, Markman, Dweck, 2007; Dweck & Leggett, 1988; Elliot & Dweck, 1988). On practically every measure of adaptive school behaviors, students with a growth mindset outperform their fixed mindset peers: They are more resilient, cooperative, self-regulated and positive, and they are more likely to succeed academically (Senko, Hulleman, & Harackiewicz, 2011).
helplessness, goal choice and strategy use in overcoming failures (Cimpian, et al., 2007; Mueller & Dweck, 1996). Based on this work, various strategies to promote students’ growth mindset beliefs have been developed and tested as academic interventions. Aronson, Fried and Good (2002) designed a pen pal experiment where undergraduate students corresponded with fake middle school students who were purportedly struggling in school. End of semester GPAs were higher among undergraduate students who received growth mindset training to assist their pen pal compared to those students who did not receive growth mindset training. Similarly, middle school students who were taught about the growth mindset in two 90-minute sessions by a real college-aged mentor (with whom they corresponded via email throughout the school year) scored higher on end of grade standardized assessments in math than those in a control group (Good, Aronson, & Inzlicht, 2003). Finally, Blackwell et al. (2007) found improvements in course grades among students who participated in a six-week growth mindset course. Subsequent studies have focused on the efficacy of scaling up the intervention developed by Blackwell and colleagues (2007), using web-based modules that have replicated achievement effects in samples as large as 3,000 students (Paunesku, Walton, Romero, Smith, Yeager, & Dweck, 2015; Yeager et al. 2016).
Stereotype Threat
Quinn, & Spencer, 1998; Blascovich, Spencer, Quinn, & Steele, 2001; Mangels, Good, Whiteman, Maniscalco, & Dweck, 2012; Rydell, Shiffrin, Boucher, Van Loo, & Rydell, 2010; Steele & Aronson, 1995). The phenomenon of stereotype threat is well-documented among black and Hispanic students, as well as women in male-dominated subjects like math and science (Steele and Aronson, 1995; Steele & Aronson, 2000). Threat can be reduced by providing messages about the equality of students’ abilities, regardless of racial, ethnic or gender identity. For example, in some studies, a simple statement denoting that men and women perform equally well on a difficult math exam before its administration has been sufficient to eliminate gender gaps in performance (Spencer, Steele, & Quinn, 1999). The same is true for racial differences in performance between white and non-white students (Steele & Aronson, 1995).
In school, stereotype threat can manifest in response to a particular task (e.g.,
standardized tests), but a more chronic form of threat also exists in the day-to-day classroom environment. A powerful source of stereotype threat occurs when students’ identities are not positively affirmed by their school experiences, leading them to internalize negative
stereotypes about their intelligence. Extending Steele and Aronson’s work to the classroom setting, Cohen et al. (2006) identified that negative school experiences can compound students’ beliefs about intelligence-based stereotypes in reducing academic achievement. In response, they conceptualized an identify-affirming intervention to combat stereotype threat in schools using brief, written reflections on personal values. Unlike growth mindset
value reflections prior to potentially stressful school events (e.g., before the end of the grading period, before standardized exams), when threat is likely to be high. They
hypothesized that having students engage in a positive reflection about themselves and their values just prior to a potentially threatening school event may encourage students to make positive attributions between their identities and their school performance, thereby reducing threat posed by stereotypes. Cohen and colleagues (2006; 2009) suggest that this process of identity affirmation may provide the same initial threat reducing benefits conceptualized by Steele and Aronson (1995), but may also trigger a “cascade” of positive school experiences that produce long term effects on students’ academic achievement. Indeed, in some studies, the values reflection intervention has been associated with a reduction in achievement gaps and improvements in students’ grade point averages (GPAs) for up to three years (Cohen et al., 2009; Sherman et al., 2013).
Distinction between Stereotype Threat and Growth Mindset Approaches
Although intelligence-based stereotypes may represent a specific type of fixed mindset beliefs (e.g., I can’t get better at math because I am a girl), the two interventions are conceptually distinct (Good et al., 2003), and the interventions often target different
have often been targeted toward and tested on different populations, making it difficult to compare them.
In general, the values affirmation task has primarily been tested on and shown effects mostly among stereotyped groups (e.g., racial minority groups). In contrast, growth mindset interventions have been tested on general student populations and have shown effects among a broad range of students. Thus, it would be inappropriate to aggregate and analyze combined data from both interventions, as there is little reason to believe that the interventions are directly interchangeable (Blackwell et al., 2007; Cohen et al., 2006; Cohen at al., 2009). Accordingly, in this meta-analysis, growth mindset and stereotype threat interventions will be evaluated separately for their effects.
Adolescence and the School Context
Growth mindset and stereotype threat interventions have shown promise with
can form intelligence and identity beliefs that negatively affect their school performance – a process that may help explain a characteristic pattern of achievement that drops as students enter middle school (Blackwell et al., 2007). Though on average, achievement begins to rise as students progress through high school, for some, disengagement in early adolescence cements a trajectory of poor performance that affects the rest of their academic careers (Eccles, Lord, & Midgley, 1991; Gutman & Midgley, 2000; Midgley, Feldlaufer, & Eccles, 1989; Wigfield, Eccles, Mac Iver, Reuman, & Midgley, 1991). Given this possibility, early intervention is critical, and evaluating how growth mindset and stereotype threat
interventions operate with middle and high school students is important for identifying effective strategies for promoting academic achievement at a pivotal time in students’ lives.
Purpose of Present Study
questions:
1. In middle and high school students, how does growth mindset intervention compared to control activities affect students’ GPA within one academic year? 2. In middle and high school students of threatened identities (e.g., black and
Hispanic students), how does stereotype threat intervention compared to control activities affect students’ GPA within one academic year?
Methods: Systematic Review Study Selection and Data Abstraction
Eligibility criteria. This study adhered to the PRISMA guidelines for systematic
review and meta-analysis (Moher, Liberati, Tetzlaff, Altman, & PRISMA Group, 2009). The review includes only randomized interventions designed to increase academic achievement either by reducing stereotype threat or by increasing students’ growth mindset beliefs. Studies must have used at least one experimental group and one control group, with random assignment to each condition. Interventions were considered stereotype threat-reducing if they met one or more of the following criteria: (1) affirming students’ identities within the school context; (2) promoting students’ sense of belonging in school; or (3) promoting the idea that anxiety about school is common among all racial, ethnic and gender identities. Growth mindset interventions were categorized as (1) teaching students that intelligence is malleable and/or that they can “grow their brains”; (2) promoting effortful practice as a strategy for academic improvement; or (3) encouraging students to perceive challenge as a sign of learning.
aim to improve long-term academic performance. The outcomes of interest for both interventions are indicators of academic achievement, specifically: course grades,
standardized exam scores and/or grade point average (GPA). Studies were included if they measured at least one of these outcomes. Randomized control trials (RCTs) that manipulate stereotype threat or growth mindset beliefs to assess immediate outcomes (e.g., test
performance directly following cognitive primes) were excluded.
To avoid differences in the structure of education systems and the cultural norms surrounding stereotypes and intelligence, studies were excluded if they were conducted outside of the United States or were not published in English. Studies that were published before 1980 were excluded from this review because the conceptual frameworks for growth mindset and stereotype threat, as they are defined here, were not identified prior to this date. Conference proceedings, dissertations and other unpublished work were eligible for inclusion to reduce the risk of publication bias.
Information sources. Seven electronic databases were used to identify articles for
review: PubMed, Web of Science, PsychINFO, ERIC, Education Full Text, Social Work Abstracts and the publications and products search tool of the Institute of Education
Sciences. The following keyword search was used in each database: “growth mindset” OR “fixed mindset” OR “incremental intelligence” OR “incremental theory” OR “incremental beliefs” OR “entity beliefs” OR “entity theory” OR “implicit intelligence theor*” OR “stereotype threat” AND school OR learn* OR academ* OR grade OR educ*. In all EBSCO databases (PsychINFO, ERIC, Education Full Text, and Social Work Abstracts), the
the advanced search options of “psychology social,” “psychology educational,” “education,” “education research,” and “psychology multidisciplinary” were used.
Study selection and data abstraction. In each search, studies were initially reviewed
by title and abstract simultaneously. Documents that potentially met inclusion criteria were retrieved from each search, and duplicates were removed before full-text review. See Table 1.1 and Figure 1.1 for more details on study selection. Data abstractions of included studies were conducted with coding spreadsheets that captured both study characteristics and empirical findings, in addition to data regarding effect sizes (e.g., test statistics, standard deviations, standard errors, variance, sample sizes). If studies reported standardized effect sizes, they were noted in the abstraction forms.
Results: Systematic Review
assignment, one was on observational study, and three used non-American or undergraduate samples. See Figure 1.1 and Table 1.1 for more detail on the selection process. In total, this search resulted in 13 stereotype threat studies published in 12 articles and 11 growth mindset studies published in 12 articles. Sherman et al. (2013) and Eskreis-Winkler et al. (2016) contain evaluations of two separate implementations of stereotype threat and growth mindset interventions, respectively.
Assessing risk of bias. The risk of bias assessment tool provided by the Cochrane
Collaboration (Higgins & Green, 2011) identifies five areas of potential bias for systematic reviews/meta-analyses: selection bias, performance bias, detection bias, attrition bias and reporting bias. The issue of selection bias, or systematic variation among groups at the outset of an intervention, is low in this review because it includes only studies with random
growth mindset interventions with more lengthy procedures (e.g., Blackwell et al., 2007; Good et al., 2003), where students were assigned to different in-school courses, students in the control group participated in programs structurally similar to the intervention but with different messaging. For example, control group students experienced the same number and length of sessions as experimental group students, but learned about brain anatomy or study skills and not the malleable nature of intelligence. Again, because these studies did not explicitly mention efforts to keep students unaware of their treatment condition, they were not considered to be blinded, a potential source of bias.
Both interventions have been conducted throughout the school year, ranging from a semester to one or several academic years, suggesting that attrition may be a potential source of bias in these studies. Across the 24 studies from both types of intervention, three studies failed to mention retention of participants (Good et al., 2003, Protzko & Aronson, 2016; Shnabel, Purdie-Vaughns, Cook, Garcia, & Cohen, 2013). Of the remaining studies, all reported that attrition occurred throughout the study. Eight studies reported attrition rates of around 5% or less and/or reported findings to support that attrition was not systematic to treatment group, race/ethnicity, gender or other demographic variables (Blackwell et al, 2007; Borman et al., 2016; Bowen et al., 2013; Burnette, Russell, Hoyt, Orvidas, & Widman, 2017; Cohen et al., 2009; Eskreis-Winkler et al., 2016, Study 4; Hanselman, Rozek, Grigg, Borman, 2017; Sherman et al., 2013, Study 1). Five studies reported high attrition rates, between 20-25% (Bratter, Rowley, Chukhray, 2016; Brougham, 2016; Sherman et al., 2013, Study 2; Simmons, 2013; Wilkins, 2014). Of these, two reported that attrition varied
Included studies were also analyzed for reporting bias, which revealed that five studies failed to report findings from all planned analyses (Borman et al., 2016; Cohen et al., 2009; Good et al., 2003; Oyserman, Bybee, & Terry, 2003; Paunesku et al., 2015). However, for two of these studies, supplemental data was available to include results from analyses that were not published (Borman et al., 2016; Cohen et al., 2009), leaving only three studies with incomplete reporting around outcomes.
In general, though both intervention categories are subject to bias due to attrition, the overall risk of bias in this review is likely low, as bias is low across most categories (Higgins et al., 2011). See Figures 1.2 and 1.3 for more detail on the risk of bias in this review.
Characteristics of Included Studies
Intervention design. Among the 13 studies in the stereotype threat category, there
affirmation, the reflections were messaged as a regular school activity (rather than a research task) and were conducted prior to a stressful or evaluative event (e.g., the end of the grading period or before a standardized test) to affirm students’ identities when threat is likely high. Nine studies (70%) reported effects on student GPA, four (31%) reported effects on course grades and three (23%) reported effects on standardized test scores (some studies reported on more than one outcome). Two studies were dissertations (Simmons, 2012; Wynne, 2011), and the remaining ten studies were published in peer-reviewed journals. See Table 1.2 and Figure 1.4 for a full description of included stereotype threat studies.
Compared to the stereotype threat interventions, among the 11 studies in the growth mindset category, there was more variability in the methods and duration of the intervention, ranging from one 45-minute lesson to 11 weekly hour-long sessions. Some studies
exclusively taught students about the malleable nature of intelligence, while others added mentorship, emphasized effortful practice or focused on retraining students’ attributions about teachers’ critical feedback on assignments. Despite this variability in procedures, all interventions were designed to promote students’ effortful engagement in school by
modifying their perceptions of intelligence and ability. Eight studies (73%) reported effects on student GPA, two (18%) reported effects on course grades and two (18%) reported effects on standardized test scores (some studies reported effects on more than one outcome). See Table 1.3 and Figure 1.5 for a full description of included growth mindset studies.
Participants. The stereotype threat studies included in this review have a combined
largely on the academic performance of black, Hispanic and white students, but in some cases, students were categorized simply as having potentially threatened identities (i.e., black or Hispanic) or non-threatened identities (i.e., white or Asian), but were not described
further. In eight stereotype threat studies, results were presented on intervention effects for both threatened and nonthreatened identities, but in the remaining five studies, results were reported for students of threatened identities only (see Figure 1.4). Six studies were
conducted among multiple schools with varying populations, combining data from students in predominantly black schools, predominantly white schools, low/high performing and high/low income schools, etc. Though multilevel models were used to consider between school differences in these studies, analyses were typically not broken down further by school type. The remaining seven studies that were conducted in one school were largely low income and low performing schools, with at least half of the student population identifying as black or Hispanic. See Table 1.2 for more detail.
The growth mindset studies included in this review have a combined sample size of 7,781, which also varied widely among studies, with an average of 708 students per study (SD = 1,093). Six studies (55%) were conducted with middle school students and five (45%) with high school students. Schools characteristics varied among studies, but of the four studies that were conducted in one school, three were low income schools with student populations that were at least half black or Hispanic. See Table 1.3 and Figure 1.5 for more detail.
To evaluate an intervention, meta-analysis can be used to combine findings across a collection of studies to more closely estimate its true effect size (Lipsey & Wilson, 2001). Several important decisions must be made before attempting to conduct a methodologically sound and trustworthy meta-analysis, including:(1) choosing and calculating the effect size, (2) choosing a fixed effect or random effects model and assessing heterogeneity, (3) defining outcome variables (4) specifying the populations of interest and (5) considering issues of power. Each of these decisions will be discussed further in the following sections.
Calculating effect sizes. This study uses Cohen’s d to calculate the average effect of
growth mindset and stereotype threat interventions on students’ GPAs. The included studies used linear and multilevel regression models, independent sample t-tests and one-way ANOVA – and they reported regression coefficients and t and F test statistics, respectively. When Cohen’s d was not reported, test statistics were converted to a Cohen’s d, a
standardized mean difference (Littell, Corcoran, & Pillai, 2008). Per notation from
Borenstein, Hedges, Higgins and Rothstein (2011), Cohen’s d is calculated by dividing the difference in means between a treatment and control group by their pooled standard deviation:
d = '!"#$!"% ())*+,
available, but the variance or group sample size was unavailable (Good et al., 2003; Shnabel et al., 2014). For three growth mindset studies, Cohen’s d was available, but the variance was unavailable (Good et al., 2003; Yeager et al., 2014 – Study 3; Yeager et al., 2016 – Study 2). The effect sizes for these studies were recalculated using available test statistics (i.e., t and total sample size). Of the five studies for both stereotype threat and growth mindset where published effect sizes needed to be recalculated, in three studies, the calculated effect size was the same as the published effect size. In two studies (Good et al., 2003, Yeager et al., 2014 – Study 3), the calculated and published effect sizes did not match. For the Good et al., (2003) stereotype threat study, the reported effect size was d = 1.51 and the calculated effect size was d = 1.71. For the Good et al. (2003) growth mindset study, only one of three
calculated effect sizes did not match the three published effect sizes. The reported Cohen’s d for female’s math standardized test scores was d = 1.13 and the calculated effect size was d = 1.31. For the Yeager et al. (2014) study, d = .62 was the calculated effect size vs. d = .54 that was published). See Tables 1.6 and 1.7 for more detail on available statistics used to enter or calculate effect sizes for each study.
possible, Cohen’s d was used to estimate average treatment effects. A comparison of estimates using Cohen’s d on the full sample versus using Hedge’s g on a reduced sample showed that substantive findings did not change. In sum, it is unlikely that the use of Cohen’s d inflated the results presented here, and Cohen’s d was used in all subsequent analyses.
Separate meta-analyses were conducted by intervention type (i.e., growth mindset and stereotype threat) using Comprehensive Meta-Analysis (3.0; Borenstein, Hedges, Higgins, & Rothstein, 2005), according to the following formula:
-∗ = ∑314#01∗21
∑314#01∗
where the average effect size is the weighted mean effect size (-∗), a function of the sum of the products of the individual effect sizes (56)and their weights (86∗), divided by the sum of their weights (Borenstein et al., 2011). All effect sizes were weighted based on sample size and standard error of the effect size (Borenstein et al., 2011). Studies were weighted using an inverse variance approach, according to the following formula:
86 = 9
:;%<=> ?%
The squares becomes larger with higher weight values. Studies with large confidence
intervals around their effect sizes have smaller boxes because these estimates are considered to be less precise. Studies with small confidence intervals around their effect sizes have larger boxes because these estimates are considered to be more precise. To produce the most precise point estimate possible, studies represented by small boxes factor into the overall estimate less than studies whose effect sizes are represented by larger boxes. This weighting process increases confidence in the overall point estimate, as it emphasizes studies with effect sizes that are more likely to be accurate estimates of the true effects of the
interventions.
Fixed effects vs. random effects model. This study used a random effects model,
Random effects models are especially important when the heterogeneity in studies is high; therefore, as a preliminary step, two heterogeneity statistics were calculated: The Q and I2 statistic (Borenstein et al., 2010, Borenstein et al., 2011). Heterogeneity of the sample of studies in each intervention category was first assessed using the Q statistic, according to the following formula:
Q = ∑E6F986(56− -)2
where Wi is the study weight, Yi is the study’s effect size, M is the average effect size
of all studies, and k is the number of studies in the sample. In essence, the Q statistic is a weighted sum of squares that captures how much each study’s individual effect size deviates from the average effect size (Borenstein et al., 2011). The Q statistic is evaluated through a chi-square test to determine whether studies in the sample are significantly different from one another (i.e., p <.05), which was the case for both the meta-analysis of stereotype threat interventions (Q = 26.61, p <.001) and growth mindset interventions (Q = 16.245, p <.01). These Q statistics suggest there is high heterogeneity among studies for both types of interventions.
Heterogeneity was also assessed using the I2 statistic, which indicates the proportion of the variance in the results of the meta-analysis that may be attributable to differences among studies (Higgins et al., 2003; Higgins & Thompson, 2002). In a random effects model, the distribution of effect sizes has its own variance, expressed as B2. Heterogeneity between studies can be assessed using the I2 statistic, which is a function of the variation in effect sizes between studies in the analytic sample (B2) and sampling error, according to the following equation:
I2 values are expressed as a percentage, with larger values indicating greater
heterogeneity in effect sizes across studies. In the final samples, stereotype threat studies had an I2 value of 69.94 and growth mindset studies had an I2 value of 63.06, meaning that in each category, roughly 60-70% of the variation in the average effect size may be attributable to heterogeneity among studies (Higgins & Thompson, 2002). These I2 values fall at or just outside the high end of the Cochrane Collaboration’s range for moderate heterogeneity (30-60%; Higgins & Green, 2011), which indicates that a portion of the variance in the point estimates may be attributable to differences between studies.
In sum, both the Q and I2 statistics suggest high heterogeneity in our sample. Though heterogeneity is not uncommon in meta-analyses and is addressed through the use of a random effects model, it can also indicate that there may be moderating effects of study characteristics (e.g., type of academic outcome, student population; Borenstein et al., 2010; 2011, Higgins et al., 2003). To reduce the likelihood that these between-study differences confound our findings, we specified outcome variables and student populations to be as homogeneous as possible, explained in further detail in the next two sections.
Defining academic outcomes. Inthis study, we focus on overall GPA as the primary
studies reported on more than one type of outcome, there is evidence that effects of academic interventions vary substantially between effects on standardized outcomes (i.e., standardized test scores) and effects on non-standardized outcomes (i.e., grades; Castro et al., 2015). In particular, changes to students’ beliefs about themselves are often more strongly linked with changes in their grades, which would be reflected in their GPA, compared to standardized test scores (Hansford & Hattie, 1983; Valentine, DuBois, & Cooper, 2004). Third, even among non-standardized outcomes, students’ full GPA can often be a more reliable measure of achievement than single course grades (Bacon & Bean, 2006), and the difference between course grades and full GPA provides a level of distinction between whether the intervention effects generalized to students’ academic performance broadly or whether effects were confined to a specific course (Cohen et al., 2009). Finally, GPA is most commonly used for future academic decisions and outcomes (e.g., college acceptance), and identifying
interventions that boost students’ overall school performance would be helpful in supporting future academic success (Belfield & Crosta, in press; Noble & Sawyer, 2004; Noble & Sawyer, 2002).
Our analysis included GPA effects during the school year in which the intervention was conducted. In one study (Sherman et al., 2013 – Study 2), effect sizes were reported from two time points during the academic year (i.e., end of first semester, end of year). Because the intervention was not concluded at the end of the first semester, and the
one study (Wynne, 2011) reported effects across students’ courses individually. To address this, per Borenstein (2011), when a study reports multiple outcomes from the same
participants at the same time, they can be averaged together to create a composite effect size. Because effect sizes from all courses were presented in the Wynne (2011) study, they were combined to create a composite effect size for GPA (Bacon & Bean, 2006; Borenstein, et al., 2011). See Tables 1.6 and 1.7 for more detail. One growth mindset study (Oyserman et al., 2015) and four stereotype threat studies (Borman et al., 2016; Cohen et al., 2009; Hanselman et al., 2014; Sherman et al., 2013 – Study 1) provided one-year follow up data, but because there are only a small number of studies with follow-up data, they were not included in the meta-analyses but will be discussed further descriptively. In addition to the quantitative summary of GPA effects, we also discuss effects on single course grades and standardized test scores. Because few studies provided data on these outcomes, they will be discussed descriptively, rather than via meta-analysis, as descriptive analysis can still contribute to the understanding of intervention effects (Loeb, Dynarski, McFarland, Morris, Reardon, & Reber, 2017).
Populations of interest. We assessedthe impact of each intervention on its target
Stereotype threat interventions typically target a threatened group (e.g., black and Hispanic students), and some studies report effects on the threatened group only. Thus, the analysis in this study included data from black/Hispanic students only. In only one study (Good et al., 2003), gender was used to determine threatened vs. nonthreatened groups (i.e., boys and girls). Because this study assessed effects on standardized test scores, it is not included in the meta-analysis but will be discussed further descriptively. As a result, this meta-analysis reflects the difference in achievement between black and Hispanic students who received the intervention and black and Hispanic students who did not.
Data from students of non-threatened identities (i.e., white and Asian students) were excluded for two reasons. First, stereotype threat interventions target those students whose performance may be suppressed by negative stereotypes about their intelligence or academic ability – which many studies identify as students of color. Second, data from threatened groups was presented in all stereotype threat studies included in this review, while data from the whole sample or from non-threatened students was not available in most studies. One study (Wynne, 2011) was conducted in a school where all students identified as either black or Hispanic, and four other studies (Borman et al., 2016; Good et al., 2003; Protzko & Aronson, 2016; Simmons, 2013) reported analyses for threatened students only. In sum, focusing on intervention effects among students of threatened identities not only retains the largest analytic sample possible but also estimates effects for the population the intervention was designed to support.
several studies included in this analysis do not report results by racial subgroup and instead collapse student data to report comparisons between threatened and non-threatened students (Borman et al., 2016; Hanselman et al., 2017).
Issues of power. For many quantitative analyses, power calculations are used to
assess whether the sample size is sufficiently large to detect effects, reducing the chance of a Type II error – the conclusion that there are no intervention effects when, in actuality, there are (Bachetti, 2013; Hoenig & Heisey, 2001). For a random effects model in a meta-analysis, power is calculated according to the following equation (Borenstein et al., 2011; Valentine, Pigott, & Rothstein, 2010):
G = 1 − Φ(KL− M∗)
where Φ represents the standard normal distribution of KL, the critical value for the standard normal distribution (KL = 1.64 for a one-tailed test at N = .05) minus M∗. M∗ is the estimated average effect size over the square root of the estimated variance of the random effects model (O.∗):
M∗ = QR − 0
TO.∗
O.∗ is a function of the variance of the effect size over the number of effect sizes in the analysis (i.e., the number of studies), k:
O.∗ = O∗
U
The variance O∗ is a function of the average group sample sizes (i.e., treatment, V W, and control, VX) across studies, the estimated effect size and the estimated between-study variance, BA:
In this study, power was calculated separately for both the meta-analysis of stereotype threat and the meta-analysis of growth mindset studies. Nine stereotype threat studies assessed effects on GPA. For the meta-analysis of stereotype threat studies, k = 9, which had average group sample sizes of approximately n = 200 students, power was estimated conservatively, assuming a high level of heterogeneity among studies (per Valentine et al., 2010, BA = 3) and a small effect size (d = .20; Cohen, 1988). Estimated power for this meta-analysis is .99. Three of the nine stereotype threat studies did not provide group sample sizes and were not able to be included in the power analysis (Cohen et al., 2009; Protzko & Aronson, 2016; Shnabel et al., 2013). However, these studies had an average overall sample size of M = 350 (SD = 105), suggesting that their group sample sizes were likely similar to the studies included in the power analysis.
sizes for growth mindset studies is larger than the sample sizes used in our power analysis, which would increase power considerably.
Our power calculations suggest that the meta-analyses in this study are likely adequately powered for stereotype threat studies but may be underpowered for growth mindset studies; however, there is debate in the literature regarding the utility of calculating power for meta-analyses. Some scholars argue that power calculations are most useful in primary studies, when conducted a priori, in order to estimate sufficient sample sizes before participants are recruited (Cumming, 2014; Hoenig & Heisey, 2001; Smith & Bates, 1992). Similarly, others argue that for meta-analysis, calculating power is most helpful for planning reviews in advance (i.e., planning several primary studies that are intended to be used for meta-analysis; Borenstein et al. 2011).
In contrast, for meta-analysis, sample size is determined by available research and inclusion/exclusion criteria. When a high number of studies is available, sample size can be increased by relaxing inclusion criteria. Considering the aims and research questions of this study, the implementations of stereotype threat and growth mindset interventions in schools are relatively new areas of research, where a limited number of studies is available
(Borenstein et al., 2011). Because these interventions have emerging evidence bases, maintaining rigorous study design as part of the inclusion criteria (i.e., RCTs, school-based rather than research laboratory implementation) is important for a quality assessment of these interventions, despite the small sample sizes of studies that test them (Cumming, 2014).
six studies, suggesting that meta-analyses conducted on a small number of studies can still provide important statistical and practical information about interventions (Borenstein et al., 2011).
Results: Meta-Analysis Intervention Effects: Stereotype Threat
Stereotype threat and GPA. Of the nine studies that examined the effect of identity
affirmation on students’ GPAs, four indicated statistically significant improvement among students with threatened identities. Across all studies, effect sizes ranged from d = .00 - .56. Meta-analysis, which averaged the effects across studies, revealed an overall point estimate of d = .19 (SE = .06, p = .01; see Tables 1.4 and 1.6). This estimate is considered a small effect (Cohen, 1988).
Subsequent sensitivity testing was conducted through one study removed analysis (Borenstein et al., 2005; Borenstein et al., 2011), which compares the effect of removing an individual study on the overall point estimate. One study removed analysis provides an additional check on outlier studies that may be influencing overall findings (e.g., Kedzior & Laeber, 2014). For the meta-analysis presented here, the one study removed technique indicated that findings were robust across studies, showing that if any one study was removed from the sample, findings did not change substantially (See Table 1.8).
significant effects of the intervention, did not report significant effects at one-year follow-up (See Table 1.4).
Stereotype threat and exam scores. Although there were not sufficient studies to
conduct meta-analysis, in this section, we descriptively review findings for other outcomes. Only one of the four studies that examined effects on standardized test scores found
significant improvements. Wynne (2011) demonstrated that the values affirmation task boosted students’ math standardized test scores (d = .45). No other studies found significant effects on students’ test scores, with effect sizes ranging from d = -.001 to .28. See Table 1.4 for a summary of the effect sizes for these studies.
Stereotype threat and course grades. Only one of the three studies that assessed
effects in a single course found significant improvements.Bowen et al., (2013) found significant improvements in students’ social studies grades (d = .57), though this sample included both white and black students. Dee (2015) and Bratter et al. (2016) did not find improvements in students’ social studies and English grades, respectively, with effect sizes ranging from d = -.001 to .16. See Table 1.4 for a summary of the effect sizes for these studies.
Intervention Effects: Growth Mindset
Growth mindset and GPA. Among the seven studies that tested the effect of growth
Brougham (2016) in the sample altered the point estimate substantially, changing substantive findings. Without the study, the point estimate is statistically significant (d = .14, SE = .049, p = .004; see Table 1.9), and these results are robust across all other studies (see Table 1.10), suggesting that the Brougham (2016) study may be an influential outlier in these data
(Borenstein et al., 2011). The estimate without Brougham (2016) in the sample, d = .14, would also be considered a small effect (Cohen, 1988).
Not included in this estimate is one year follow-up data from Oyserman et al. (2006). Similar to the results from the stereotype threat intervention, the effect size from this study was larger at one year follow-up, increasing from d = .25 to .30.
Growth mindset exam scores. Two studies examined the effects of growth mindset
intervention on students’ standardized test scores. Oyserman et al. (2006) found significant improvements in the proportion of exams that students passed (d = .36). Good et al. (2003) saw increases in all students’ reading test scores (d = .51), with significant effects for
females’ math scores (d = 1.31) and marginal effects for males’ math scores (d = .62, p = .05)
Growth mindset and course grades. Only two studies assessed effects in specific
course grades. Blackwell et al. (2007) found that participation in the intervention boosted students’ math grades (d = .62), while Wilkins (2014) found effects for students’ science grades, but not math grades (d = .26 and d = .02, respectively).See Tables 1.5 and 1.7 for a summary of effect sizes from all growth mindset studies.
Discussion
performance. Results indicated that both interventions may produce positive, albeit small, effects that may be highly contingent upon school context.
Reducing Stereotype Threat
Meta-analysis of stereotype threat interventions demonstrated a small overall effect of the intervention on academic performance (d = .19). Although some studies did not replicate the magnitude of findings from the seminal Cohen et al. (2006) values affirmation
intervention, most studies did demonstrate some degree of academic improvement for threatened students: Seven of twelve studies found effects of the intervention on at least one academic outcome.
intervention effects often decay over time (DiClemente, Santelli, & Crosby, 2009), and it is possible that other studies did not publish follow up data due to lack of significant findings.
The fact that not all replications of the intervention produced similar results suggests that individual study characteristics may affect the likelihood of the intervention’s success, a possibility that is supported by the heterogeneity we observed among studies. In terms of intervention implementation, in essentially all replications of the Cohen et al. (2006) study, investigators were careful to implement factors that had been previously identified as central to the intervention mechanism: (a) conducting the reflections just prior to an event where threat of evaluation would be high (i.e., before the end of the grading period or
administration of a standardized test) and (b) messaging the intervention as a normal classroom activity to promote authenticity of the assignment. In only one study (Protzko & Aronson, 2016) were the investigators required to inform students that the activity was for a research study, and in light of null findings, they called to question whether messaging the activity as a research task interfered with students’ internalization of the affirmation. However, in general, investigators were able to replicate the intervention procedures with fidelity, suggesting other contextual factors (e.g., student population) may explain the differences in effects.
(Deaux & Major, 1987; Devine, 1989; McGuire & Padawer-Singer, 1976). For example, in studies that examine gender, stereotype threat and test performance, the reduction in scores for female students is directly proportional to the number of males in the room. Inzlicht and Ben Zeev (2000) found that performance was highest among females who tested with only other females and lowest among those who tested as the only female in a room with all males. Females who tested in a room with both males and females still experienced a reduction in scores, even if female students were in the numerical majority. Replications of the Inzlicht and Ben Zeev (2000) study have shown that the effects in mixed group settings (i.e., males and females) are not mitigated by the promise that scores will not be made public to others, suggesting that the composition of students itself has a strong impact on the level of threat in a given context (Inzlicht & Ben Zeev, 2003). Though these studies have primarily focused on gender effects in math, the same may be true for race or other stereotyped
identities.
findings, showing an interaction between the intervention and school context. When data were re-analyzed, intervention effects were present only for students of threatened identities in high threat schools. Evidence from this follow-up study indicates that the racial makeup of the school may play a role in a school’s threat context and whether the values affirmation task would benefit students of threatened identities.
In addition, as demonstrated by Bowen et al. (2013), who found significant
improvements in a low-income school among white students who received the intervention, there may be aspects of students’ identities beyond race or gender (e.g., socioeconomic status) that are under threat in schools. None of the studies identified in this systemic review and meta-analysis addressed other aspects of identity, such as socioeconomic status, ability status or sexual identity. Yet these identities may be salient to students, and students may use them to make attributions about their academic performance and intelligence. Spencer and Castano (2007) found that presenting an assessment as a diagnostic of natural ability reduced confidence for low-income students and negatively affected their performance on the test. Similarly, Quinn, Kahang, & Cocker (2004) tested whether stigmatized identities that are potentially concealable (unlike gender and race) can still affect performance when activated, showing that, among students who receive mental health services, disclosing treatment before the assessment reduced students’ test performance. Future studies should explore other types of stereotype threat beyond race to examine possible intervention effects.
Several other contextual factors may help explain a lack of findings in certain school contexts. In the Wynne (2011) study, for example, all students were either black or Hispanic. In this school context, threat may be low because each student is surrounded by other
also be low in the Wynne (2011) study because this school has a strong academic record as a high performing charter. Threat is intensified by relative underperformance of a stereotyped group in comparison to a non-stereotyped group – meaning, if students of color have
historically underperformed in comparison to white or Asian students within the school, the effects of stereotype threat may be stronger (Tyson, 2011). A uniformly high performing school that exclusively serves students of color, such as the school in the Wynne (2011) study, may not be an ideal context for stereotype threat intervention. It may be the case that performance gaps between students are quite narrow or that students do not attribute any performance gaps to race, reducing the impact of stereotype threat on their academic achievement. Future replications or moderator analyses in existing studies should further explore the characteristics of a high threat context and how context influences intervention effects.
Promoting Growth Mindset
contained as few at 10 students. The average drop in GPA for these ten students (M = -.35, SD = .84) and null effects among students in the treatment group in the other school (M = .09, SD = .47), paired with unexpected gains in GPA among control group students in both schools (M = .32, SD = .38; M = .34, SD =.59 ), produced the overall negative effect size.
It is important to note that, though the effect size is large in magnitude (d = -.68), it is driven primarily by large gains in the control group rather than substantial iatrogenic effects in the experimental group. Nonetheless, the results of the Brougham study (2016) are
inconsistent with other studies in this sample and raise questions about methodological rigor and study quality. In particular, the author does not provide data from any preliminary testing to check for successful randomization between treatment and control groups to assess
whether they differed by GPA at the outset of the study. It’s possible that in such a small sample, randomization was not sufficient to produce balance across groups. However, the author does provide a personal assessment of group dynamics that indicates that all control groups sessions were rated with a score of 3 (seemingly, the highest score). In comparison, treatment group sessions were rated with 2s and 1s, suggesting that the dynamic among students in the treatment groups was worse than among those students in the control groups. Her qualitative notes indicate that treatment groups were more unruly and required more behavior management and encouragement for participation. In addition, the author noted that one student in the treatment group of ten students who showed a decline in achievement experienced a significant trauma throughout the course of the intervention – her father was killed in between intervention sessions. In the absence of original study data, it is not
one or more outlier students whose achievement may have been affected by factors outside the study context.
In light of the results of sensitivity testing, and in comparison to the consistently neutral or positive findings among other studies, which had larger samples and greater fidelity of implementation, it appears as though the Brougham (2016) study is an outlier. In comparison to other studies in this sample whose data depict a trend of declining GPA among students in the control group and an even sharper decline for high risk students (e.g., Blackwell et al., 2007; Burnette et al., 2017; Paunesku et al., 2015), the significant increase in achievement demonstrated by the control group students in the Brougham (2016) study appears especially unusual and is potentially attributable to group composition or systematic attrition more than to any influence of intervention sessions for either group. However, the possibility that growth mindset intervention could negatively affect students’ achievement should not be ignored and should be considered in future research.
2006). Such variation in findings makes it difficult to assess the critical components of a growth mindset intervention. In the only large-scale study to compare various intervention elements, Yeager and colleagues (2016) found differences in proximal outcomes (e.g.,
challenge-seeking behavior, academic engagement) based on small tweaks in the intervention design, including the addition of a celebrity endorsement (p = .07), scientific evidence (p = .35), greater elaboration on the benefits of a growth mindset (p = .006), increased focus on the direct impact to participating students (p = .03), and more evidence to refute fixed mindset beliefs (p = .002). The Yeager et al. (2016) study did not monitor changes in academic outcomes, and it studied iterations of the intervention that are relatively narrow in scope. However, in light of their findings that small tweaks to growth mindset messaging can have effects on student outcomes, we echo their call for more research that directly examines iterations on growth mindset intervention elements to identify those that most effectively drive differences in student behavior and learning.
As more studies are conducted on the effects of growth mindset interventions, it will be necessary to test for differential impacts among students.
Strengths and Limitations
Though this study provides a comprehensive synthesis of the extant literature on growth mindset and stereotype threat interventions, it is not without limitations. First, a small number of studies have been conducted on these interventions, and they have not all looked at similar outcomes. In addition, there was considerable heterogeneity among studies for both interventions, but with a small number of studies, it was not possible to directly test potential moderators, reducing our ability to draw strong conclusions about the differences among studies and their impact on intervention effects. We addressed the potential for moderating effects by limiting meta-analysis to specific populations and specific outcomes, but it should be noted that this does not eliminate all sources of variation that may influence study effects. Also, because the focus of this review was limited to achievement outcomes, rather than other aspects of students’ school experience (e.g., sense of belonging, stress, motivation, enjoyment of school), our study does not address whether these interventions positively impact students in other aspects of their well-being.
As is the case with much research on academic achievement, it is possible that ceiling effects stunt the measurement of intervention effects for students who appear to be
in school to growth mindset rather than fixed mindset goals for achievement (Yeager et al., 2016). A review of growth mindset studies (see Senko, Hulleman, & Harackiewicz, 2011) showed that growth mindset beliefs are linked with cooperativeness, help-seeking behavior, better self-regulation, more positive affect, and deeper learning strategies, whereas fixed mindset beliefs are associated with increased anxiety, low self-efficacy and disorganized work habits. It is possible that, as a result of intervention, high performing students may perform equally to their prior performance but may be choosing more adaptive behaviors and/or feeling less anxious and more competent. Future research and meta-analyses could summarize effects on outcomes other than academic achievement to assess the full impact of growth mindset intervention.
Nonetheless, this study has several strengths that contribute to the knowledge base around growth mindset and stereotype threat interventions. Great length was taken to reduce bias by conducting a thorough systematic review of the literature and by choosing only studies with rigorous designs and methodologies, where each intervention has been tested in large scale RCTs with thousands of students. To promote accuracy of findings, when
possible, we conducted sensitivity testing around analytic decisions (e.g., choice of effect size, potential for outlier studies) to ensure that results were not biased by methodological choices.
introducing bias in our analysis by not excluding any studies that met pre-established inclusion criteria, but when more intervention studies are available in each area, it could be beneficial to conduct systematic ratings of study quality to determine whether potential outliers like the Brougham (2016) study are clouding conclusions drawn from average effects. In addition, as more research becomes available, future meta-analysis could be also be improved by the use of cumulative analysis, which compiles evidence over time to show the accumulation of evidence for an intervention and how results may have shifted over periods of time (Borenstein et al., 2011).
Conclusion