IS SHOPPING AT CERTAIN TYPES OF STORES ASSOCIATED WITH THE NUTRIENT PROFILE OF PACKAGED FOODS PURCHASED BY US HOUSEHOLDS?
Dalia Stern
A dissertation submitted to the faculty at the University of North Carolina at Chapel Hill in partial fulfillment of the requirements for the degree of Doctor of Philosophy in the
Department of Nutrition in the Gillings School of Global Public Health.
Chapel Hill 2015
Approved by: Barry M. Popkin Penny Gordon-Larsen Shu Wen Ng
ii © 2015 Dalia Stern
iii
ABSTRACT
Dalia Stern: Is shopping at certain types of stores associated with the nutrient profile of packaged foods purchased by US households?
(Under the direction of Barry M. Popkin)
Growing attention is being given to areas with poor access to healthy foods. However, studies looking at the food environment and its association to diet and health do not collect data on where people shop for food, what they actually purchase, or examined the nutrient profile of purchases.
Using packaged food and beverage purchases (PFP) of households participating in the 2000-2012 Homescan longitudinal panel, this work aimed to understand whether types of stores (e.g., grocery, convenience) where US households shop for food are associated with the nutrient profile of PFP and foods/beverages households purchase. In Aim 1, we classified PFP by type of store and described volume trends, nutrient profile of PFP and food/beverage groups households purchased by type of store. The proportion of total volume of household PFP significantly increased from 2000 to 2012 for mass-merchandisers, convenience-stores and warehouse-club. The energy, total sugar, sodium and saturated fat densities of household PFP from
iv
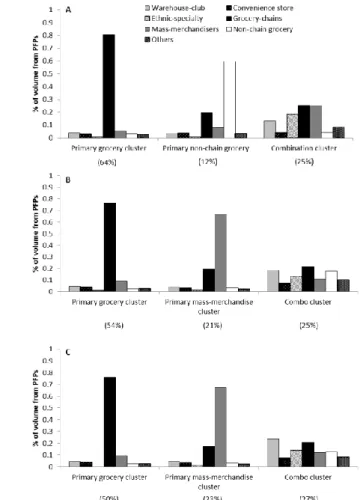
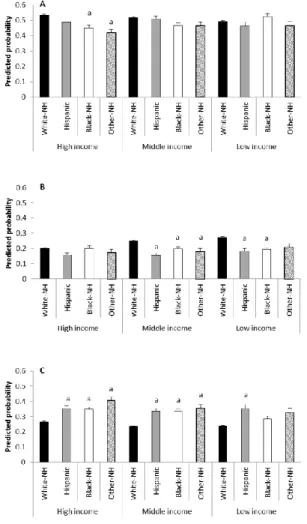
found three shopping patterns: primary-grocery- , primary-mass-merchandise- and combination-cluster. Regardless of income/race-ethnicity, households predominantly shopped at the primary-grocery-cluster. However, among low- and middle-income households, non-whites were less likely to shop at the primary-mass-merchandise-cluster and more likely to shop at the
combination-cluster. In Aim 3, we determined the association between food shopping patterns and PFP and whether this association differs by race-ethnicity from 2007-2012. We found that, no matter which food shopping pattern different race-ethnic groups employed, the nutrient profile and foods/beverages purchased were very similar.
v
ACKNOWLEDGEMENTS
This dissertation work could not have been possible without the great support and inspiration I have received from so many people over the years.
To my advisor Barry Popkin – This work would not have been possible without your encouragement and guidance. Thank you for always keeping me on track and focused, despite my many attempts of doing the opposite! What I truly admire about you is the passion and determination you have towards the work you do. I have learned so much from you! Thank you so much for all your support along this process. It has been an honor having you as my mentor.
vi
guiding me through this process from day one and for spending so much time helping me think through my work. I really am a lucky person for having someone like you as part of my
dissertation committee.
To allcurrent and former members of the UNC Food Research Program – Donna Miles:
without her help this work would have not been possible. Emily, Jessica, Bridget, Julie and Greg: none of the things we do as PhD students would be possible without all your hard work. Thank you so much! I also want to thank Barry’s former and current students: Carolina,
Carmen, Jennifer, Kevin, Lindsey, Lauren, Elyse and Nancy: I could not have asked for a better group of people to work with and I am lucky I can call all of you my friends. I especially want to thank Lindsey and Jennifer. Both of you have been a constant source of encouragement and I will always be thankful for that.
To all theNutrition professors and students who made my time in the doctoral program so memorable, especially Michelle Mendez, Linda Adair, June Stevens and Elizabeth Mayer-Davis.
To all my friends – I seriously am the luckiest person in this planet. Each of you have made my time at UNC unforgettable. I will keep Carolina´s tradition and I will thank my “almost all Spanish speaking friends:” Daniela, Jorge, Laura, Kimon, Wendy, Wayne, Carolina, German, Tania, Juan Carlos, Nancy and Lily. Since day one, you made me feel like home. Thank you for all your support and for all the fun times we spent together. I owe special thanks to my friends Lily and Kimon. Lily: Thank you for always cheering me up and for being such a supportive friend. Kimon: Thank you so much for your unconditional support, for being an amazing running partner and a wonderful friend. Words are not enough to tell you how much I value our
vii
Courtney, Alyssa, Jenny, Melissa, Eva and Jennifer: I love you guys! I owe special thanks to Jenny and Melissa: Thank you for being my running and CrossFit buddies, for listening,
encouraging me and for simply being there for me. You are both an inspiration to me! I could not have asked for a better cohort to go through this process with: Emma, Lindsey, Larissa,
Cassandra, Steph, Samantha, I have learned so much from each one of you! You guys are the best! My time at UNC would have not been the same without you. I feel so lucky to have you as my friends. Samantha: Thank you for being an amazing officemate and a wonderful friend! I am going to miss you! Cassandra: Thank you for your unconditional friendship and for being there for me when I most needed it. Friends like you are not easy to find. Larissa: Thank you for being such an amazing running and boxing partner and such a wonderful friend. Thank you for always bringing joy to my life! Emma: From the first day we started graduate school you have become one of my best friends. Thank you so much for your unconditional friendship, for listening, guiding, and encourage me along this process. You have always been an inspiration for me and you will always occupy a very special place, even if I still don´t understand the difference between a clean and a dirty sweat!
I have been lucky enough to have found a second family in NC. Steph: not only you have been an amazing roommate and a wonderful friend. You also introduced me to an amazing group of friends and you opened the doors of your home to me. I am so thankful for that, words are just not enough. I am certain, that no matter where we go, I will always be able to call you my friend.
Finally I want to thank my sister Nicole, my parents Becky and Jerry and, my grandma
viii
TABLEOFCONTENTS
LIST OF TABLES ...x
LIST OF FIGURES ... xi
LIST OF ABBREVIATIONS ... xii
CHAPTER 1. INTRODUCTION ...1
Background ...1
Research Aims ...3
CHAPTER 2. LITERATURE REVIEW ...5
What are food deserts and do they matter? ...5
Most studies do not collect data on the type of store where people actually shop for food and what foods they purchase ...6
No large-scale, longitudinal study has examined the combination of food stores that US households rely on for their food purchases ...8
It is unclear whether the types of stores where US households shop for food and the nature of food purchases differ by race-ethnicity or SES ...9
Advantages of using Homescan along with nutrition facts panel information ...10
CHAPTER 3. THE NUTRIENT CONTENT OF US HOUSEHOLD FOOD PURCHASES BY STORE TYPES ...12
Overview ...12
Introduction ...13
Methods ...15
Study design and population ...15
Results ...19
ix
Tables and Figures ...27
CHAPTER 4. US HOUSEHOLD FOOD SHOPPING PATTERNS: DYNAMIC SHIFTS IN THE PAST 13 YEARS AND SOCIOECONOMIC PREDICTORS ...42
Overview ...42
Introduction ...42
Subjects and Methods ...44
Results ...48
Discussion ...51
Tables and Figures ...56
CHAPTER 5. FOOD SHOPPING PATTERNS ARE NOT ASSOCIATED WITH THE NUTRIENT QUALITY OF PACKAGED FOOD PURCHASES OR FOODS AND BEVERAGES PURCHASED ...64
Overview ...64
Introduction ...65
Subjects and Methods ...67
Results ...72
Discussion ...74
Tables and Figures ...80
CHAPTER 6. SYNTHESIS ...100
Overview of Findings ...100
Limitations ...106
Strengths ...112
Significance and Public Health Impact ...113
Future Directions ...118
x
LIST OF TABLES
Table 3. 1.Top packaged food and beverage groups purchased by US households
(calories) by store-type, Homescan 2000, 2006 and 2012 ...27 Supplemental Table 3.1. Homescan food grouping system ...31 Supplemental Table 3.2. Univariate sociodemographic and household characteristics
for selected years, Homescan ...34 Supplemental Table 3.3. Sociodemographic and household characteristics by store for
selected years, Homescan ...36 Supplemental Table 3.4. Top packaged food and beverage groups purchased by US
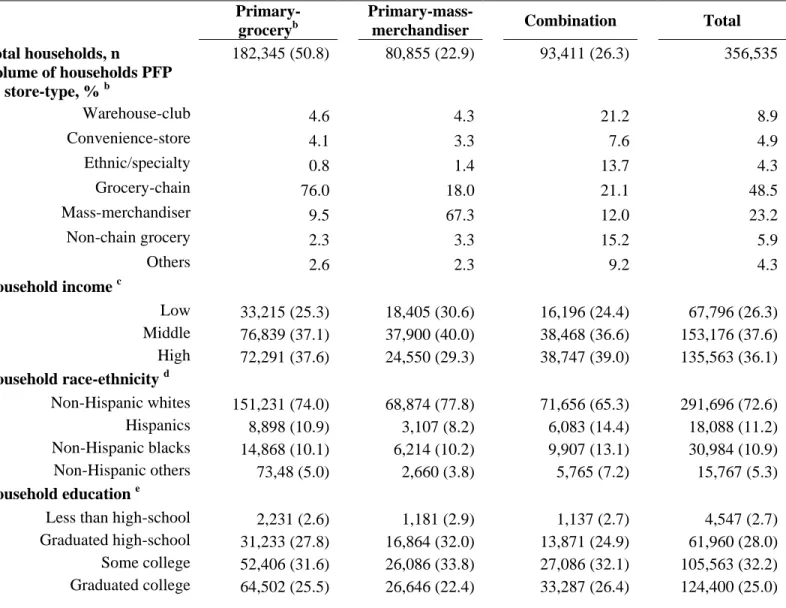
households (volume) by store-type, Homescan 2000, 2006, and 2012 ...39 Table 4.1. Household socio-economic characteristics, sample sizes and volume of
packaged food purchases by store-type for selected years, Homescan ...56 Table 4.2. Univariate households socio-economic characteristics by food shopping
pattern (cluster) for selected years, Homescan ...58 Table 5.1. Mean proportion of volume by store-type by food shopping patterns and
counts and proportions of sociodemographic characteristics by food shopping
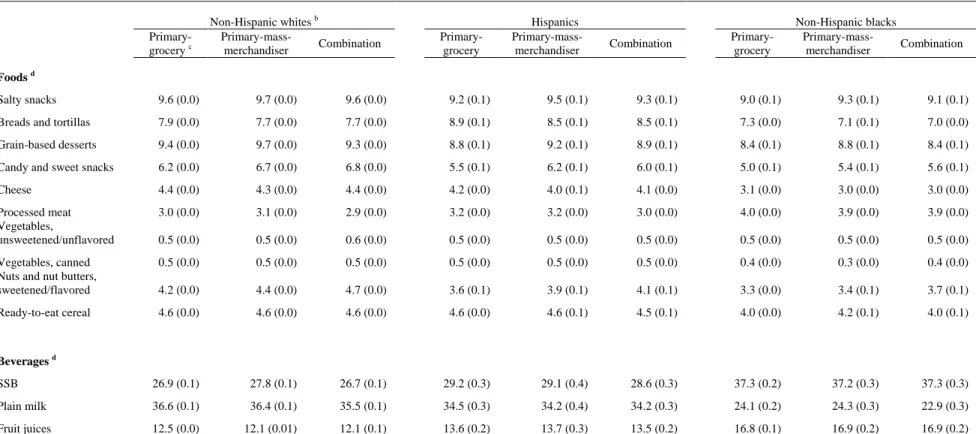
patterns of US households participating in the 2007-2012 Homescan panel ...80 Table 5.2. Mean proportion of calories purchased from key food and beverage groups
by shopping pattern across race-ethnic groups, Homescan 2007-2012 ...82 Supplemental Table 5.1. Food grouping system for Homescan barcode-level data for
PFP ...88 Supplemental Table 5.2. Mean unadjusted densities for PFP and proportion of calorie
purchases from key food and beverage groups by shopping pattern by
race-ethnic group, Homescan 2007-2012 ...96 Supplemental Table 5.3. Mean unadjusted weighted densities for PFP and proportion
of calorie purchases from key food and beverage groups by shopping pattern
xi
LIST OF FIGURES
Figure 3.1. Trends in the proportion of annual volume from household PFP by
store-type, Homescan 2000-2012. ...29 Figure 3.2. Caloric, total sugar, sodium and saturated fat densities from household
PFP by store-type, Homescan 2000, 2006, and 2012. ...30 Supplemental Figure 3. 1. Expenditure on household non-packaged food purchases by
store-type, Homescan 2007 and 2011. ...41 Figure 4.1. Households shopping patterns, Homescan 2000, 2006 and 2012. ...60 Figure 4.2. Predicted probability of shopping pattern (cluster) membership by income
and race-ethnic group, Homescan 2012 ...61 Figure 5.1. Energy and nutrient densities of packaged foods by shopping patterns
across race-ethnic groups, Homescan 2007-2012 ...84 Figure 5.2. Energy and nutrient densities of packaged beverages by shopping patterns
xii
LIST OF ABBREVIATIONS
NFP Nutrition facts panels PFP Packaged food purchases RTE Ready-to-eat
1
CHAPTER1.INTRODUCTION
Background
Improving access to healthy foods has been a cornerstone of the federal administration’s food policy, with hundreds of millions of dollars dedicated to eliminate food deserts, or areas with limited access to healthy foods. Programs and policies at the state and national level have focused on building new supermarkets or grocery stores in food deserts with the goal of improving household food purchases, dietary quality, and reducing health disparities. These strategies are implemented under the underlying assumption that shopping at supermarkets, versus other types of stores (i.e., convenience), is associated with higher nutritional quality of food purchases. However, this assumption has not been supported by empirical evidence.
2
stores, such as convenience, mass-merchandisers and warehouse-club stores; which collectively represent 65% of calories consumed by Americans?
This project will increase our understanding of the answer to this question by looking at the packaged foods sector of the food supply. First we will describe the nutrient quality of packaged food purchases by type of store in a nationally representative sample of US households. We will also describe changes over time from 2000 to 2012. Secondly we will characterize the combination of stores US households rely on for their food purchases and we will determine whether income and race-ethnicity predict shopping pattern membership. Next we will determine shopping pattern associated with the nutrient profile of total packaged foods food purchases, and whether this varies by income and race-ethnicity. Together, this work will inform our central research question on whether shopping at supermarkets is associated with a better nutrient profile of packaged foods purchased foods, compared to other types of stores, and whether targeting food deserts by increasing supermarket availability is the best policy strategy.
3
gender of all household members, income, education and race-ethnicity of the household head, allowing us to conduct subpopulation analysis. Our overall goal with this project is to provide empirical evidence for the assumptions underlying the belief that grocery store purchases are of higher nutrient quality, compared to purchases form other types of store.
Research Aims
Aim 1: Describe at what type of stores US households shop for food and whether type of
store shopping changed over time using a nationally representative sample of US
households. Compare the nutrient profile of households packaged food purchases by type
of store. Determine whether temporal trends of the nutrient profile of households packaged
food purchases differ across type of store from 2000-2012, using descriptive statistics.
Type of store will be defined as: 1) warehouse-club, 2) mass-merchandise/supercenters, 3) grocery stores, 4) non-chain grocery stores 5) specialty stores, 6) ethnic stores, 7) convenience stores, 8) drug stores and 9) dollar stores and 10) other. Volume of purchases by type of store will be defined as the proportion of purchases from a given store, relative to total purchases. Nutrient profile of purchases will be defined as the energy and nutrient densities (g of total sugar, g of saturated fat and mg of sodium) per 100 grams of packaged food/beverage purchases by type of store. We will also compare the percentage of store-type proportion of calories and volume by food and beverage groups.
We hypothesize that the nutrient profile of purchases will be significantly different by
4
Aim 2: Characterize the combination of food stores (i.e., food shopping patterns) where US
households shop for food over 2000-2012 and determine whether income and race-ethnicity
are associated with food shopping patterns in 2012.
2a. Determine shopping patterns using cluster analysis and describe trends over time (2000-2012).
2b. Determine whether there are differences by income and race-ethnicity subpopulations on where US households shop for food in 2012, using multinomial logistic regression.
We hypothesize that U.S. households rely on more than one type of store for their food
purchases, and that low-income, non-Hispanic black and Hispanic households are as likely as
high-income and non-Hispanic white households to shop at larger retail stores (i.e., grocery
chains).
Aim 3: Determine whetherfood shopping patterns are associated with the nutrient profile
of households total packaged foods purchases over 2007-2012 and whether this relationship
differs by income and race-ethnicity, using random-effects models.
Nutrient profile will be defined as caloric and nutrient densities (g of total sugar, g of saturated fat and mg of sodium) per 1000g. As secondary outcomes, we will use the proportion of total calories from packaged foods and proportion of total calories from packaged beverages. Determine if the association differs by income and race-ethnicity subpopulations.
We hypothesize that the nutrient profile of total households packaged foods purchases
will be similar by shopping patterns. However, low-income, non-Hispanic black and Hispanic
households will have a lower nutrient quality profile of their total packaged foods purchases,
5
CHAPTER2.LITERATUREREVIEW
What are food deserts and do they matter?
Food deserts are commonly defined as regions lacking access to healthy foods, like fruits and vegetables, as well as a range of other nutritious foods. 1 The desert component of the term is inherently spatial, and it emphasizes the physical absence of food vendors that sell healthy food options in low-income neighborhoods. 2
Many programs and policies at the state and national level 3-6 focus on the need to build new supermarkets or grocery stores in food deserts in an effort to improve household food purchases, dietary quality, and reduce health disparities. The main concern is that people living in food deserts have limited access to healthy foods and relatively easier access to unhealthy foods, diminishing the nutritional quality of foods purchased, and ultimately, increasing the risk of obesity and nutrition-related chronic diseases. 1 These programs and policies aimed at
ameliorating some of the environmental determinants of diet have been implemented despite the lack of evidence of effectiveness – findings from natural experiments and epidemiological longitudinal studies show that provision of a new supermarket in food deserts 7-11 or proximity to supermarkets may not influence the quality of people’s diet. 12 Moreover, a recent review
6
convenience stores) 14 and because larger stores have more capacity to handle perishables and produce in safe and efficient ways.
To date, it is unclear whether shopping at supermarkets or grocery-stores is associated with a better nutrient profile of the packaged foods purchases, compared to shopping at other types of stores. In addition, these policy strategies were informed by studies that have focused primarily on shopping at one type of store only, 15-18 rather than looking at the combination of stores that people us to shop for food. In fact, evidence from small epidemiological studies indicates food shopping is complicated and appears to involve traveling to multiple store types. 19
Therefore, in order to implement cost effective and impactful food policy, it is critical that we answer the question: are foods that consumers purchase from supermarkets or grocery-stores of higher nutritional quality than food purchases from a range of other types of stores, such as convenience, mass-merchandisers and warehouse-club stores; which collectively represent 65% of calories consumed by Americans?
Most studies do not collect data on the type of store where people actually shop for food
and what foods they purchase
Extensive research conducted in urban settings use geocoding technology 20, 21 to enumerate food stores within a given geographic unit of analysis, such as a zip code area or census tracks. These studies provide measures of food access by characterizing the food environment in different ways. For example, they use density of supermarkets per geographic unit, 22, 23 number of supermarket per geographic unit, 16, 24 or residents´ distance from their home to the location of their principal food store source, as well as the nearest supermarket. 25, 26
7
at the number, type and proximity to retail food stores in a geographically designated area and its association with SES neighborhood characteristics, diet and weight status.
In terms of the food environment and its association with SES neighborhood characteristics, studies have shown that low-income neighborhoods have limited access to supermarkets, compared to wealthier neighborhoods. 15, 23, 27, 28 When looking at race-ethnic disparities in food access, predominantly black, minority or racially mixed neighborhoods have fewer supermarkets compared to predominantly white neighborhoods. 15, 28-31 The association between the food environment and diet is mixed. While some studies support the idea that access to supermarkets is associated with a healthy diet, 16, 26, 32, 33 others have shown that this is not the case. 12, 34, 35 Similarly, studies looking at the food environment and its association to obesity have found mixed results. Some studies report an inverse association between neighborhood supermarket access and body weight, 24, 36-40 while others did not. 41, 42 Studies looking at neighborhood convenience store access and body weight report positive associations, 24, 38, 40, 43 while others report null associations. 36, 44
The above mentioned studies have major conceptual and methodological flaws. First, they assume people shop in food stores close to where they live. Second, overall they do not collect data on where people actually shop for food and they do not collect data on actual food purchases at each store type. Third, they do not address issues regarding where people choose to live. In other words, people may choose to live in neighborhoods that support their dietary preferences. This is known as residential selection. Failing to control for this residential self-selection can create spurious associations between the association of the neighborhood
8
number of stores in the area where households live. Instead, we will use data on where households have already shopped. To date, no large-scale, longitudinal study has been able to examine the nutrient content of packaged foods purchases and foods and beverage choices by type of store among US households, and whether there have been changes over time.
No large-scale, longitudinal study has examined the combination of food stores that US
households rely on for their food purchases
Previous studies investigating the relationship between the food environment and diet usually focus on purchases from one type of store only. However, limited evidence from
epidemiologic studies indicates food shopping is complicated and appears to involve traveling to multiple store types. 19, 45 Moreover, counter to the assumptions from previous research, studies have shown that both, low- and high-SES groups, shop for food beyond their residential food environment. 46, 47 To date, only one study has comprehensively captured movement within a food environment by mapping individuals´ daily activity space and travel patterns in order to capture all the possible stores where people may shop for food. 48 A major limitation is that the existing literature has limited geographical scope and has been conducted on small samples, with limited variability by income and race-ethnicity, and has been limited to examination of
shopping occasions at a single point in time.
9
combination of stores (e.g., food shopping patterns) that US households rely on for their food purchases and whether this has changed over time.
It is unclear whether the types of stores where US households shop for food and the nature
of food purchases differ by race-ethnicity or SES
The literature suggests that residents of non-Hispanic black and low-income neighborhoods have less access to healthy foods, 15, 23, 25, 28 and that living in these
neighborhoods is an important risk factor for unhealthy diets. 50, 51 However, as mentioned previously, these studies do not know whether people shopped at stores located within their residential food environment. Most of these studies also rely on dietary assessment methods to measure dietary intake as a proxy for store purchases, but do not capture food purchases
themselves. These studies make inferences about the types of stores where people shop for food and associations with diet without directly linking foods consumed to the stores where the foods were purchased. 52
10
differences in food and beverage purchases by household race-ethnicity and education. 57, 58 A major limitation of the literature is that studies were completed with small numbers of households, limiting generalizability and their ability to conduct subgroup analyses.
Additionally, studies looking at foods and beverage purchases have focused on specific food or beverage groups, ignoring the entire set of purchases made at the store. 26, 59 In addition, studies have collected data on a single or a limited number of days of purchases,48 failing to capture the usual stores where individuals shop for food, as well as the foods and beverages purchased.
The majority of the studies conducted in this area are based on the assumption that non-Hispanic blacks, non-Hispanics, and low-SES households purchase a large proportion of their food at convenience stores, compared to non-Hispanic whites and high-SES households. Additionally, they also assume that non-Hispanic blacks, Hispanics, and low-SES households have a worse nutrient profile of purchases, compared to non-Hispanic whites and high-SES households. However, to our knowledge, these inquiries regarding subpopulation differences have not been directly investigated in a longitudinal study and with a diverse sample of the US households. Policies and interventions focused on reducing disparities and improving dietary quality are likely to be more effective if we understand households’ food shopping behaviors and food purchasing patterns for subpopulations in the US.
Advantages of using Homescan along with nutrition facts panel information
We will take advantage of the 2000-2012 Nielsen Homescan panel dataset, 60 a nationally representative longitudinal sample of 35,000 to 65,000 households sampled each year. Homescan uses an open cohort study design; households may exit any time, and new households are
11
targets and maintain national representativeness. 61 Nielsen Homescan in unique since it collects information on households PFP (i.e., all foods and beverages with a barcode and nutrition information) from every shopping trip. Although we are only able to examine the packaged foods sector, in 2007, 78% of store-based food expenditures came from packaged foods.62
Homescan participating households are given barcode scanners, and household members are instructed to scan the barcodes on all purchased items upon returning home. A major
advantage of Nielsen Homescan over other population-level studies is that it collects information on the different food retailers or types of stores where households actually shop for food: 1) warehouse-club (e.g., Costco, Sam’s); 2) mass-merchandisers or supercenters, (e.g., Walmart, Super Target); 3) supermarkets/grocery stores (e.g., Kroger, Safeway, Trader Joes, Whole Foods); 4) convenience stores (e.g., Seven Eleven, gas stations); 6) drug stores (e.g., CVS, Walgreens); 8) dollar stores (e.g., Dollar General) and 8) others (e.g., department stores, book stores, etc.). This data allows us to examine the impact of specific retailers or types of store on the food and beverage choices and the nutrient profile of packaged food purchases among US households.
12
CHAPTER3.THENUTRIENTCONTENTOFUSHOUSEHOLDFOODPURCHASES
BYSTORETYPES
Overview
mass-13
merchandisers, warehouse-club and convenience-stores were higher, compared to grocery-stores. In conclusion, PFP from stores with poorer nutrient density (more energy, total sugar, sodium and saturated fat-dense), such as warehouse-club, mass-merchandisers and convenience-stores are growing, representing a potential US public health concern.
Introduction
State and national programs and policies 3-6 focus on building grocery-stores or
supermarkets in food deserts to improve household food purchases, dietary quality, and reduce health disparities. A major concern is that people living in food deserts have limited access to healthy foods and relatively easier access to unhealthy foods, diminishing the nutritional quality of foods purchased, and ultimately, increasing the risk of obesity and nutrition-related chronic diseases. 1 These strategies rely on the assumption that people shopping at larger retail stores, e.g., supermarkets, have a better nutrient profile of food purchases because supermarkets sell more variety of foods with higher nutritional quality at lower prices than other stores (e.g., convenience-stores) and because larger stores have more capacity to handle perishables safely and efficiently. 64 Yet, a clear understanding of the types of stores where people actually shop for food, the foods they purchase and the nutrient profile of their purchases is lacking. Furthermore, we have no literature on how store selection for food shopping changes over time.
14
profile of these purchases. 11, 23, 24, 28 Studies on where people shop for food rely on the presence of stores located within people’s residential food environment 15, 16
or the location of people’s principal food store source.17, 18 These studies make inferences about the types of stores where people shop for food and associations with diet or health without directly linking foods
consumed to the stores where foods were purchased.52 Additionally, these studies fail to capture all the possible stores where people may shop. The few food purchase studies use small samples 55, 57, 58
and have focused on specific food groups, ignoring the entire set of purchases made at the store. 26, 59
To address these gaps, we utilized the Nielsen Homescan dataset, a nationally representative sample of US households. Homescan is unique for studying packaged food purchases (PFP - foods and beverages with a barcode) across stores since households’ record the store source and all packaged foods and beverages purchased from every shopping occasion over one or more years. Improving our food environment includes a key focus on PFP, which
15
Methods
Study design and population
We used PFP (i.e., all foods and beverages with a barcode) data from the US Homescan Consumer Panel dataset from 2000-2012. 60 Participating households receive barcode scanners, and are instructed to scan barcodes on all purchased items and report the outlet’s name upon returning home after every shopping trip. Scanning occurred continuously through the year and included products purchased from all outlet channels. For inclusion in the panel, households needed to report ≥10 months of purchases. Demographic characteristics and household size were collected by questionnaire. Homescan uses direct mailing (targeting low-income and racial-ethnic minority groups) and Internet to recruit households. Homescan uses an open cohort study design. Households may exit any time, and new households are enrolled to replace dropouts based on demographic and geographic targets. 61 Households were sampled from 76 markets, (52 metropolitan and 24 non-metropolitan areas), and were weighted to be nationally representative.
household-16
year observations. The final analytical sample included 652,023 household-year observations. Analyses were conducted in 2014-2015.
Nutrient content of PFP
To determine the nutritional content of household PFP, each uniquely barcoded product captured in Homescan was linked with Nutrition Facts Panel data. Methodology for this process has been described elsewhere. 62, 65 Non-packaged foods were not included (e.g. many produce, meats, breads, prepared foods, etc.) because products without barcodes cannot be scanned. However, produce and meats that are packaged are included (e.g., bag of apples, frozen meats, etc.).
Store categorization
For every shopping occasion made over a year, each household reported the name of the store where they shopped for food. To define store-type, we used Nielsen’s store categorization based on the size, annual sales/revenue and proportion of items in stock. Consequently, some of the industry categorizations, such as the supermarkets/grocery-store sector, represent a
heterogeneous group of stores. Therefore, we used the name of the store and Internet searches to further classify the supermarkets/grocery-store sector into corporate-owned grocery-chains (≥10 stores); non-chain grocery (<10 stores); ethnic-stores; and specialty-stores, using 2012
mass-17
merchandisers-supercenters, hereafter mass-merchandisers (e.g., Walmart, Super-Target); 3) grocery-chains (≥10 units; e.g., Kroger, Safeway); 4) non-chain grocery (<10 units); 5) convenience-drug-dollar, hereafter convenience-stores (e.g., Seven Eleven, CVS, Dollar General); 6) ethnic-specialty; and 7) others (e.g., department stores, book stores). Our analyses focused on the first six store-types because “others” represented a heterogeneous group.
PFP by store-type
To fully capture usual shopping habits, we conducted all analyses at the household-year level. To understand at what store-types US households shop and whether store-type shopping changed over time, we calculated the proportion of volume purchases by store-type. We selected volume because it captures low-caloric and non-caloric foods and beverages possibly missed in the calorie trends.
To understand whether the nutrient profile and types of foods/beverages purchased by US households vary by store-type, we calculated four measures: (1) caloric and nutrient densities (g of total sugar, g of saturated fat and mg of sodium) per 100 g of household PFP by store-type; (2) grams of PFP per-household per-day by store-type; (3) percentage of store-type proportion of calories and volume by food and beverage group (Supplemental Table 3.1); and (4)
18
Statistical analyses
All analyses were conducted using Stata 13 (StataCorp LP) using survey commands to generate nationally representative estimates, incorporating Nielsen annual household sampling weights while accounting for repeated observations and market-level clustering.66
We calculated the contribution of each store-type as a percentage of total volume purchased. We regressed percent volume on indicator variables for type, year and store-type year interactions. We used margins– command in Stata to predict weighted unadjusted mean percentage volume from each store-type across all households from 2000 to 2012. We used regression models to test linear trends. Pairwise comparisons were used to test differences between stores at a given year, using grocery-chains as the referent group. A two-sided p<0.001 denotes statistical significance, accommodating multiple comparisons and the large sample size.
To explore nutrient profile differences by store-type, we calculated weighted unadjusted mean caloric and nutrient densities of household PFP in 2000, 2006, and 2012. Analyses were performed separately for each store-type. Only households with PFP from a given store-type were included in the analysis, therefore we cannot perform statistical testing. Densities reflect what households are actually purchasing at each type and are driven by what each store-type offers and what customers decide to buy.
19
separately for each store-type. Only households that purchased foods/beverages from a given store-type were included in the analysis, therefore we cannot perform statistical tests.
Sensitivity analysis
The nutrient profile of household purchases by store-type may vary due to purchases from products without barcodes or Nutrition Facts Panel information, especially if households purchase different amounts of such products from different store-types. While we do not have nutrient data, we have information on household expenditures on non-packaged foods for a Homescan subsample from 2007-2011. Sensitivity analyses were conducted to determine whether the proportion of non-packaged foods and non-packaged food groups varied by store-type or time. We estimated: (1) mean proportion of household expenditures on non-packaged vs. packaged foods by store-type among the total sample and; (2) mean proportion of household expenditures by non-packaged food groups by store-type among non-packaged food consumers. Analyses were performed separately for each store-type.
Results
Sociodemographic and household characteristics for selected years are shown in
Supplemental Table 3.2, and sample characteristics by store-type are shown in Supplemental
Table 3.3. Homescan had a higher proportion of white-non Hispanics, households with some
20
survey year. The proportion of Hispanics, black-non Hispanics, and households with college and post college graduates increased over time.
Figure 3.1 shows trends in annual volume (%) from household PFP by store-type from
2000-2012. Volume from grocery-chains and non-chain grocery’s significantly decreased over time, while volume from warehouse-club, mass-merchandisers and convenience-stores
significantly increased over time. Regardless of year, grocery-chains represented the biggest contributor to total volume from household PFP. Trends in calories (%) were similar to trends in volume.
Figure 3.2 shows the caloric and nutrient profile of household PFP and the absolute
number of mean grams per-household per-day from PFP by store-type in 2000, 2006, and 2012. The caloric, total sugar and saturated fat densities of household PFP from mass-merchandisers, warehouse-club and convenience-stores decreased over time, but remained higher than the other store-types in 2012. The caloric, total sugar and saturated fat densities of household PFP from grocery-chains, non-grocery chains and ethnic-specialty stores remained stable over time. The sodium density of household PFP from all store-types, besides non-grocery chains, decreased from 2000 to 2006, but rose again in 2012. Household PFP from non-grocery chains, warehouse-club stores, and convenience-stores had the highest sodium density in 2012. Grocery-chains consistently had the lowest caloric and better nutrient densities.
Table 3.1 shows the list of food and beverage groups household purchased and are
21
biggest differences are not in the top sources of calories, but rather the proportion of total calories purchases by store-type. Top common sources of calories (%) from household PFP by food group across store-types in all years include: savory snacks and grain-based desserts. One major difference is convenience-stores – more than 35% of calories purchased there come from candy and gum in all years. For the top common sources of beverage calories (%), households purchased about a third of beverage calories from regular soft drinks and from fruit drinks/juices at convenience-stores and mass-merchandisers, respectively in all years. Overall, all other store-types had fresh milk as the dominant beverage. Volume estimates are available in Supplemental
Table 3.4.
Sensitivity analysis
For a given store-type, the mean proportion of dollars spent by households on non-packaged foods/food groups did not vary over time. However, we observed differences in mean proportion of dollars spent on non-packaged foods across store-types. For example, in 2011, household expenditures on packaged foods was higher in ethnic-specialty (36.5%) and non-grocery chains (38.9%), compared to convenience-stores (5.3%) and mass-merchandisers (9.1%)
(Supplemental Figure 3.1).
Discussion
22
and convenience-stores rose over time. However, grocery-chains still account for the majority of household PFP. Our results agree with a marketing report showing that shoppers are increasingly shopping at mass-merchandisers and warehouse-clubs. 49 In addition to increasing shopping at non-grocery stores, purchases at these store-types are of lower nutritional quality. While energy-dense diets have been associated with obesity, elevated insulin levels and metabolic syndrome in US adults, 68, 69 the results here are on purchases, not diets. Relating household PFP to individual intake is challenging considering consumer-level food waste associated with households PFP. 70 Further, no US recommendations for the nutrient content of purchases exist. Future studies should determine whether differences in nutrient densities by store-type translate to higher total energy intake, poor dietary quality, or weight gain at the individual level.
Literature on the relationship between food environment and its association to diet has paid insufficient attention to the types of stores where people shop for food, what they actually purchase and the nutrient profile of those purchases. 71 Our study demonstrates that food and beverage groups such as savory snacks, grain-based desserts, fruit drinks/juices, fresh plain milk, and regular soft-drinks were the top sources of calorie purchases by US households across all types of stores, regardless of time.Our results are consistent with studies of food group intake by US children and adults, where energy-dense and nutrient-poor foodssuch as SSB, salty snacks and grain-based desserts were major contributors to dietary energy intake. 72-74 These
23
small and large stores, stock large quantities of low-nutrient foods that might contribute to weight gain and affect health. Much of the literature focuses on the relationship between store-type availability with diet and health. However, it may not only be store-store-type availability that matters, but the fact that unhealthy foods/beverages are ubiquitous and households are
purchasing them everywhere. Additionally, more should be done to encourage non-grocery retailers to stock and promote purchases of healthier products at better prices relative to less-healthy foods. 75
Important strengths of this study are that we know the types of store where households shopped, what foods and beverages they actually purchased and we have linked nutrient data to those purchases. Moreover, we were able to study PFP trends over a period of 13 years.
Additionally, to avoid bias from dietary self-reported assessment methods, purchase data were collected by objective scanning of barcodes for PFP. Lastly, we collected data for PFP during the course of an entire year, reflecting households’ usual purchases.
Limitations
24
Additionally, we are unable to verify whether all household PFP from all store-types and trips were scanned. Systematic underreporting is possible if households are less likely to scan purchases that occurred “on-the-go” and never made it home, especially from convenience-stores. Our results could underestimate the nutrient profile of purchases from convenience-stores; however, we found that purchases from convenience-stores already have one of the “worst” nutrient profiles. Another limitation is our lack of non-packaged food purchase detailed data, as extensive public health efforts are placed on increasing produce purchases. While unpackaged produce are excluded, purchases from food categories such as frozen, canned and barcoded produce are included, as are most whole grains and legumes. Sensitivity analysis of expenditure of non-packaged foods showed that dollars spent on non-packaged foods/non-packaged foods categories remained stable over time at each store-type. Conversely, we observed differences in non-packaged food expenditures between store-types. This may reflect availability of these types of food at the different store-types as well as individual preferences. Differences in
non-packaged foods between store-types may influence the nutrient profile of total purchases,
25
non-packaged foods means we are unable to describe overall nutrient profile of total food purchases.
Although sampling weights were used, studies have questioned whether household characteristics of Homescan match the sociodemographic characteristics of the US population. 81 However, validation studies found that the accuracy of the Homescan data at measuring
purchases at the national level was comparable to other widely used economic datasets. 82 Moreover, elsewhere we showed that trends in Homescan purchase data mirror trends in NHANES food intake from stores. 83
Conclusions
We found that grocery-chains account for the majority of household PFP. However, growing volume trends of household PFP from store-types with poorer nutrient density (more energy, total sugar, sodium and saturated fat-dense), such as warehouse-club,
26
unhealthier food/beverage products at selected store-types. Future research is needed to account for selection of store-types where households shopand how different race-ethnic and
27
Tables and Figures
Table 3. 1.Top packaged food and beverage groups purchased by US households (calories) by store-type, Homescan 2000, 2006
and 2012 a
<---2000---> Grocery chains (n=33,233) Non-chain grocery (n=19,415) Ethnic-specialty (n=7,740) Mass merchandisers (n=30,414) Convenience stores (n=28,604) Warehouse clubs (n=17,014)
Group %
kcal
mean
(SE) Group
% kcal
mean
(SE) Group
% kcal
mean
(SE) Group
% kcal
mean
(SE) Group
% kcal
mean
(SE) Group
% kcal mean (SE) Top pa cka g ed foo ds 1 Savory
snacks 8.7
147.5 (1.1)
Ready-to-eat
breads 9.0
44.9 (0.8)
Savory
snacks 10.3
54.9 (1.8)
Candy and
gum 25.9
117.1 (1.1)
Candy and
gum 42.4
36.6
(0.3) Savory snacks 12.9 65.5 (1.1)
2 Fats and oils 8.7
147.5 (1.2)
Savory
snacks 8.9
44.3 (0.8)
Grain based
desserts 8.0
42.5
(1.5) Savory snacks 16.2 73.1 (0.8)
Savory
snacks 12.9
11.2 (0.2)
Candy and
gum 10.6
53.9 (1.2)
3
Grain based
desserts 7.8
131.7 (1.2)
Grain based
desserts 7.9
39.4 (0.7)
Ready-to-eat
breads 7.6
40.6 (1.5)
Grain based
desserts 13.2 59.7 (0.7)
Grain based desserts 10.4
9.0 (0.2)
Grain based
desserts 8.9
45.4 (1.0)
4
Ready-to-eat
breads 7.3
123.4
(0.9) Fats and oils 7.6 37.8
(0.7) Fats and oils 6.9 37.0 (1.2)
Ready-to-eat breakfast 6.2
27.9 (0.5)
Nuts and
seeds 5.1
4.4
(0.1) Fats and oils 7.1 36.3 (1.0)
5
Ready-to-eat breakfast 6.4
108.3 (1.0)
Ready-to-eat breakfast 4.9
24.4 (0.6)
Ready-to-eat breakfast 6.5
34.8 (1.3)
Ready-to-eat
breads 4.3
19.5 (0.4)
Ready-to-eat
breads 3.9
3.3
(0.1) Nuts and seeds 5.1 25.7 (0.8) All other
foods 61.1
1035.9 (1.9)
All other
foods 61.7
307.7 (1.4)
All other
foods 60.6
322.7
(2.7) All other foods 34.2 154.3
(1.2) All other
foods 25.3
21.8 (0.2)
All other
foods 55.4
282.0 (1.8)
Total 100.0
1694.4
(11.7) Total 100.0
498.4
(9.4) Total 100.0
532.4
(14.7) Total 100.0
451.6
(7.5) Total 100.0
86.4
(1.6) Total 100.0
508.7 (9.8) Top pa cka g ed be ve ra ge s 1 Fresh plain
milk 34.2
112.3 (0.7)
Fresh plain
milk 38.3
43.7 (0.5)
Fresh plain
milk 31.9
40.7 (0.8)
Soft drinks,
regular 30.4
27.6 (0.3)
Soft drinks,
regular 29.6
12.5 (0.2)
Fruit drinks and juice 41.4
40.0 (0.5)
2
Fruit drinks
and juice 27.0
88.6 (0.6)
Fruit drinks
and juice 24.7 28.2 (0.4)
Fruit drinks
and juice 24.8 31.7 (0.7)
Fruit drinks
and juice 29.4 26.7 (0.3)
Fresh plain
milk 26.6
11.2 (0.2)
Fresh plain
milk 19.8
19.1 (0.4)
3
Soft drinks,
regular 22.1
72.5 (0.7)
Soft drinks,
regular 20.7
23.7 (0.4)
Soft drinks,
regular 16.4
20.9 (0.7)
Fresh plain
milk 22.4
20.3 (0.3)
Fruit drinks
and juice 19.2 8.1
(0.1) Alcohol 13.3 12.9 (0.4)
4 Alcohol 6.4
21.2
(0.4) Alcohol 6.5 7.4
(0.3) Alcohol 13.5 17.3
(0.8) Alcohol 4.2
3.8
(0.1) Alcohol 12.7 5.4 (0.1)
Soft drinks,
regular 7.0
6.8 (0.3)
5 Tea 2.3
7.5
(0.2) Dairy drinks 2.3 2.6
(0.1) Dairy drinks 3.0
3.8
(0.3) Coffee 3.1
2.8 (0.1)
Soft drinks,
diet 3.5
1.5
(0.1) Concentrates 5.1 4.9 (0.2) All other
beverages 8.0
26.1 (0.3)
All other
beverages 7.6 8.6 (0.2)
All other
beverages 10.4 13.3 (0.5)
All other
beverages 10.7 9.7 (0.2)
All other
beverages 8.3 3.5 (0.1)
All other
beverages 13.4 12.9 (0.4.)
Total 100.0
328.2
(2.9) Total 100.0 114.1
(2.5) Total 100.0
127.7
(3.8) Total 100.0
90.8
(2.0) Total 100.0
42.1
(1.0) Total 100.0
96.7 (2.5) <---2006--->
Grocery chains (n=57,712) Non-chain grocery (n=29,477) Ethnic-specialty (n=13,385) Mass merchandisers (n=54,476) Convenience stores (n=50,462) Warehouse clubs (n=29,956)
Group %
kcal
mean
(s.e.) Food group % kcal
mean
(s.e.) Group % kcal
mean
(s.e.) Group % kcal
mean
(s.e.) Group % kcal
mean
(s.e.) Group % kcal mean (s.e.) Top pa cka g ed foo ds 1 Savory
snacks 8.9
125.6 (0.7)
Savory
snacks 9.1
33.0
(0.5) Savory snacks 9.9 44.3 (1.1)
Candy and
gum 16.5
124.1 (1.3)
Candy and
gum 39.2
47.9
(0.3) Savory snacks 11.4 59.6 (0.8)
2 Fats and
oils 7.7
108.6 (0.7)
Ready-to-eat
breads 7.9
28.9 (0.5)
Ready-to-eat
breads 7.2
32.1
(0.9) Savory snacks 13.0 97.4 (0.8)
Savory
snacks 13.2
16.2 (0.2)
Candy and
gum 8.5
44.1 (0.9)
3
Grain based
desserts 7.3
103.7 (0.7)
Grain based
desserts 7.6
27.5 (0.5)
Ready-to-eat breakfast 7.1
31.8 (1.0)
Grain based
desserts 9.9
74.3 (0.7)
Grain based
desserts 11.0 13.5 (0.2)
Grain based
desserts 8.0
41.9 (0.7)
4
Ready-to-eat
breads 7.0
98.9 (0.6)
Fats and
oils 6.8
24.7 (0.4)
Fats and
oils 6.8
30.4 (0.8)
Ready-to-eat breakfast 7.3
54.9 (0.6)
Nuts and
seeds 5.8
7.1
(0.1) Fats & oils 6.4 33.4 (0.7)
5
Ready-to-eat breakfast 6.3
89.3 (0.7)
Processed
meat 5.2
18.9 (0.4)
Grain based
desserts 6.8
30.3 (0.9)
Fats and
oils 5.1
38.1 (0.5)
Ready-to-eat breakfast 4.0
4.9
(0.1) Nuts and seeds 5.8 30.2 (0.6) All other
foods 62.8
888.6 (1.2)
All other
foods 63.5
231.1 (0.9)
All other
foods 62.6
278.1
(1.7) All other foods 48.3 362.9
(1.3) All other
foods 26.8
32.8 (0.3)
All other
foods 59.9
312.4 (1.4)
Total 100.0
1414.8
(8.5) Total 100.0
364.2
(6.2) Total 100.0
447.1
(11.4) Total 100.0
751.7
(7.1) Total 100.0
122.3
(1.7) Total 100.0
521.4 (7.1)
Top packa ge
d be ve r age s 1 Fresh plain
milk 35.3
90.7 (0.4)
Fresh plain
milk 36.7
31.8 (0.3)
Fresh plain
milk 26.3
26.6 (0.5)
Fresh plain
milk 28.0
36.8 (0.3)
Soft drinks,
regular 31.2
15.4 (0.2)
Fruit drinks and juice 35.9
28
2
Fruit drinks
and juice 25.1
64.5 (0.4)
Fruit drinks
and juice 24.2 21.0 (0.3)
Fruit drinks
and juice 23.3 23.5 (0.5)
Fruit drinks
and juice 27.9 36.6 (0.3)
Fresh plain
milk 28.1
13.8 (0.2)
Fresh plain
milk 24.7
25.5 (0.4)
3
Soft drinks,
regular 21.4
55.1 (0.4)
Soft drinks,
regular 19.4
16.8
(0.3) Alcohol 19.2 19.4 (0.5)
Soft drinks,
regular 24.7
32.5 (0.3)
Fruit drinks
and juice 18.5 9.1
(0.1) Alcohol 13.9 14.2 (0.3)
4 Alcohol 7.5
19.3
(0.3) Alcohol 8.7
7.5 (0.2)
Soft drinks,
regular 15.9
16.0
(0.4) Alcohol 5.4
7.2
(0.2) Alcohol 10.2 5.0 (0.1)
Soft drinks,
regular 8.4
8.6 (0.3)
5 Dairy drinks 3.7
9.6 (0.2)
Dairy
drinks 3.5
3.1
(0.1) Dairy drinks 4.1 4.1
(0.2) Concentrates 3.1 4.0
(0.1) Tea 3.6
1.8
(0.1) Concentrates 3.9 4.0 (0.2) All other
beverages 7.0
18.0 (0.2)
All other
beverages 7.4 6.4 (0.2)
All other
beverages 11.1 11.2 (0.4)
All other
beverages 10.9 14.3 (0.2)
All other
beverages 8.4 4.2 (0.1)
All other
beverages 13.2 13.5 (0.3)
Total 100.0
257.3
(2.0) Total 100.0
86.5
(1.8) Total 100.0
100.8
(2.9) Total 100.0 131.5
(1.5) Total 100.0
49.2
(1.0) Total 100.0
102.1 (2.) <---2012--->
Grocery chains (n=55,880) Non-chain grocery (n=26,417) Ethnic-specialty (n=15,449) Mass merchandisers (n=53,482) Convenience stores (n=47,703) Warehouse clubs (n=30,257)
Group %
kcal
mean
(s.e.) Group % kcal
mean
(s.e.) Group % kcal
mean
(s.e.) Group % kcal
mean
(s.e.) Group % kcal
mean
(s.e.) Group % kcal mean (s.e.) Top pa cka g ed foo ds 1 Savory
snacks 9.3
117.7 (0.8)
Savory
snacks 9.4
28.4 (0.5)
Savory
snacks 9.1
37.7 (0.9)
Candy and
gum 12.0
85.1 (0.9)
Candy and
gum 35.7
45.4 (0.3)
Savory
snacks 10.2
57.4 (0.8)
2 Fats and
oils 7.7
97.0 (0.7)
Ready-to-eat
breads 7.7
23.2 (0.4)
Fats and
oils 6.1
25.2 (0.7)
Savory
snacks 10.7
75.6 (0.6)
Savory
snacks 13.9
17.7 (0.2)
Grain based
desserts 7.4
41.6 (0.7)
3
Grain based
desserts 6.9
87.0 (0.6)
Grain based
desserts 6.8
20.6 (0.4)
Grain based
desserts 6.0
24.9 (0.7)
Grain based
desserts 8.1
57.5 (0.5)
Grain based desserts 10.1
12.8 (0.2)
Fats and
oils 6.8
38.3 (0.8)
4
Ready-to-eat
breads 6.5
82.4 (0.5)
Fats and
oils 6.7
20.1 (0.4)
Ready-to-eat
breads 5.9
24.6 (0.7)
Ready-to-eat breakfast 6.9
49.2 (0.5)
Nuts &
seeds 5.1
6.5 (0.1)
Candy &
gum 6.3
35.5 (0.7)
5
Ready-to-eat breakfast 6.0
75.6 (0.6)
Pasta &
rice 5.1
15.5 (0.4)
Processed
meat 5.8
24.0 (0.8)
Fats and
oils 5.7
40.1 (0.5)
Ready-to-eat breakfast 5.0
6.4 (0.1)
Ready-to-eat breakfast 6.1
34.2 (0.7) All other
foods 63.6
802.6 (1.2)
All other
foods 64.4
194.6 (0.8)
All other
foods 67.2
280.0 (1.5)
All other
foods 56.6
400.6 (1.1)
All other
foods 30.2
38.4 (0.3)
All other
foods 63.2
355.9 (1.3)
Total 100.0
1262.4
(8.0) Total 100.0
302.4
(5.8) Total 100.0
416.4
(10.3) Total 100.0
708.1
(6.9) Total 100.0
127.2
(1.7) Total 100.0
562.9 (7.5) Top pa cka g ed be ve ra ge s 1 Fresh plain
Milk 35.7
72.1 (0.4)
Fresh plain
milk 33.6
21.0 (0.3)
Fresh plain
milk 24.9
20.7 (0.4)
Fresh plain
milk 28.8
32.1 (0.2)
Soft drinks,
regular 31.7
14.4 (0.2)
Fruit drinks and juice 31.1
29.8 (0.4)
2
Fruit drinks and juice 23.0
46.5 (0.3)
Fruit drinks and juice 24.4
15.2 (0.2)
Fruit drinks
and juice 23.4 19.5 (0.4)
Fruit drinks and juice 25.9
28.9 (0.2)
Fresh plain
milk 23.5
10.7 (0.1)
Fresh plain
milk 26.6
25.5 (0.4)
3
Soft drinks,
regular 19.1
38.7 (0.3)
Soft drinks,
regular 19.1
11.9
(0.2) Alcohol 20.0 16.6 (0.4)
Soft drinks,
regular 20.6
23.0 (0.2)
Fruit drinks and juice 17.6
8.0
(0.1) Alcohol 14.3 13.7 (0.3)
4 Alcohol 8.5
17.1
(0.3) Alcohol 9.4
5.9 (0.2)
Soft drinks,
regular 14.6
12.2
(0.3) Alcohol 8.0
8.9
(0.2) Alcohol 10.2 4.6 (0.1)
Soft drinks,
regular 9.7
9.3 (0.3)
5 Dairy
drinks 4.6
9.3 (0.2)
Dairy
drinks 4.1
2.5 (0.1)
Dairy
drinks 5.4
4.5
(0.2) Concentrates 4.2 4.7
(0.1) Tea 5.6
2.5
(0.1) Tea 4.3
4.1 (0.2) All other
beverages 9.2
18.5 (0.2)
All other
beverages 9.5 5.9 (0.2)
All other
beverages 11.7 9.7 (0.3)
All other
beverages 12.5 13.9 (0.2)
All other
beverages 11.3 5.2 (0.1)
All other
beverages 14.0 13.4 (0.3)
Total 100.0
202.2
(1.7) Total 100.0
62.4
(1.9) Total 100.0
83.1
(2.3) Total 100.0
111.4
(1.3) Total 100.0
45.4
(0.8) Total 100.0
95.8 (1.8)
a Percentages and means have been weighted to be nationally representative. Data comes from the 2012 Nielsen Homescan panel of household packaged food purchases. An observation represents all purchases made by a single household over a period of ≥10-12
months. The number of year-household observations by store type are not mutually exclusive as some households might have purchased foods at different store types. Our statistical testing focused on the trends analysis. For these analyses, only households with PFPs from a given store type were included; therefore, statistical testing could not be performed.
29
Figure 3.1. Trends in the proportion of annual volume from household PFP by store-type, Homescan 2000-2012.
Values represent unadjusted means using survey weighted linear regression models. * Denotes significant linear trends in the contribution of a given store-type to
purchases (% volume). For all years, comparisons were made between stores, using grocery-chains as the referent group. All comparisons between stores were
significantly different at a p<0.001 to account for multiple comparisons and sample size. Data comes from the 2000-2012 Nielsen Homescan panel of household
packaged food purchases. All values are weighted to be nationally representative. Percentages labeled within the graph represent estimates in 2000, 2006, and
30
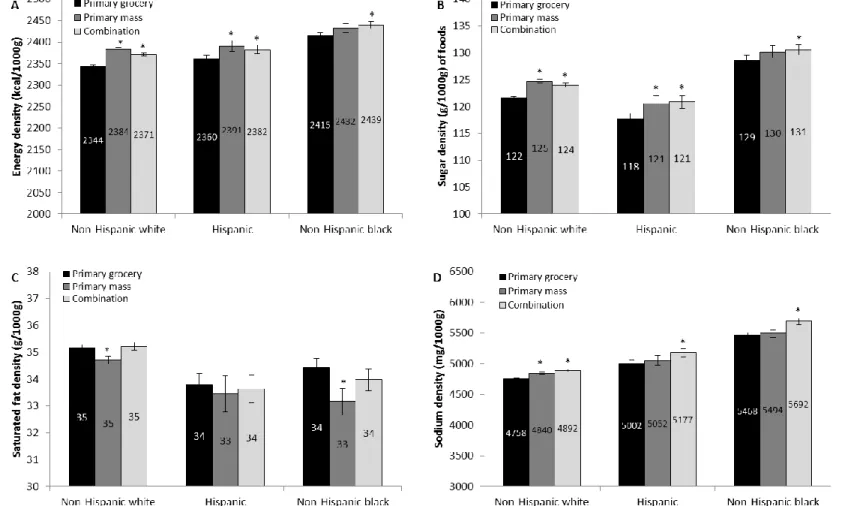
Figure 3.2. Caloric, total sugar, sodium and saturated fat densities from household PFP by store-type, Homescan 2000, 2006,
and 2012.
(A) Caloric density (kcal/100g); (B) sugar density (g/100g); (C) sodium density (mg/100g); (D) saturated fat density (g/100g). Values represent weighted
unadjusted means. Values above bars in panel (A) indicate the mean absolute number of grams households purchased per-day by store-type for 2000, 2006 and
2012 (top, middle, and bottom, respectively). Analyses were performed separately for each store-type. Our statistical testing focused on the trends analysis. For
these analyses, we could not statistically compare across store-types due to differences in samples for each store-type. Data comes from the 2000, 2006 and
31
Supplemental Table 3.1.Homescan food grouping system
Food/beverage group Description
1 Cheese Includes all cheeses.
2 Yogurt Includes refrigerated yogurt, yogurt shakes and drinks.
3 Frozen/refrigerated dairy-based toppings/condiments Includes all sour cream, whipping cream, frozen cream substitutes.
4 Shelf-stable creamers, evaporated or condensed milks Includes all creamers, canned milk.
5 Beef/pork Includes all fresh frozen and canned pork.
6 Poultry Includes all fresh frozen and canned poultry.
7 Seafood Includes all refrigerated, frozen, and canned seafood.
8 Processed Meat Includes all refrigerated and canned processed meats.
9 Eggs Includes all fresh eggs.
10 Nuts and seeds Includes all nuts and seeds
11 Cereals, requires cooking Includes all cereals that require cooking such as hot cereal, grits, barley, wheat germ, etc.
12 Ready-to-eat breakfast Includes all ready-to-eat cereals, breakfast cakes, bars and sweet rolls, frozen and
refrigerated breakfasts, etc.
13 Pasta & Rice Includes all boxed, dried, fresh and frozen pasta and rice and well as boxed pasta and rice
dinners.
14 Shelf-stable Mexican-style products Includes all Mexican-style products (Mexican dinners, shells, tortillas, Mexican specialties,
etc.)
15 Dry baking mix Includes all dry baking mixes such as pancake, bread, hushpuppy, rolls and biscuits, pie and
crust mixes, etc.
16 Flours Includes all flours and corn meal.
17 Baking supplies Includes products such as baking powder, baking soda, starch, food coloring, cocoa, fruit
pectin, yeast, etc.
18 Baking supplies, sweet Includes products such as baking chips, baking chocolate, frosting ready to spread, fruit
glazed, etc.
19 Desserts, prepare-at-home Includes all cake, brownie and muffin mixes, frosting, etc.
20 Dairy-based dessert Includes ice-cream, ice pops, frozen desserts, canned desserts, etc.
21 Ready-to-eat breads Includes all fresh and frozen ready-to-eat brands such as beagles, biscuits, breads, buns, etc.
22 Grain-based desserts Includes all fresh, refrigerated and frozen and boxed cakes, doughnuts, cookies, and bars.
23 Refrigerated/frozen dough products Includes all refrigerated and frozen dough such as bread, biscuits, dinner rolls, pizza crust,
32
24 Pizza Includes all refrigerated and frozen pizza.
25 Fruit, fresh & frozen Includes all fresh and frozen fruit.
26 Fruit, canned and dried Includes all canned and dried fruit.
27 Other fruit Includes dried fruit and products such as maraschino cherries, pie and pastry filling.
28 Vegetables, canned or dried Includes all canned and dried vegetables.
29 Vegetables, fresh or frozen Includes all fresh and frozen vegetables.
30 Potatoes and corn Includes all refrigerated, frozen and canned potatoes and corn
31 Beans and legumes Includes all dried and canned beans and legumes.
32 Fats and oils Includes all fats and oils such as butter, margarine and spreads, cooking sprays, lard,
cooking oil, shortening, etc.
33 Salad dressing Includes all salad dressings.
34 Condiments & sauces Includes all condiments and sauces such as barbecue, catsup, mustard, mayonnaise, pizza
sauce, tomato sauce, seasoning mix, etc.
35 Spreads and dips Includes all mixes, canned, refrigerated and frozen dips and spreads.
36 Savory Snacks Includes all savory snacks such as crackers, popcorn, chips, pretzels, etc.
37 Sweets, miscellaneous Includes products such as gelatin, syrups, toppings, etc.,
38 Sweeteners Includes all types of sugar, molasses and syrups.
39 Nut and fruit spreads Includes peanut butter, fruit spreads, jams, marmalade, preservatives, etc.
40 Candy and gum Includes all candy and gum.
41 Baby food Includes all baby food.
42 Spices, seasoning, & extracts Includes salt and all spices and seasoning.
43 Frozen entrees Includes all types of frozen entrees.
44 Ready-to-eat prepared dishes Includes all ready-to-eat prepared dishes.
45 Canned mixed dishes Includes all canned and shelf stable mixed dishes.
46 Shelf-stable soups and stews Includes all shelf stable soups and stews.
47 Fresh plain milk Includes all fresh plain milk.
48 Refrigerated sweetened dairy drinks Includes refrigerated products such as favored milk, shakes, eggnog, etc.
49 Shelf-stable milks, milk substitutes and milk-based powders Includes all shelf stables milks, milk powders and non-refrigerated shakes.
50 Fruit and vegetable drinks and juice Includes all shelf-stable and frozen fruit and vegetable juices as well as fruit drinks.
51 Beverage powder and concentrates Includes all beverage powder and concentrates.
52 Soft drinks, regular Includes all carbonated soft drinks with >20 calories per 100g.
33
54 Tea Includes all bags, loose and ready-to-drink teas.
55 Coffee (grounds, beans, ready-to-drink) Includes all bags, loose and ready-to-drink coffee.
56 Water Includes all bottled water.
34
Supplemental Table 3.2. Univariate sociodemographic and household characteristics for selected years, Homescan a
2000 2006 2012
n % n % n %
Total households 33,795 59,890 58, 707
Race-ethnicity b
Non-Hispanic white 28,491 79.0 49,387 74.3 47,376 71.3
Hispanic 1,799 8.7 3,165 10.3 3,031 12.0
Non-Hispanic black 2,706 10.8 4,978 10.9 5,427 11.2
Non-Hispanic other 799 1.4 2,360 4.5 2,873 5.6
Education c
Less than high school 750 3.6 915 3.0 719 2.7
Graduated high school 6,975 27.8 11,043 29.4 9,562 27.2 Some college 10,554 35.4 18,851 32.6 17,107 32.5 College graduate 10,247 22.9 19,733 23.6 21,086 25.5 Post college graduate 5,269 10.3 9,348 11.5 10,233 12.0
Income d
Low, <185% 4,554 23.3 11,257 25.3 12,671 29.8
Middle, ≥185 to <400% 14,982 42.2 23,415 33.3 24,243 37.3
High, ≥400% 14,259 34.5 25,218 41.4 21,793 32.9
Household size e 2.6 0 2.6 0 2.6 0
Household composition f
Single 8,691 25.7 14,942 26.8 14,934 26.4
Multi-person without children 15,644 39.4 28,658 37.4 30,559 40.1 Multi-person with children 9,460 34.9 16,290 35.8 13,214 33.4 a
Values are presented as counts and column percentages [except for household size (mean ± s.e.)]. Percentages have been weighted to be nationally representative.
Data comes from the 2000, 2006 and 2012 Nielsen Homescan panel of household packaged food purchases. An observation represents all purchases made by a single household over a period of ≥10-12 months. b
35
c
Household self-reported maximum level of education. d
Ratio of family income to poverty threshold (calculated from self-reported household income) was used to categorize income according to the percentage of the poverty level.
e
Number of people living in the household.