Patient-Reported Roles, Preferences, and Expectations
Regarding Treatment of Stage I Rectal Cancer in the Cancer Care
Outcomes Research and Surveillance Consortium (CanCORS)
C. Tyler Ellis, MD, MSCR1, Mary E. Charlton, Ph.D2, and Karyn B. Stitzenberg, MD, MPH3
1Department of Surgery, University of North Carolina
2Department of Epidemiology, University of Iowa College of Public Health, Iowa City, IA
3Department of Surgical Oncology, Lineberger Comprehensive Cancer Center, University of North
Carolina
Abstract
BACKGROUND—Historically, stage I rectal cancer was treated with total mesorectal excision.
However, there has been growing use of local excision, with and without adjuvant therapy to treat these early rectal cancers. Little is known about how patients and providers choose amongst the various treatment approaches.
OBJECTIVE—To identify patient roles, preferences and expectations as they relate to treatment
decision-making for patients with stage I rectal cancer.
DESIGN AND SETTINGS—Geographically diverse population and health-system based cohort
study.
PATIENTS—154 adults with newly diagnosed and surgically treated stage I rectal cancer between
2003–2005.
MAIN OUTCOME MEASURES—We compared patients by surgical treatment groups: (1) total
mesorectal excision and (2) local excision. Clinical, sociodemographic, and health-system factors were assessed for association with patient decision-making preferences and expectations.
RESULTS—80% of total mesorectal excision patients vs. 63% of local excision patients expected
that surgery would be curative, p=0.04. The total mesorectal excision group was less likely to report that radiation would cure their cancer compared to the local excision group (27% vs 63%, p=0.004).
Correspondence: C. Tyler Ellis, MD, MSCR, University of North Carolina Department of Surgery, 4001 Burnett-Womack Building, CB# 7050, Chapel Hill, NC 27599-7050, Telephone: 919.843.9621, Fax: 888.842.6585, [email protected].
Conflicts of Interest: The authors have no conflicts of interest to declare. Author Contributions: All authors have made:
a. substantial contributions to conception and design, or acquisition of data, or analysis and interpretation of data;
b. drafting the article or revising it critically for import intellectual content;
HHS Public Access
Author manuscript
Dis Colon Rectum
. Author manuscript; available in PMC 2017 October 01.Published in final edited form as:
Dis Colon Rectum. 2016 October ; 59(10): 907–915. doi:10.1097/DCR.0000000000000662.
A
uthor Man
uscr
ipt
A
uthor Man
uscr
ipt
A
uthor Man
uscr
ipt
A
uthor Man
uscr
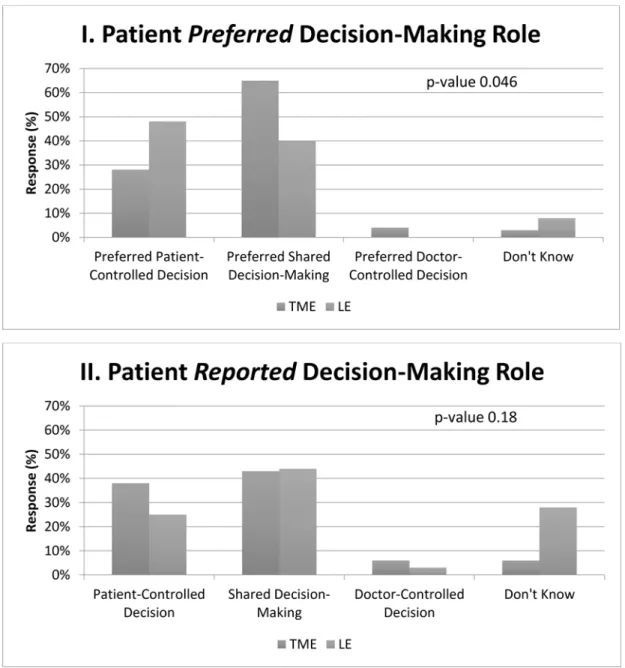
When asked about preferred role in decision making, 28% of total mesorectal excision patients preferred patient-controlled decision making compared with 48% of local excision patients, p=0.046. However, with regard to the treatment actually received, 38% of the total mesorectal excision group reported making their own surgical decision compared to 25% of the local excision group, p=0.18.
LIMITATIONS—Limited sample size.
CONCLUSIONS—Patients’ preferred making role did not match the actual
decision-making process. Future efforts should focus on bridging the gap between the decision-decision-making process and patients’ preferences of various treatment approaches. This will be particularly important as newer innovative procedures play a more prominent role in the rectal cancer treatment paradigm.
Keywords
rectal cancer; local excision; treatment decision-making
INTRODUCTION
The use of transanal local excision (LE) in the treatment of rectal cancer is increasing.1 While this trend is appropriate for some patients with low risk tumors, LE alone leads to inferior oncologic outcomes in patients with higher risk tumors.2,3 Reasons for the increase in LE have not previously been explored.
Total mesorectal excision (TME) alone has been and remains the standard of care for Stage I Rectal Cancer and provides excellent oncologic outcomes with >90% overall survival.4 However, other factors besides oncologic outcomes may influence decision making regarding treatment. Presumably, transanal operations are chosen for their lower operative morbidity and potential for improved quality of life.
LE is believed to have less impact on quality of life, with less possibility of permanent colostomy and less potential for short- and long-term bowel, bladder, and sexual dysfunction.5 However, little is known about the decision-making process with various treatment approaches.
Prior studies have found certain patient attributes are associated with higher participation in decision making for cancer care, such as younger age, better education, and better health.6–8 Patients who are younger and less educated, or patients who see higher-volume surgeons are less likely to have their actual roles match their preferred roles.9 Much of what is known comes from studies examining surgical decision making in breast cancer.9–11 To date, no study has investigated the surgical decision-making process for rectal cancer, a condition needing similar considerations of mortality and morbidity trade-off. Data from the Cancer Care Outcomes Research and Surveillance (CanCORS) study, a geographically
representative study of patients with recently diagnosed rectal cancer, provide an opportunity to gain insight into patients’ roles, preferences, and expectations with regard to their rectal cancer care. We hypothesized LE patients would play a more active role in the decision-making process than TME patients, however LE patients would expect a surgical cure less
A
uthor Man
uscr
ipt
A
uthor Man
uscr
ipt
A
uthor Man
uscr
ipt
A
uthor Man
uscr
frequently. Additionally, we hypothesized older age and higher comorbidity status would be a negative predictor of active decision-making in treatment.
METHODS
Study population and design
CanCORS is a geographically diverse population and health-system based cohort study including 4,713 adults age 21 or older with newly diagnosed, pathologically confirmed invasive colorectal cancer recruited between 2003–2005. Patients were recruited from four geographically based cancer registries in Northern California, Los Angeles County, North Carolina and Alabama, from five large health maintenance organizations (HMOs) that are part of the Cancer Research Network, and from five Veterans Affairs (VA) hospitals. A recent study by Catalano et al. demonstrated that the CanCORS Consortium was successful in enrolling a demographically representative sample within the CanCORS regions with a response rate of 53.2%.12
As previously described,12 eligible patients from these sites were contacted approximately 4 months after cancer diagnosis and asked to participate in a telephone survey. Study
participants responded within 1–12 months; the mean response time was 4 months after meeting initial eligibility criteria. No time limitation was allotted for survey response. Interviews included questions about sociodemographic information (age, sex, education, race, marital status, and health insurance status), treatments received, providers visited, and goals, beliefs and preferences with regard to treatment options.13
The CanCORS medical record abstraction (MRA) database contains detailed information on tumor characteristics and the acute treatment phase, including types of providers visited, staging procedures, and surgery, chemotherapy and radiotherapy regimens.12–14 Medical record information was also used to assign American Joint Committee on Cancer (AJCC) collaborative stage,15 and to determine Adult Comorbidity Evaluation–27 (ACE-27)16 comorbidity indicators.
Each patient who discussed surgery, radiation, or chemotherapy with a physician was asked to report his or her actual role, and preferred role in the decision by using a modified version of the validated Control Preference Scale,17 designed to be administered by telephone. For actual and preferred roles, the first two responses were categorized as patient-controlled, the third was considered patient-physician shared, and the last two were categorized as
physician-controlled decision making. Figure 1 and 2 provide the response options for these survey questions. In all analyses, actual and preferred roles were categorized as patient-controlled (responses 1 or 2), shared (response 3), or physician-patient-controlled roles (responses 4 or 5), as described previously.9,18
To identify current depression, a score of six or more symptoms on the eight-item Center for Epidemiological Studies-Depression Scale (CES-D) was used.19
A
uthor Man
uscr
ipt
A
uthor Man
uscr
ipt
A
uthor Man
uscr
ipt
A
uthor Man
uscr
Data Analysis
The sample consisted of patients with stage I adenocarcinoma of the rectum. Stage was based on a hierarchy of best available evidence with Collaborative Stage (calculated AJCC stage based on medical record abstracted tumor size, extension, lymph nodes and
metastases) at the top of the hierarchy.
Patients were divided into two groups based on surgical treatment: (1) local excision (LE) and (2) total mesorectal excision (TME). All individuals with stage I rectal adenocarcinoma (n=157) were initially included. We excluded three individuals because they underwent a fulguration procedure only. The main dependent variables were: (1) the patient role in treatment decision-making; (2) patient preferences; and (3) patient expectations regarding treatment. Clinical, sociodemographic, and health-system factors were assessed for association with patient decision-making, preference, and expectations.
Student’s t-test, chi-square, and Fisher’s exact tests were used to compare the groups on key variables obtained from the CanCORS survey and MRA database. Fisher’s exact tests were used when sample size was less than five. Multivariate analysis was not used to examine patient characteristics associated by surgical treatment due to the small sample size. All statistical analysis was performed in SAS v9.3 (Cary, NC). Institutional review board exemption was obtained from the University of North Carolina Institutional Review Board.
RESULTS
A total of 154 patients met the inclusion criteria. There were 122 patients who underwent TME and 32 patients who were treated with LE for stage I rectal cancer. 24% of TME patients and 31% of LE patients received either neoadjuvant or adjuvant chemoradiotherapy.
The characteristics of the two study groups are displayed in Table 1. Compared to the TME group, the LE group was more likely to be white, have moderate/severe comorbidities, and have a body mass index ≥ 30. Nonetheless, both groups had a similar self-reported health rating at the time of diagnosis.
The characteristics of the study population by actual decision-making roles are displayed in Table 2. Patients’ actual role in surgical decision-making was unavailable for 32 patients, 19% (23) TME vs. 28% (9) LE patients, p-value 0.25. Compared to patients <65, a nearly significantly smaller percentage of older patients (≥65 years) reported that they made decisions independently (33% vs. 50%); conversely, a larger percentage of older patients reported relying on physicians to control the decision-making (10% vs. 3%) regarding their surgical care (p= 0.08). Also, a larger percentage of individuals with higher education to reported making patient-controlled decisions, but the difference did not reach statistical significance (48% vs. 33%, p= 0.26).
Patients’ role, beliefs regarding treatment, and treatment preferences are displayed by surgery type in Table 3. For both groups, preferences regarding goals of treatment were similar; equal numbers wanted treatment that extends life as much as possible as compared to treatment that focuses on relieving pain. Yet, there was discordance between patients’
A
uthor Man
uscr
ipt
A
uthor Man
uscr
ipt
A
uthor Man
uscr
ipt
A
uthor Man
uscr
reported preferred and actual roles in treatment decision making. Figure 3. When asked about their preferred role in decision making, 28% of TME patients preferred patient-controlled decision making compared to 48% of LE patients (p=0.046). However, with regard to the treatment actually received, 38% of the TME group reported making their own surgical decision compared to 25% of the LE group (p=0.18).
Concerning patients’ beliefs, those who underwent LE were less likely than patients who underwent TME to report surgery “would likely cure their cancer” (63% vs. 80%, p= 0.04). Interestingly, for all patients who visited a radiation oncologist, the LE group was more likely to report that radiation would cure their cancer compared to the TME group, 63% vs 27%, p=0.004. This difference in curative expectations was unchanged when comparing only patients that received radiation treatment.
Sensitivity Analysis
When we excluded older individuals (≥80 years old) and individuals with severe
comorbidities, our key dependent variables did not change: patients’ preferred and actual decision-making roles. On subgroup analysis: when asked about preferred decision-making role, 29% of TME patients preferred patient-controlled decision-making compared with 47% of LE patients, p-value 0.02. With regard to the treatment actually received, 37% of TME group reported making their own surgical decision compared to 21% of the LE group, p-value=0.15.
DISCUSSION
There are an increasing number of treatment options for patients with early stage rectal cancer. Very little is currently known about how physicians and patients decide on the best treatment options for patient. This study sought to address this gap in our understanding, and is among the first to explore surgical decision-making for rectal cancer treatment. We focused on the contrast between local excision and proctectomy, as studies have shown that transanal procedures are increasingly used in treatment of rectal cancer.1,19
In this population-based study of stage I rectal cancer patients, there was a discrepancy between reported preferred decision-making role regarding surgical treatment and reported actual decision-making role. Patients who underwent LE stated more frequently that they preferred to control the decision-making process; however this did not occur in as frequently in practice.
Untangling discrepancies between preferred and reported patient decision-making is challenging, as studies are limited.20 Prior studies focused in breast cancer have found matching patients’ preferred and actual roles increased patient satisfaction.21,22 Whether prior work in breast cancer is generalizable to colorectal cancer patients is unclear.23 An older study that measured preferred treatment decision-making in colorectal cancer patients found that the majority wanted to have a passive role in decision making.24 However this is in stark contrast to our findings, where the majority of patients preferred collaborative or active decision-making roles. We suspect this difference is due to a cultural shift in patient expectations regarding their role in care over time. Although we found a discrepancy
A
uthor Man
uscr
ipt
A
uthor Man
uscr
ipt
A
uthor Man
uscr
ipt
A
uthor Man
uscr
between reported preferred and actual decision-making roles, we did not find a difference in patient satisfaction with surgical care based on matched decision-making roles (results not shown).
Baseline patient characteristics may affect the surgical treatment offered to patients or selected. Older patients and those with more comorbidities may be steered away from TME. For this study, we did do a sensitivity analysis excluding the oldest and sickest patients. However, excluding these two groups did not influence the results for the patients’ preferred and actual roles in the decision-making process. Health literacy may also be an important factor in treatment decision-making.20 We did not find any difference in surgical treatment by education. In addition, while our study was unable to measure patient knowledge of specific treatment options, the LE group reported less frequently that surgery would cure their cancer than the TME group, which does provide some indication that patients
understood the tradeoff of TME versus LE. At the same time LE patients were more likely to report radiotherapy as curative, which is inconsistent with medical teaching. Interestingly, a previous study showed patients more often reported the last treatment received as the curative treatment.25 While we were unable to assess the effects of temporality on patients’ perception of a treatment’s curative intent, this factor may have influenced our results.
We acknowledge there are many challenges to shared decision making with patients and in many cases this goal may be unrealistic. Often, it is not possible to fully inform patients who come in with limited knowledge about the treatment options yet have to make decisions that have major consequences. Furthermore, these difficult decisions are made at a time when patients are stressed with a new diagnosis of cancer and have only a short amount of time to review options with clinicians whom they have likely just met. Respecting patient
preferences for control or involvement in clinical decisions while balancing our professional responsibility to use our expertise is one of the great challenges in clinical medicine today.26 However, matching preferred to actual roles is important and will become increasingly relevant as we move toward more value-based care models and incentives based on outcomes, including patient-reported outcomes.27
The strengths of this study include factors that are inherent to CanCORS. The study cohort consisted of a population-based group of patients with rectal cancer from various geographic areas in the United States, and a robust set of variables, including information about
decision-making, clinical factors including stage of disease, and follow-up data. Unfortunately, although CanCORS represented the largest existing population-based collection of incident colorectal cancer cases, the sample size is small due to the relative infrequency of early stage rectal cancer. This limited the ability to examine the impact of sociodemographic factors on preferred and actual decision-making roles. In addition, the response rate for this survey varied by question asked (range 68 – 94%). We do not know if the experiences of the respondents are representative of the experiences of the
non-respondents, so there is potential for nonresponse bias. This self-reported information may have been collected at any point within four months of diagnosis. Patients’ perceptions of the role they played in decision-making may evolve over that time period, resulting in recall bias.22 A patient’s perception about what they desired as a role or what role they actually played could be influenced by their experience with the treatment and morbidity or
side-A
uthor Man
uscr
ipt
A
uthor Man
uscr
ipt
A
uthor Man
uscr
ipt
A
uthor Man
uscr
effects they could be experiencing. There were a large number of patients with Stage I rectal cancer receiving adjuvant therapy for a stage of disease traditionally treated by surgery only. It is possible that some of these patients were understaged by CanCORS. However,
excluding patients with neoadjuvant therapy did not significantly change our results (not shown). Lastly and probably most importantly, we do not know what information was presented to patients with regard to options and provider recommendations for care.21
To further our understanding of patient decision-making, future work should focus on how sociodemographic factors, such as gender and age, influence decision-making role preference for this patient group. Additionally, future investigations should examine how surgeon-patient interactions may best foster patient understanding of the risks and benefits of treatment options.
In conclusion, this study reveals there is a mismatch between patients’ reported preferred and actual decision making roles for early stage rectal cancer. Matching roles in the
decision-making process will add value to patients’ care received. Yet for complex decisions like the surgical treatment of early stage rectal cancer, providers must make sure patients are fully informed of the tradeoffs of treatment options, so we can empower each patient to make the best decisions possible.
Acknowledgments
The authors thank Dr. Tim Carey for mentoring and research development and Meredith Ellis, JD for editorial support.
Source of Funding: The work of the CanCORS Consortium was supported by grants from the National Cancer Institute (NCI) to the Statistical Coordinating Center (U01 CA093344) and the NCI supported Primary Data Collection and Research Centers (Dana-Farber Cancer Institute/Cancer Research Network U01 CA093332, Harvard Medical School/Northern California Cancer Center U01 CA093324, RAND/UCLA U01 CA093348, University of Alabama at Birmingham U01 CA093329, University of Iowa U01 CA093348, University of North Carolina U01 CA093326) and by a Department of Veterans Affairs grant to the Durham VA Medical Center CRS 02-164.
This research was partially supported by a National Research Service Award Pre-Doctoral/Post-Doctoral Traineeship from the Agency for Healthcare Research and Quality sponsored by The Cecil G. Sheps Center for Health Services Research, The University of North Carolina at Chapel Hill, Grant No. T32-HS000032.
References
1. Stitzenberg KB, Sanoff HK, Penn DC, Meyers MO, Tepper JE. Practice patterns and long-term survival for early-stage rectal cancer. J Clin Oncol. 2013; 31:4276–4282. [PubMed: 24166526] 2. You YN. Local excision: is it an adequate substitute for radical resection in T1/T2 patients? Semin
Radiat Oncol. 2011; 21:178–184. [PubMed: 21645862]
3. Nash GM, Weiser MR, Guillem JG, et al. Long-term survival after transanal excision of T1 rectal cancer. Dis Colon Rectum. 2009; 52:577–582. [PubMed: 19404055]
4. MacFarlane JK, Ryall RD, Heald RJ. Mesorectal excision for rectal cancer. Lancet. 1993; 341:457– 460. [PubMed: 8094488]
5. Bleier JIS, Maykel JA. Outcomes Following Proctectomy. Surg Clin North Amer. 2013; 93:89–106. [PubMed: 23177067]
6. Degner LF, Sloan JA. Decision making during serious illness: what role do patients really want to play? JCE. 1992; 45:941–950. [PubMed: 1432023]
7. Deber RB, Kraetschmer N, Irvine J. What role do patients wish to play in treatment decision making? Arch Intern Med. 1996; 156:1414–1420. [PubMed: 8678709]
A
uthor Man
uscr
ipt
A
uthor Man
uscr
ipt
A
uthor Man
uscr
ipt
A
uthor Man
uscr
8. Degner LF, Kristjanson LJ, Bowman D, et al. Information needs and decisional preferences in women with breast cancer. JAMA. 1997; 277:1485–1492. [PubMed: 9145723]
9. Hawley ST, Lantz PM, Janz NK, et al. Factors associated with patient involvement in surgical treatment decision making for breast cancer. Patient Educ Couns. 2007; 65:387–395. [PubMed: 17156967]
10. Guadagnoli E, Ward P. Patient participation in decision-making. Soc Sci Med. 1998; 47:329–339. [PubMed: 9681902]
11. Stewart MA. Effective physician-patient communication and health outcomes: a review. CMAJ. 1995; 152:1423–1433. [PubMed: 7728691]
12. Catalano PJ, Ayanian JZ, Weeks JC, et al. Representativeness of participants in the cancer care outcomes research and surveillance consortium relative to the surveillance, epidemiology, and end results program. Med Care. 2013; 51:e9–15. [PubMed: 22406968]
13. Malin JL, Ko C, Ayanian JZ, et al. Understanding cancer patients’ experience and outcomes: development and pilot study of the Cancer Care Outcomes Research and Surveillance patient survey. Support Care Cancer. 2006; 14:837–848. [PubMed: 16482448]
14. Ayanian JZ, Chrischilles EA, Wallace RB, et al. Understanding cancer treatment and outcomes: the Cancer Care Outcomes Research and Surveillance Consortium. J Clin Oncol. 2004; 22:2992– 2996. [PubMed: 15284250]
15. Greene, FL., editor. AJCC Cancer Staging Manual. 6th. Philadelphia: Lippincott Raven; 2002. 16. Piccirillo JF. The measurement of comorbidity by cancer registries. J Registry Manag. 2003; 30:1–
7.
17. Degner LF, Sloan JA, Venkatesh P. The Control Preferences Scale. Can J Nurs Res. 1997; 29:21– 43. [PubMed: 9505581]
18. Keating NL, Landrum MB, Arora NK, et al. Cancer patients’ roles in treatment decisions: do characteristics of the decision influence roles? J Clin Oncol. 2010; 28:4364–4370. [PubMed: 20713872]
19. Turvey CL, Wallace RB, Herzog R. A revised CES-D measure of depressive symptoms and a DSM-based measure of major depressive episodes in the elderly. Int Psychogeriatr. 1999; 11:139– 148. [PubMed: 11475428]
20. Tariman JD, Berry DL, Cochrane B, Doorenbos A, Schepp K. Preferred and actual participation roles during health care decision making in persons with cancer: a systematic review. Ann Oncol. 2010; 21:1145–1151. [PubMed: 19940010]
21. Keating NL, Guadagnoli E, Landrum MB, Borbas C, Weeks JC. Treatment decision making in early-stage breast cancer: should surgeons match patients’ desired level of involvement? J Clin Oncol. 2002; 20:1473–1479. [PubMed: 11896094]
22. Lantz PM, Janz NK, Fagerlin A, et al. Satisfaction with surgery outcomes and the decision process in a population-based sample of women with breast cancer. Health Serv Res. 2005; 40:745–767. [PubMed: 15960689]
23. Kehl KL, Landrum MB, Arora NK, et al. Association of actual and preferred decision roles with patient-reported quality of care: shared decision making in cancer care. JAMA Oncol. 2015; 1:50– 58. [PubMed: 26182303]
24. Beaver K, Bogg J, Luker KA. Decision-making role preferences and information needs: a
comparison of colorectal and breast cancer. Health Expect. 1999; 2:266–276. [PubMed: 11281903] 25. Charlton ME, Stitzenberg KB, Lin C, et al. Predictors of Long-Term Quality of Life for Survivors
of Stage II/III Rectal Cancer in the Cancer Care Outcomes Research and Surveillance Consortium. J Oncol Pract. 2015; 11:e476–86. [PubMed: 26080831]
26. Katz SJ, Lantz PM, Janz NK, et al. Patient involvement in surgery treatment decisions for breast cancer. J Clin Oncol. 2005; 23:5526–5533. [PubMed: 16110013]
27. Lynn J, McKethan A, Jha AK. Value-Based Payments Require Valuing What Matters to Patients. JAMA. 2015; 314:1445–1446. [PubMed: 26378889]
A
uthor Man
uscr
ipt
A
uthor Man
uscr
ipt
A
uthor Man
uscr
ipt
A
uthor Man
uscr
Figure 1.
Patient’s Preferred Responses by Control Category
A
uthor Man
uscr
ipt
A
uthor Man
uscr
ipt
A
uthor Man
uscr
ipt
A
uthor Man
uscr
Figure 2.
Patients’ Actual Response Options by Control Category
A
uthor Man
uscr
ipt
A
uthor Man
uscr
ipt
A
uthor Man
uscr
ipt
A
uthor Man
uscr
Figure 3. Patient Responses to Questions about Decision-Making Role Reported and Preferred by Patients
Shown are the responses of patients with stage I rectal cancer by surgical treatment type: total mesorectal excision (TME) or local excision (LE). Preferred role in the decision-making process reported by patients (Panel I). Actual role in the decision-decision-making process reported by patients (Panel II).
A
uthor Man
uscr
ipt
A
uthor Man
uscr
ipt
A
uthor Man
uscr
ipt
A
uthor Man
uscr
A
uthor Man
uscr
ipt
A
uthor Man
uscr
ipt
A
uthor Man
uscr
ipt
A
uthor Man
uscr
ipt
Table 1
Unadjusted Associations of Patient and Institutional Characteristics by Surgical Treatment. a
Characteristic No. of Patients LE TME P-valueb
Overall No. of patients 154 32 (21%) 122 (79%)
Sex 154
Female 12 (37%) 53 (43%) 0.55
Male 20 (63%) 69 (57%)
Lives Alone 154 12 (38%) 40 (33%) 0.64
White ethnicity 154 25 (78%) 68 (56%) 0.02
Age group (years) 154
<65 14 (44%) 65 (53%) 0.34
≥65 18 (56%) 57 (47%)
Comorbidities 154
None/Mild 18 (56%) 98 (80%) 0.005
Moderate/Severe 14 (44%) 24 (20%)
BMI 120
<30 14 (56%) 81 (85%) 0.005
≥ 30 11 (44%) 14 (15%)
Education 145
≤12 years 11 (36%) 49 (43%) 0.45
> 12 years 20 (65%) 65 (57%)
Insurance 154
Covered by ≥ 1 payer 22 (69%) 79 (65%) 0.67
None/Missing 10 (32%) 43 (35%)
Study Site 154
HMO 6 (19%) 27 (22%) 0.88c
Cancer Registry 21 (65%) 79 (65%)
VA 5 (16%) 16 (13%)
Chemotherapy 154
None 21 (65%) 86 (71%) <0.001c
Pre-op 1 (3%) 31 (25%)
A
uthor Man
uscr
ipt
A
uthor Man
uscr
ipt
A
uthor Man
uscr
ipt
A
uthor Man
uscr
ipt
Characteristic No. of Patients LE TME P-valueb
Radiotherapy 154
None 22 (69%) 90 (74%) <0.001c
Pre-op 1 (3%) 30 (24%)
Post-op 9 (28%) 2 (2%)
Chemoradiotherapy 154
Yes 10 (32%) 30 (24%) 0.44
No 22 (68%) 93 (76%)
CES-D Short Form 103
≥ 6 0 (0%) 11 (13%) 0.12
< 6 21 (100%) 71 (87%)
Survival 154
Alive at 7 Years Post-Diagnosis 24 (77%) 88 (72%) 0.51
Abbreviations: TME, Total Mesorectal Excision; LE, Local Excision; BMI, Body Mass Index; HMO, Health Maintenance Organization, VA, Veterans Affairs; SD, standard deviation; CES-D, Center for Epidemiologic Studies Depression Scale
a
Unless otherwise indicated, data are reported as number (percentage) of participants or decisions.
b
Pearson’s Chi-Square unless denoted by P-value
c
A
uthor Man
uscr
ipt
A
uthor Man
uscr
ipt
A
uthor Man
uscr
ipt
A
uthor Man
uscr
ipt
T ab le 2Associations of P
atients and Institutional Characteristics W
ith Roles in Decision-Making
a
Characteristics
No. of P
atients P atient-Contr ol Shar ed Decision-Making Ph ysician-Contr ol P-v alue b Se x 122 Female 24 (41%) 31 (54%) 3 (5%) 0.84 Male 27 (42%) 32 (50%) 5 (8%) Age Groups 122
<65 years old
32 (50%)
30 (47%)
2 (3%)
0.079
≥ 65 years old
19 (33%) 33 (57%) 6 (10%) Race 122 White 31 (40%) 41 (53%) 5 (7%) 0.91 Non-White 20 (44%) 22 (49%) 3 (7%) Comorbidities 122 None/Mild 39 (44%) 44 (49%) 6 (7%) 0.85 Moderate /Se v ere 12 (36%) 19 (58%) 2 (6%) BMI 117 <30 39 (42%) 48 (51%) 6 (7%) 0.93 ≥ 30 11 (46%) 12 (50%) 1 (4%) Li v es Alone 122 Y es 17 (37%) 27 (59%) 2 (4%) 0.48 No 34 (45%) 36 (47%) 6 (8%) Education 122
≤ 12 Grades
18 (33%)
32 (60%)
4 (7%)
0.26
> 12 Grades
33 (48%) 31 (46%) 4 (6%) Insurance 122 Y es 37 (44%) 42 (51%) 4 (5%) 0.40 No 14 (36%) 21 (54%) 4 (10%)
CES-D Short F
orm
100
≥ 6 (depression symptoms)
4 (36%)
6 (55%)
1 (9%)
A
uthor Man
uscr
ipt
A
uthor Man
uscr
ipt
A
uthor Man
uscr
ipt
A
uthor Man
uscr
ipt
Characteristics
No. of P
atients
P
atient-Contr
ol
Shar
ed Decision-Making
Ph
ysician-Contr
ol
P-v
alue
b
< 6
36 (40%)
46 (52%)
7 (8%)
Study site
122
HMO
9 (35%)
16 (62%)
1 (3%)
0.51
Cancer Re
gistry
37 (46%)
38 (48%)
5 (6%)
V
A
5 (31%)
9 (56%)
2 (13%)
Sur
gery T
ype
122
LE
8 (35 %)
14 (61%)
1 (4%)
0.70
TME
43 (43%)
49 (50%)
7 (7%)
Abbre
viations: BMI, Body Mass Inde
x; HMO, Health Maintenance Or
g
anization, V
A, V
eterans Af
fairs; CES-D, Center for Epidemiologic Studies Depression Scale
a Unless otherwise indicated, data are reported as number (percentage) of participants or decisions. b Fisher’s Exact T
A
uthor Man
uscr
ipt
A
uthor Man
uscr
ipt
A
uthor Man
uscr
ipt
A
uthor Man
uscr
ipt
T ab le 3 Patient Beliefs and T
reatment Preferences
a
P
atient Role in Decision-Making about Therapies
No. of patients
LE (n)
TME (n)
P-v
alue
b
Decision to ha
v
e sur
gery
146
P
atient made decision
8 (25%)
43 (38%)
0.18
c
P
atient made decision together with doctor
14 (44%)
49 (43%)
Doctors made decision
1 (3%) 7 (6%) Don’t Kno w 9 (28%) 15 (6%)
Decision to ha
v
e radiotherap
y
77
P
atient made decision
3 (19%)
16 (26%)
0.81
c
P
atient made decision together with doctor
7 (44%)
26 (43%)
Doctors made decision
5 (31%) 17 (28%) Don’t Kno w 1 (6%) 2 (3%)
Decision to ha
v
e chemotherap
y
70
P
atient made decision
5 (38%)
19 (33%)
0.90
c
P
atient made decision together with doctor
6 (46%)
22 (39%)
Doctors made decision
2 (15%) 14 (25%) Don’t Kno w 0 (0%) 2 (4%) P
atient Beliefs about Therapies
Sur
gery (“V
ery lik
ely” or Some
what lik
ely”)
146
W
ould lik
ely cure their cancer?
20 (63%)
91 (80%)
0.04
W
ould lik
ely prolong their life?
22 (69%)
88 (77%)
0.33
W
ould lik
ely help with their symptoms?
13 (41%) 67 (59%) 0.07 W ould lik ely ha v
e side ef
fects? 9 (28%) 50 (44%) 0.11 Radiotherap y (“V ery lik
ely” or Some
what lik
ely”)
71
W
ould lik
ely cure their cancer?
10 (63%)
15 (27%)
0.009
W
ould lik
ely prolong their life?
10 (63%)
25 (46%)
0.23
W
ould lik
ely help with their symptoms?
6 (38%) 19 (35%) 0.83 W ould lik ely ha v
e side ef
fects? 7 (44%) 35 (64%) 0.15 Chemotherap y (“V ery lik
ely” or Some
what lik
ely”)
58
W
ould lik
ely cure their cancer?
8 (67%) 24 (52%) 0.51 c W ould lik
ely prolong their life?
6 (50%)
31 (67%)
0.26
W
ould lik
ely help with their symptoms?
5 (42%) 18 (39%) 0.87 W ould lik ely ha v
e side ef
fects?
7 (58%)
31 (67%)
0.56
Role P
atient generally pr
efers to play in decision making and r
ole family play
A
uthor Man
uscr
ipt
A
uthor Man
uscr
ipt
A
uthor Man
uscr
ipt
A
uthor Man
uscr
ipt
Patient Role in Decision-Making about Therapies
No. of patients
LE (n) TME (n) P-v alue b Preferred Role 123 P
atient-controlled Decision Making
12 (48%) 27 (28%) 0.046 c Shared P atient-Ph
ysician Decision Making
10 (40%)
63 (64%)
Ph
ysician-Controlled Decision Making
0 (0%) 4 (4%) Don’t Kno w 3 (12%) 4 (4%) Role F amily Played 123 P
atient made the decision
15 (60%)
41 (42%)
0.15
c
Made the decision together with f
amily
8 (32%)
51 (52%)
F
amily made decision
0 (0%) 3 (3%) Don’t Kno w 2 (8%) 3 (3%) Pr efer ences r
egarding extension of life
Extension of life vs. pain and discomf
ort
123
Prefers treatment that e
xtends life as much as possible, e
v
en if it means ha
ving more pain/
discomfort
10 (40%)
38 (39%)
0.71
c
Prefers treatment that focuses on relie
ving pain as much as possible, e
v
en if it means not li
ving as
long
9 (36%)
39 (40%)
Don’t Kno
w/Refused to answer
6 (24%)
21 (21%)
Extension of Life vs. Cost of T
reatment
123
Prefers treatment that e
xtends life as much as possible, e
v
en if it means using up f
inancial resources 8 (32%) 49 (50%) 0.26 c
Prefers treatment that costs less, e
v
en if it means not li
ving as long
12 (48%)
34 (35%)
Don’t Kno
w/Refused to answer
5 (20%)
15 (15%)
Expected time to li
v
e, fatalism beliefs and concer
ns about tr
eatment
Expected time to li
v
e
105
Less than 5 years/In God’s Hands/Don’t Kno
w
6 (27%)
25 (30%)
0.80
At least 5 years
16 (73%) 58 (70%) F atalism Beliefs (“V ery lik
ely” or Some
what lik
ely”)
107
When bad things happen, we are not supposed to kno
w wh
y, we are just supposed to accept them.
8 (35%)
34 (41%)
0.62
People die when it is their time & nothing can change it.
10 (44%)
49 (58%)
0.20
Ev
erything that happens is a part of God’s plan
12 (52%)
55 (66%)
0.24
If bad things happen, it is because the
y were meant to be.
7 (30%) 39 (46%) 0.17 T reatment Concer ns (“V ery w
orried” or “Some
what w
orried”)
105
Side ef
fects from treatment
10 (45%)
43 (52%)
0.60
Cost of treatment
4 (18%)
23 (28%)
0.42
c
T
aking time a
w
ay from f
amily 1 (5%) 34 (41%) <0.0001 c T
aking time a
w
ay from w
ork 4 (18%) 22 (27%) 0.58 b T
ransportation to treatment
2 (9%)
10 (12%)
1.00
A
uthor Man
uscr
ipt
A
uthor Man
uscr
ipt
A
uthor Man
uscr
ipt
A
uthor Man
uscr
ipt
Abbre
viations: TME, T
otal Mesorectal Excision; LE, Local Excision
a Unless otherwise indicated, data are reported as number (percentage) of participants or decisions. b Pearson’s Chi-Square unless denoted by P-v
alue
c Fisher’s Exact T