2017 2nd International Conference on Computer Science and Technology (CST 2017) ISBN: 978-1-60595-461-5
A Relative Performance Standardization Method Based
on Discrimination and Means
Qiang LI
1, Mei SUN
2,a*, Shi-yao DUAN
3, Wei-long REN
3and
Pei-guang LIN
31Shandong Electronic Chamber of Commerce, Jinan, China, 250101
2School of Public Management, Shandong University of Finance and Economics, Jinan, China, 250014
3School of computer Science and Technology, Shandong University of Finance and Economics, Jinan, China, 250014
*Corresponding author
Keywords: Relative performance standardization, The weighted average method, Discrimination.
Abstract. Relative performance standardization is to transfer academic scores with different standardization to the scores with unified standardization. This paper proposes a performance standardization method using the two methods of statistics, which are the weighted average method and score standardization. By combining the standard scores and discrimination, the requirement of relative score standardization can be achieved according to a certain rule and standardized constrains. What is more, the effectiveness of the method, which is proposed in this paper, has been certified by the experimentation results.
Introduction
The academic score is usually considered as one of the most important indicators for evaluating both the studying of students and the teaching level of teachers. For evaluating students, the academic score, the total score and average score are the top 3 indicators. For evaluating teachers, the average score of all students is usually considered as the only one benchmark. Besides the advantages of this evaluation method, there are some disadvantages of it due to the different levels of exam difficulty and different evaluation standard [1]. To begin with, it is unfair to evaluate the learning situation of a student only by the final scores of courses. Given the final mark of English 73 and the final mark of Math 80, it may be regarded that the student does a better job on Math than English. But this situation can be reversed supposing the average of English is 60 and the average of Math is 80 respectively. In this case, it is obvious that the student behaves better on English. Besides, it is unfair to evaluate the student performance of a same course between different terms. For example, it is difficult to tell if the student makes a progress given the English mark 72 of the first year and the English mark 82 of the second year. What is more, it is difficult to compare the performance of diverse students because of the different classes, different majors, different schools, different textbooks, different teachers and different standards.
standardization, the learning situation of the student cannot be evaluated appropriately only by the raw course marks supposing the levels of difficulty of the courses are different. To be unprejudiced, it is necessary to explore how to standardize the original scores. In other words, relative standardized approaches should be applied to standardize the raw scores, revising the irrationality of the distribution of the raw scores [8]. After the standardization, the scores of different subjects with different difficulty levels can be inserted into the scores with the same difficulty. And it is undoubted that the evaluation of the students will be more fair and reasonable, making a better understanding of the learning situation of a student [5].
At the same time, it is necessary to explorer a reasonable standardization. To be specific, relative conversion should be used after the discrimination and average of scores has been determined, supporting a fair platform with standardized level for diverse raw scores.
In a word, it makes the evaluation more objective and fair by utilizing the standardized scores. So, it is significant and vital to explorer relative standardization methods.
Relative Research
There is massive research for score standardization, such as piecewise points method, square root by ten methods, variable weigh algorithm and so on.
Piecewise Points Method. According to the difficulty levels of subjects, different scores of different sections should be added a certain point, making the standardized scores different with the raw scores.
Square Root by Ten Method. Given original number s, find the square root of s and
then multiply 10, which is10×√ . The advantage of this method is unable to change the
ranking order unable to overstep the boundary (100 and 0). But the passing mark of this
method is 36 according to the equation10×√36 = 60.
Variable Weigh Algorithm. Two parameters should be used; one parameter is for adjusting the weights while the other is for adjusting the square root. Besides, the values of two parameters can be updated according to the different values of admissible marks [4].
Coefficient Adjustment Method. The kernel of this method is to evaluate the improvement of the students against their initial admission scores [5]. There are two
parameters needed for this method, which are the mean = ∑ and standard
deviation of the admission scores = ∑ ( − ) ⁄ .
Relative Performance Standardization Method Based on Discrimination and Means
Algorithm Thought
Given diverse groups of data, select one group of data as the standardized data, taking the discrimination and means as the evaluation norm. As for other groups of data, a series of transformations are taken according to the weighted average formula 4 and standard score formula 5, converting the data to the same level of standardization with the standardized data.
Algorithm Procedure
score formulas, which are mentioned above. The formulas will be introduced below. Given the actual score and the standard score , the standard weighted average could be calculated by weighted average formula 4.
Given the mean score X and the standard deviationS, the standard score zcould be
calculated by formula 5[7].
According to formulas 4 and 5, the weighted average F could be calculated. Besides,
the standard score of a certain score could be obtained by relational expression F F⁄ =
Z Z⁄ , which shows in formula 6.
What is more, the final standardized result is shown in formula 7. Among the formula
7, F is the average value of weighted standard score, and S is the standard deviation
of standardized score, and X is the average value of the standard scores.
= ( | ) ( ) (4) = − (5)
= ⁄ × (6) = × + (7)
The Selection of Comparable Data
Based on the scores of students, select the scores from all courses where discrimination is between 0.4 and 0.6 and the average scores are between 72 and 77[6]. After determining the standardized group of course, the relative mean score, variance [3] and weighted average would be picked up by computer. If there is no suitable candidate
subject score, the relative parameters are usually set as = 0.7, = 14, = 74.
There are several advantages of this method. To begin with, the ranking order of the scores cannot be inverted since the relational expression is used. Besides, the standardization of the method is based on the optimal discrimination or the discrimination close to the optimization [2]. As a result, the relative small discrimination of scores could become more distinguished. In other words, the highest standardized score may be higher than the highest raw score while the lowest standardized score could be lower than the lowest raw score.
Experimentation and Analysis Experimental Data
All the experimental data used in this paper is the scores of different courses of a class in a certain academic year.
Algorithm Performance
Given three courses , , selecting course as the standard course with the
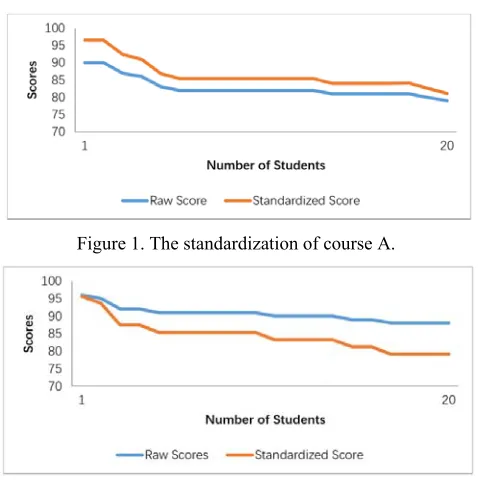
corresponding parameters = 0.7, = 14, = 74, the standardization of course
Figure 1. The standardization of course A.
Figure 2. The Standardization of course C.
It can be concluded that the order of standardized scores is the same as the order of the raw scores. However, the distinguish level of the scores is significantly improved. Contrast Experimentation
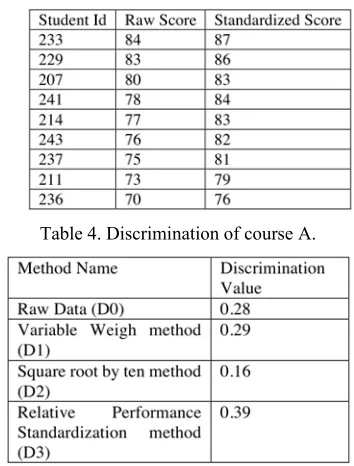
Table 4 is the experimental results of piecewise point’s method. It is obvious that the ranking order for student 207 and 241 after the standardization. For coefficient adjustment method, it needs the initial entrance examination score. So these two methods will not be used for the evaluation in this part. For the rest methods mentioned in this paper, the relative comparison of experimental results will be talked about below.
[image:4.612.178.443.538.669.2]Experimental Results. The passing scores in Fig. 3 and Fig. 4 are set to 62 and 65 respectively. It can be seen the ranking orders do not change for all three contrast methods, which are 1) square root by ten methods, 2) variable weigh algorithm and 3) the method proposed in this paper. But the trend of line chart of scores obtained by 1) is more gradual than those two methods. In other words, 1) behaves worse than the other methods because of the small discrimination.
Figure 4. Contrast experimental results of course C.
Discrimination Calculation. The discrimination calculation of scores is calculated by formula 8. To be specific, D represents the discrimination, which value is between -1 and 1, and it behaves better when the value of D is bigger. Besides, XH represents the average scores of the scores top 50% while XL points to the average score of the rest scores.
= 2( − )/ (8)
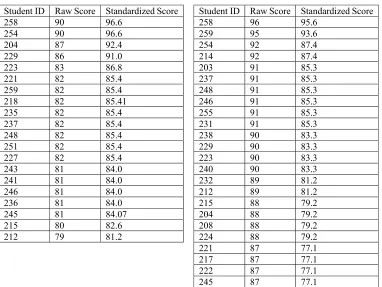
Table 1. The Standardization of Course A. Student ID Raw Score Standardized Score
258 90 96.6
254 90 96.6
204 87 92.4
229 86 91.0
223 83 86.8
221 82 85.4
259 82 85.4
218 82 85.41
235 82 85.4
237 82 85.4
248 82 85.4
251 82 85.4
227 82 85.4
243 81 84.0
241 81 84.0
246 81 84.0
236 81 84.0
245 81 84.07
215 80 82.6
[image:5.612.110.494.339.630.2]212 79 81.2
Table 2. The Standardization of Course C. Student ID Raw Score Standardized Score
258 96 95.6
259 95 93.6
254 92 87.4
214 92 87.4
203 91 85.3
237 91 85.3
248 91 85.3
246 91 85.3
255 91 85.3
231 91 85.3
238 90 83.3
229 90 83.3
223 90 83.3
240 90 83.3
232 89 81.2
212 89 81.2
215 88 79.2
204 88 79.2
208 88 79.2
224 88 79.2
221 87 77.1
217 87 77.1
222 87 77.1
245 87 77.1
Using formula 8, the relative values of discrimination of the methods for course A and C are demonstrated in Table 3 and Table 4 respectively.
It can be seen that > > > both in Table 3 and Table 4. In a word, the
[image:5.612.112.494.340.627.2]Table 3. Experimental Result of Piecewise Points Method.
Table 4. Discrimination of course A.
Conclusion
The meaning of the standardization of scores lies in it transforms the courses with different difficulty levels into the scores with the same difficulty level. And the standardized scores can guarantee a more objective and precise evaluation of the students' performance, reducing the influence caused by courses of different difficulty levels. Through the experimentation, the effectiveness and comparability of the method proposed in this paper have been certified.
Acknowledgement
This work was supported by Human & Social Science Project of MOE (15YJAZH042), Key project of teaching reform of higher education in Shandong Province (2015Z058)
References
[1] H. Yin, H. Liu, Z. Ouyang, etc. The Standardization of university Course achievement under the credit system[J]. Higher Agricultural Education, 2005(12):62-64. In Chinese.
[2] G. Jing. Standardization of Examination Score - New Method of Scoring [J]. Chinese exam: college entrance examination version, 1997(1). In Chinese.
[3] J. Xie. Mathematical Statistics Analysis of Test Paper Quality [J]. Network Wealth, 2010(21):207-208. In Chinese.
[4] B. Hai. Research on Achievement Standardization Algorithm and System Realization [J]. China's Extracurricular Education, 2008(9). In Chinese.
[6] N. Wang, X. Wang. Standardized Processing and Teaching Quality Management of Classroom Teaching Evaluation[J]. Secondary medical education,1999,09:32-35 In Chinese.
[7] M. Yang. The Importance of the Standard Score in the Assessment of Students' Academic Achievement - A Case Study of the Achievement of English Majors in a University [A]. Foreign Language Education and Translation Development and Innovation Research (Volume IV) [C]. 2015:4. In Chinese.