1 Abstract
Fine particulate matter (PM2.5, aerosol with aerodynamic diameters ≤ 2.5 µm) has been classified
by the U.S. Environmental Protection Agency (EPA) as an important air pollutant to mitigate due
to its adverse impacts on human health, air quality and climate change. Prior research has shown
that the atmospheric oxidation of 2-methyl-3-buten-2-ol (232-MBO), a volatile organic
compound (VOC) emitted from coniferous trees, leads to the formation of PM2.5 in the presence
of anthropogenic pollutants. The goal of this honors thesis work was to resolve the exact
chemical formation mechanisms of secondary organic aerosol (SOA) derived from MBO
ozonolysis in the presence of acidic sulfate aerosol. SOA is a type of PM2.5 that is formed from
the oxidation of volatile organic compounds such as MBO. Experiments were conducted in a
10-m3 Teflon smog chamber. SOA constituents were characterized at the molecular level by using
gas chromatography/mass spectrometry (GC/MS) and liquid chromatography/quadruopole
time-of-flight mass spectrometry equipped with electrospray ionization (LC/(-)ESI-QTOFMS) in the
negative ion mode. Furthermore, total organic peroxide content of the SOA was determined
using an iodometeric spectroscopic method. Preliminary results indicate that the presence of
acidic sulfate aerosol doubled the SOA mass loadings compared to less acidic sulfate aerosol.
Characterization of the SOA at the molecular level revealed the formation 2-methylerythritol and
2-dihydroxyisopentanol, which might serve as potential tracer (marker) compounds for this type
of SOA in PM2.5 collected from field studies. Analysis of peroxide content of select experiments
showed that conditions that produced the highest concentration of peroxides were acidic seed in
2 Acknowledgements
I would like to thank Tianqu Cui for assisting me with research presented in this paper and for
being an excellent mentor. I would also like to thank my committee: Dr. Jason Surratt, Dr. Louise
3 Table of Contents
Abstract ... 1
Acknowledgments ... 2
Table of Contents ... 3
1. Introduction ... 5
2. Materials and Methods ... 9
2.1 Chamber Operation ... 9
2.2 Filter Extraction ... 11
2.3 GC/MS Analysis of DHIP and 2-Methylerythritol ... 11
2.4 UPLC/ESI-HR-QTOFMS Analysis of MBO-derived Organosulfate (m/z 199) ... 12
2.5 Iodometric Spectroscopic Method Used for Quantification of Total Organic Peroxides .. 12
3. Results and Discussion ... 13
3.1 Effect of Aerosol Acidity ... 13
3.2 Effect of OH Scavenger: OH vs. O3 Dominated Oxidation ... 14
3.3 Role of Nucleation ... 15
3.4 Preliminary Peroxide Results ... 16
3.5 Atmospheric Implications ... 16
3.6 Limiations ... 17
4. Conclusions... 18
References ... 21
Table 1 ... 23
Table 2 ... 23
4
Figure 1 ... 24
Figure 2 ... 24
Figure 3 ... 24
Figure 4 ... 24
Figure 5 ... 25
Figure 6 ... 26
5 1. Introduction
Atmospheric particulate matter (PM), which is as a form of aerosol, is either directly
emitted from burning of fossil fuels and biomass or indirectly formed from the atmospheric
conversion of natural and anthropogenic gaseous emisisons.1 PM2.5 are atmospheric aerosol
particles that have aerodynamic diameters of less than 2.5 µm and contain liquid and/or solid
phases. Sources of PM2.5 are important to understand since they can adversely impact human
health, air quality, and the climate system.1,2 Decreases in the amount of PM
2.5 in the atmosphere
have been linked with increases in the life expectancy of individuals in the surrounding area.3
Seaton et al.4 reported that PM2.5 may aggravate lung illness by causing increased alveolar
inflammation and by increasing the ability of the blood to form clots.4 PM2.5 has also been shown
to directly reflect incoming solar radiation or indirectly lead to the formation of clouds, thus
contributing to cooling on a local and global scale.5 The Intergovernmental Panel on Climate
Change (IPCC) reported that the radiative forcing due to aerosol was -0.5 W/m2 (the negative sign
indicates that aerosols contribute to cooling rather than heating);6 however, this depends on the
type of aerosol present and results in large uncertainties in the aerosol effect on the Earth’s climate
system.
The aerosol type that is of most interest to the research presented in this honors thesis is
secondary organic aerosol (SOA). SOA is formed from the atmospheric oxidation of volatile
organic compounds (VOCs), which leads to less volatile products that either nucleate or condense
into the particulate phase. It is difficult accurately predict the amount of SOA in the atmosphere,
and thus, the total amount of PM2.5 because the sources and formation mechanisms of SOA are not
6 SOA formation chemistry is highly complex due to the multitude of reactions that VOCs
can undergo. Oxidation reactions of VOCs can then be divided into three different categories:
hydroxyl radical (OH)-initiated reactions that occur during the day, nitrate radical (NO3)-initiated
reactions that occur during the night, and ozonolysis reactions that can occur during either day or
night.1 Furthermore, each of these reactions is influenced by the reactivity, volatility, and water
solubility of each individual VOC and its respective oxidation products.7 SOA formation chemistry
is further complicated by the fact that some of the oxidation products derived from the parent VOC
can undergo particle-phase (multiphase) reactions. This makes it difficult to develop mechanisms
that could be used to help document the total amount of SOA (or PM2.5) in the atmosphere.
The following honor’s research thesis focuses on the chemistry pertaining to
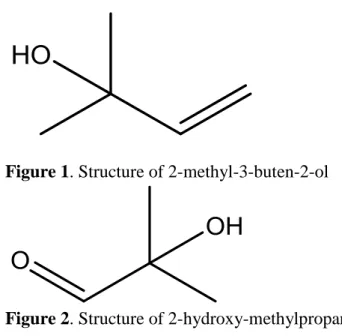
2-methyl-3-buten-2-ol (232 MBO). MBO (Figure 1) is of atmospheric relevance because it is one of the few
biogenic volatile organic compounds (BVOCs) that are sufficiently reactive to contribute to the
formation of SOA.8 Isoprene (2-methyl-1,3-butadiene) and other terpenoid compounds (such as
monoterpenes and sesquiterpenes) are the two other major BVOCs that comprise a combined 55%
of the total BVOC emission in the United States, which is 84 TgC year-1.9 Global emissions of
MBO have been reported to be 9.6 Tg year (11% of total emissions).8 On a regional scale, MBO
constitutes 3.8% of the BVOC emissions in the United States (3.2 TgC year-1).9 Although the
overall emissions of MBO are lower in comparison to isoprene and terpenoid compounds, they
could contribute a substantial amount to SOA production on a local scale. In areas where pines
and firs dominate, MBO emissions have been reported to be as high as 6 ppb, which surpasses
isoprene emissions in the same region.5,8
Current literature surrounding MBO has dealt with OH-initiated oxidation and ozonolysis
7 and sulfur dioxide (SO2). Analysis of the gas-phase products resulted in the identification of
(2-hydroxy-2-methylpropanal, Figure 2) 2-HMP, an indicator compound for MBO photooxidation.
Formaldehyde, acetone, and methylglyoxal can be formed through OH oxidation or photolysis of
2-HMP. Jaoui et al.8 characterized products formed during the experiments, which led to the
identification compounds such as acetone, glyoxal, formaldehyde, and 2,3-dihydroxyisopentanol
(DHIP, Figure 3). Jaoui et al.8 suggested that NOx had an inhibitory effect on SOA formation and
that DHIP has the potential to be used as a tracer for MBO-derived SOA. Carrasco et al.9 conducted
MBO ozonolysis experiments under dry and humid conditions. They observed the formation of
three main carbonyl compounds: formaldehyde, acetone, and 2-hydroxy-2-methylpropanal
(referred to as HMPr instead of 2-HMP). These previous experiments utilized NO2, which led to
the conclusion that acetone and glycloaldehyde were formed in the presence of NO2 and that HMPr
and formaldehyde were formed in its absence. Additionally, it was observed that acetone was not
formed under humid conditions, and thus, not formed in the natural atmosphere. Yields of
formaldehyde and HMPr derivatives increased under humid conditons.9 OH radical chemistry, as
opposed to ozonolysis, was observed to control daytime chemistry.9 Zhang et al.10 proposed that
organosulfates could also serve as SOA tracers for MBO photooxidation. The organosulfate
corresponding to mass-to-charge ratio (m/z) 199 (Figure 4) was found to be present in both
laboratory experiments and air samples taken from the field.10
SOA formation is affected by a variety of factors, including oxidant type (OH radical and
ozone (O3)) and relative humidity (RH). The study conducted by Carrasco et al.9 examined O3 and
OH initiated reactions of MBO. The investigators found that ozonolysis and OH
radical-initiated reacions each yielded different amounts of products. For example, the production
8 43%±12% in the O3 reaction.9 Zhang et al.11 demonstrated that increased RH had suppressed SOA
formation;11 more specifically, they observed that the SOA yield was two times larger for the low
RH (15-40%) experiments compared to the high RH (40%-90) experiments.11 Carrasco et al.9 also
examined the effect of RH on MBO ozonolysis chemistry. They found that acetone derivative
compounds were less abundant under humid conditions (>20% RH), whereas HMPr derivatives
increased under humid conditions. After quantifying the production yields, it was observed that
acetone, formic acid, and formic anhydride were only observed under dry conditions, whereas the
production yield of HMPr increased dramatically under humid conditions.9
Zhang et al.10 also investigated the effect of aerosol acidity on SOA formation from MBO.
They found that the relationship between aerosol acidity and SOA formation for MBO was similar
to that of isoprene and α-pinene. It was reported that increasing aerosol acidity was shown to
increase MBO-derived SOA formation.10 However, few studies have experimentally characterized
the SOA formation mechanisms and yields derived from the ozonolysis of MBO.
Zhang et al reported a diagram that represents what is currently known about the oxidation
of MBO (Figure 4)10. The figure notes that it is believed that MBO forms SOA products through
an epoxide intermediate. The exact mechanisms of how MBO is converted to this epoxide are
unknown. The research presented this is directed looking at the mechanism of MBO ozonolysis
and seeing how it might lead to the formation of the epoxide. The figure notes the potential
importance of peroxides in the formation of SOA, by indicating peroxides as intermediates for the
OH oxidation pathway to the formation of the epoxide.
This honor’s thesis seeks to systematically characterize the SOA constituents derived from
MBO ozonolysis using the UNC indoor smog chamber facility. Specifically, we examined the
9 yields. This thesis also seeks to provide new insights into SOA formation from MBO ozonolysis
that might derive from nucleation processes.
2. Materials and Method 2.1 Chamber operation
The experiments were conducted in a 10-m3 indoor Teflon smog chamber. Prior to each
experiment the chamber was flushed and purged using purified dry air for at least 24 hours. The
experiments were conducted under dark conditions using a temperature maintained between
21-23 oC and RH of <5% for dry experiments. Neutral seed aerosol was generated in the chamber by
atomizing a 0.06 M (NH4)2SO4 (aq) stock solution made with ultrapure water. Acidified seed
aerosol was generated in the chamber by atomizing 0.06 M (NH4)2SO4 (aq) + 0.06 M H2SO4(aq)
stock solution that was also made with ultrapure water. Injections of seed aerosol were made using
a mass flow controller with the flow rate set to 5 L/min. The mass flow controller was turned on
for 2 minutes to allow for an initial detection of aerosol particles, after which purified air was
turned on to aid in uniform mixing of the chamber. Aerosol concentrations were measured using
a differential mobility analyzer (DMA, Brechtel Manufacturing, Inc. (BMI), Model 2002) coupled
to a mixing condensation particle counter (MCPC, BMI, Model 1700). The target mass
concentration for seed aerosol was between 55 and 60 µg/m3 assuming the seed aerosol density =
1.0 g/cm3. One hour was allotted for the seed concentration to stabilize and obtain a decay rate due
to wall losses.
MBO (17.5 µL, converted to a mixing ratio of 400 ppb in chamber, ≥98%, Sigma Aldrich)
was injected into the chamber through a 10 mL manifold heated to approximately 55oC. N2 heated
at 55oC was passed into the manifold to deliver MBO into the chamber at a rate of 4 L/min for 30
10 capillary column (Nonpolar, Grace AllTech, Econo-Cap-EC-5 Capillary Column) and interfaced
to a flame ionization detector (GC-FID, Model CP-3800, Varian). The retention time of MBO was
determined to be 12.5 min.
For selected experiments, 60 ppm diethyl ether was used as an OH scavenger in order to
characterize SOA growth and formation that would occur with the absence of OH radical-initiated
oxidation. The scavenger was injected into the chamber using the same equipment as the MBO
injection; specifically, heated N2 was used to assist in the injection at a flow rate at of 1 L/for
approximately one hour. The GC-FID was also used to monitor the concentration of the diethyl
ether, which was determined to have a retention time of 2.5 min on the column. The temperature
program for the GC-FID was as follows: it started at 70oC and held for 2 minutes, after which the
temperature increased at a rate of 10oC/min till it reached 120oC (7 min). This temperature was
then held for 2.5 min. The oven temperature for the detector was 250oC and the sampling rate
from the chamber was .45 L/min. The sample flow in the GC-FID was .03 L/min. The carrier gas
used for the GC-FID for these experiments was helium and the fuel gas for the detector was
hydrogen. The O3 was injected into the chamber to trigger the reaction using an ozone generator
(Model L21, Pacific Ozone) with a flow rate of 4.7 L/min for 45 seconds. The target ozone
concentration in most of the experiments was 800 ppb. The O3 concentration was continuously
measured using an ultraviolet photometric ozone monitor (Thermo Electron, Model 49). During
the experiments the temperature and RH were measured using a dew point meter (Omega
Engineering).
When the maximum of SOA growth was observed, two Teflon filter samples (47-mm
diameter, 1.0-µm pore size, Tisch Environmental) per experiment were collected for
11 done placing the filter in a container that attached directly to the chamber. A line was attached
from a pump to the container, which was used to pull air through the container. This allowed for
the particles present in the chamber to be sucked onto the filter.
2.2 Filter extraction
The Teflon filters were extracted by 45 min of sonication in 22 mL of high purity methanol
(LC-MS CHROMASOLV-grade (≥99.7), Sigma-Aldrich) for both analyses by gas
chromatography/electron ionization mass spectrometry (GC/EI-MS) and ultra-performance liquid
chromatography interfaced to a high-resolution quadrupole time-of-flight mass spectrometer
equipped with electrospray ionization (UPLC/ESI-HR-QTOFMS). Filters that would be used for
the iodometric spectroscopic method used to quantify total organic peroxides were extraction in a
20 mL 50:50 mixture of methanol and high purity ethyl acetate (LC-MS CHROMASOLV-grade
(≥99.9), Sigma-Aldrich). After the scintillation vials were sonicated for 45 min, the solutions were
transferred to separate vials.
2.3 GC/MS Analysis of DHIP and 2-Methylerythritol
The GC/EI-MS consisted of a Hewlett 5890 Packard Series II GC equipped with an
Econo-CapTM-ECTM-5 column (30 m × 0.25 mm × 0.25 µm) interfaced to an HP 5971A Series mass
selective detector. For GC/MS analysis samples taken to dryness under a constant flow of N2 and
then the derivatizing reagents (100 µL of BTSFA and 50 µL of pyridine) were added. The samples
were heated for one hour at 70oC, and then transferred to the GC auto-sampler amber vials. A
previously obtained standard curve of 2-methylerythritol was used for the calibration of the
GC/MS and quantification of DHIP and 2-methylerythritol. The concentrations used for generating
the calibration curves were 2.5 ppm, 5 ppm, 10 ppm, and 25 ppm. Detailed operating conditions,
12 2.4 UPLC/ESI-HR-QTOFMS Analysis of MBO-derived Organosulfate (m/z 199)
As with the GC/EI-MS analysis, the aerosol extracts were dried using a steady N2 flow at
room temperature. The vials were reconstituted with 150 µL of a 50:50 mixture of high-purity
methanol and high-purity water (Milli-Q, 18.2 MΩ). For this analysis an Agilent 6520 Series
ESI-HR-QTOFMS was operated in the negative ion mode. The column used for the experiments was
a Water Acquity UPLC HSS T3 column. The mobile phase consisted of a gradient of 0.1% acetic
acid in methanol (solvent A) and 0.1% acetic acid in water (solvent B). Detailed operating
conditions and procedures for the UPLC/ESI-HR-QTOFMS analyses can be found in Zhang et al
2011.11
2.5 Iodometric Spectroscopic Method Used for Quantification of Total Organic Peroxides For peroxide analysis, the filters were extracted in the 50:50 mixture of ethyl acetate and
methanol by sonication. After being taken to dryness under a stream of N2, samples were
reconstituted with 2 mL of the ethyl acetate-methanol solvent, and then mixed with an additional
3 mL of reagent (0.53:0.27:0.20 acetic acid:chloroform:Milli-Q water). 50 mg Potassium iodide
(KI) was then added under anaerobic conditions in order to titrate the total organic peroxides
collected on the filter samples.
The 5 mL solutions of collected SOA constituents were purged with N2 for approximately
5 minutes before KI was added, in order to remove dissolved O2. After the KI was added, the
solution was pressurized by adding ultra-pure nitrogen for 20 seconds and allowed to stand for 1
hr to allow the reaction to take place.
Analysis of the sample solutions was done through UV-VIS spectrometry
(Spectrophotometer, U-3300, Hitachi). The quantification was done using benzoyl peroxide
13 3. Results and Discussion
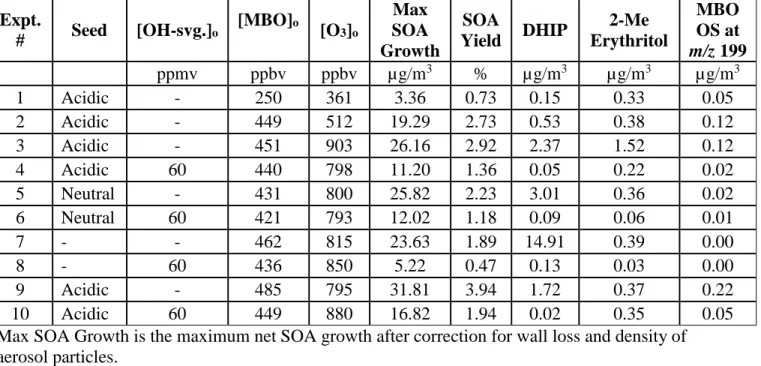
Conditions and results from the 10 experiments conducted for this thesis are summarized
in Table 1. All experiments shown in this table were conducted under dry conditions (RH<5%).
The results for SOA formation and yield are plotted in Figure 1. Aerosol volume size distributions
measured by the DMA were converted to total aerosol mass values by multiplying by the density
of organic aerosol (1.4 g/cm3). This density is typically assumed for organic aerosol,1 but should
be later corrected for the actual value. However, the actual value of the MBO-derived SOA density
was not the focus of this thesis. SOA yields, corrected for chamber wall loss, were calculated using
the SOA mass determined assuming a density of 1.4 g/cm3 divided by the mass of MBO reacted
during each chamber experiment. The correction for chamber wall loss was done by determining
the equation for wall loss and subtracting the SOA values obtained from it from those observed
using the DMA. As a result of the limited amount of data collected from peroxide analysis, results
of the peroxide assay will not be presented in this paper. The experiment with the highest SOA
formation was Experiment 9 (31.81 µg/m3), which had the corresponding experimental conditions
of acidic seed and no OH scavenger.
3.1 Effect of Aerosol Acidity
Experiments 3 and 5 (acidic and neutral, respectively, in the absence of OH scavenger) and
4 and 6 (acidic and neutral, respectively, in the presence of OH scavenger) from Table 1 were used
to examine the effect of aerosol acidity on MBO-derived SOA formation. From Experiment 3
(26.16 µg/m3 of SOA produced) and 5 (25.82 µg/m3 of SOA produced), it was observed that the
effect of aerosol acidity on overall SOA formation from ozonolysis in the presence of OH radical
14 OH was also found to be negligible; 11.20 µg/m3 in Experiment 4 (acidified seed + OH scavenger)
and 12.02 µg/m3 in Experiment 6 (neutral seed + OH scavenger).
Interestingly, effect of aerosol acidity on the profile of MBO-derived SOA constituents (or
molecular tracers) was much different than observed for the total SOA mass described above. The
mass concentrations of the DHIP8 and 2-methylerythritol were found to be much higher in the
acidic seed experiments than in the neutral seed experiments. This also applies to the MBO-derived
organosulfates at m/z 199. It was observed, that the overall contribution of the organosulfate to
total SOA formation was small. The increase in the concentration of organosulfates with acidity
supports the high correlation coefficient between acidity and MBO organosulfate concentration
proposed by Zhang et al.10 Increases in the concentration of MBO-derived SOA molecular tracers
due to the presence of acidic sulfate aerosol can be observed in the both experiments examining
the co-presence of O3 and OH radicals (Experiments 3 and 5) and to those experiments only using
O3 (Experiments 4 and 6).
3.2 Effect of OH Scavenger: OH vs. O3 Dominated Oxidation
From Figure 1 it was determined that the amount of SOA formed and the SOA yields for
the experiments without OH scavenger were greater than those with OH scavenger. Table 1 can
be referred for the specific values for both SOA formation and SOA yields.
The purpose of using an OH scavenger was to inhibit OH radical-initiated oxidation
chemistry of MBO, so that the SOA formation from ozonolysis could be isolated. The SOA
formation in the experiments without OH scavenger represents a combination of both ozonolysis
and OH radical- initiated oxidation. The amount of SOA formed from the acidic sulfate aerosol
experiments without scavenger appears to be more than double that of the experiments with
15 trend also applies to the neutral sulfate aerosol experiments where SOA concentration for
Experiment 5 (without OH scavenger) was 25.82 µg/m3 and the concentration of Experiment 6
(with OH scavenger) was only 12.02 µg/m3. This suggests that SOA contribution to total SOA
formation from the OH radical-initiated oxidation is equivalent to that of ozonolysis.
3.3. Role of Nucleation
Nucleation is the formation of aerosol particles from precursor compounds without the
presence of pre-existing aerosol surfaces on to which the gaseous products can condense. The data
collected from experiments in the absence of pre-existing sulfate seed aerosol suggests that the
amount of SOA produced from MBO ozonolysis in the absence of seed aerosol is comparable to
the SOA production in the presence of seed present when OH scavenger was not used. In the
presence of scavenger, the yield SOA decrease in yield was more striking - by a factor of ~ 3,
compared to the presence of seed. SOA production in Experiment 8 (no pre-existing sulfate aerosol
and with OH scavenger present) was 5.22 µg/m3(47%) while amount of SOA produced in
Experiment 7 (no pre-existing sulfate aerosol and without OH scavenger) was 23.63 µg/m3
(1.89%).
Another observation that can be made from the experiments without seed aerosol is the
effect of nucleation on mass concentrations of the MBO-derived SOA molecular tracers.
Examination of both Figure 2 and Table 1 reveals that the experiment without sulfate aerosol and
in the presence of OH scavenger yielded the highest mass concentration for DHIP (14.91 µg/m3).
This result suggests that the gas-phase chemistry (particularly gas-phase OH radical oxidation)
may play an important role in the formation of DHIP. This does not apply to the SOA molecular
16 OH scavenger (Experiment 7) was similar to that of the neutral experiment without an OH
scavenger (Experiment 5).
One concern is that part of the DHIP observed using the GC/MS may have been a
byproduct of the acid-catalyzed trimethylsilylation reaction with peroxide rather than a SOA
product originally from the ozonolysis of MBO.
3.4 Preliminary Peroxide Results
Table 2 provides the peroxide information collected from three experiments (8, 9, and 10).
The data collected shows that the experiment with acidic seed and no OH scavenger (experiment
9) yielded the highest peroxide concentration (50.71 µg/m3). Experiment 10, which involved no
seed and OH scavenger yielded the smallest peroxide concentration (17.05 µg/m3). In Table 2. The
percent contribution of organic peroxides to total SOA mass is recorded. It was observed that for
each of the experiments the percent contribution to total SOA mass was greater than 100
(experiment 8: 397%, experiment 9: 159%, experiment 10: 121%). These values were determined
by dividing the peroxide concentrations by the total SOA formation. The mass used for the
quantification of peroxides was 300 g/mol.
3.5 Atmospheric Implications
In the present report, the effects of aerosol acidity on SOA production from MBO
ozonolysis along with the contributions of nucleation to SOA formation were examined. The
experiments demonstrated that aerosol acidity can increase the mass concentrations of certain
MBO-derived SOA constituents but not the total SOA mass. This was in agreement with previous
studies.8
By comparing experiments containing mixtures of OH radical and O3 with those
17 even dominant role in the total amount of MBO-derived SOA mass produced. This information
will be beneficial in developing explicit chemical mechanisms that produce MBO-derived SOA in
the atmosphere. Although we understand that OH radical dominates the SOA production and
which products can be produced in the aerosol phase, more work is needed to understand the
explicit gas-phase chemistry occurring. The latter will require the use of novel analytical
techniques like our group’s iodide CIMS instrument.
In this report, SOA formation from nucleation was documented. Previous research has not
attempted to quantify the amount of SOA formed from nucleation of oxidation products produced
from MBO oxidation. Additionally, this study documented the differences between the SOA
formed from nucleation when OH was present and when it was not. This study found that, when
considering nucleation, the majority of SOA was formed from MBO reacting with OH radicals.
This result has demonstrated the need for our group to conduct more experiments and monitor the
gas-phase oxidation products responsible for nucleation (new particle formation) events and to
fully quantify these characterized products in the gas phase.
One interesting observation was how the concentration of 2-methylerythritol changed
between the different experimental conditions. 2-methylerythritol is a tetrol, so it is unclear how it
is forming, considering that the other tracer compound of interest DHIP is only a triol. This is
especially unusual considering that even in the experiments with OH scavenger, 2-methylerythritol
is observed. This poses the question of where is the additional OH group coming from.
3.6 Limitations
Though comparisons were made between the experiments to help illustrate observations,
it is necessary to point out that the initial concentrations of ozone and MBO between each
18 comparisons, since the effects of the differences between the ozone and MBO concentrations are
unknown. The small variability of temperature and RH, not reported in Table 1, between
experiments is believed to have a negligible effect on SOA formation.
The mixing ratios of O3 and MBO under which these experiments were conducted are
larger compared to ambient levels (6 ppb for MBO).8 Carrasco et al conducted their studies using
an MBO concentration of 200ppb.9 Thus, the measured SOA yields and mass concentrations for
the chemical products presented in this report are much larger than would be observed in the
atmosphere. Higher concentrations were used because of the detection limits of the analytical
equipment (GC/EI-MS and UPLC/ESI-HR-QTOFMS). This allowed us to detect the
MBO-derived SOA tracers and better understand the reaction conditions needed to form them.
Another limitation of this study is that the experiments were conducted only once. This
means that results reported and subsequent conclusions have not been statistically reproduced.
Biased observation could occur to one set of experiments, so it is imperative that these experiments
be redone in the future before submitting our work for peer-review publication. It should be noted
that since the iodide chemical ionization high-resolution time-of-flight mass spectrometer (Iodide
CIMS) to detect low-vapor oxidation products was not available, and we were not able to correct
SOA yields with losses of low-volatility products to chamber walls. This will be a focus of future
work.
The observed percent contribution of peroxides to total SOA mass were over 100. This
suggests that the mass used to quantify the peroxides (300 g/mol) was too high. Future analysis of
peroxides at the molecular level using mass spectrometry will be done to determine the correct
molecular weight to use in the quantification of peroxides.
19 The research presented in this report provides insight into the production of SOA from
MBO ozonolysis under different environmental conditions. The MBO SOA formation data from
“pure” ozonolysis experiments (OH scavenger molecules present) was compared to the MBO SOA
formation data obtained from experiments in the presence of OH radicals (no OH scavenger
molecules present) in order to see which of the two pathways dominated the particle-phase
chemistry. The production of SOA from nucleation was also observed in these experiments. It
appears from our data that OH-initiated oxidation of MBO enhances the amount of SOA produced,
as well as the amount of the major SOA tracers (DHIP, 2-methyleryhtriol, and the MBO-derived
organosulfate at m/z 199). In addition, OH-initiated oxidation of MBO also appears to favor the
formation of new particles through nucleation of very low-volatile vapors produced from this
reaction.
The results from these experiments has granted insight into the mechanism behind MBO
ozonolysis. It was observed that acidity led to the increase of most of the tracer compounds. The
presence of 2-methylerythritol indicates the potential for complex chemistry to be occurring in the
gas phase. Additionally, the experiments have provided evidence to suggest that OH radical
oxidation may contribute more to the formation of tracer compounds than ozonolysis and that the
SOA contribution of nucleation is sufficiently large to warrant further investigation. Furthermore,
higher RH experiments may also provide important information about organic peroxide formation.
Recent work by Li et al.12 states that 18% of the gaseous peroxides are adsorbed onto SOA
particles in the presence of increased water vapor. Since 82% of the peroxides stay in the gas phase
it is important that gas-phase experiments be done for both low- and high-RH experiments to
examine what proportion of SOA mass comes from peroxides and to characterize the peroxides
20 be needed to correct our reported SOA yields for losses of low-volatility products to chamber wall
surfaces. This will also be a focus of future work before publication is considered.
21 1) Hallquist, M., Wenger, J. C., Baltensperger, U., Rudich, Y., Simpson, D., Claeys, M., Dommen, J., Donahue, N. M., George, C., Goldstein, A. H., Hamilton, J. F., Herrmann, H., Hoffmann, T., Iinuma, Y., Jang, M., Jenkin, M. E., Jimenez, J. L., KiendlerScharr, A., Maenhaut, W., McFiggans, G., Mentel, T. F., Monod, A., Prevot, A. S. H., Seinfeld, J. H., Surratt, J. D., Szmigielski, R., and Wildt, J. (2009). The formation, properties and impact of secondary organic aerosol: current and emerging issues, Atmos. Chem. Phys., 9(14), 5155– 5236.
2) Song, C., Zaveri, R. A., Alexander, M. L., Thornton, J. A., Madronich, S., Ortega, J. V., Zelenyuk, A., Yu, X. Y., Laskin, A., Maughan, D. A. (2007). Effect of hydrophobic primary organic aerosols on secondary organic aerosol formation from ozonolysis of α -pinene. Geophys. Res. Lett. Geophysical Research Letters., 34(20).
3) Pope CA III., Ezzati M., Dockery D. W. (2009). Fine-particulate air pollution and life expectancy in the United States. N Engl J Med., 360(4), 376-386.
4) Seaton, A., Godden, D., Macnee, W., & Donaldson, K. (1995). Particulate air pollution and acute health effects. The Lancet.345(8943), 176-178.
5) Charlson, R. J., Schwartz, S. E., Hales, J. M., Cess, R. D., Coakley, J. A., Jr., Hansen, J. E., Hofmann, D. J. (1992). Climate Forcing by Anthropogenic Aerosols. Science.255. 423-430. 6) IPCC, 2013: Climate Change 2013: The Physical Science Basis. Contribution of Working
Group I to the Fifth Assessment Report of the Intergovernmental Panel on Climate Change [Stocker, T.F., D. Qin, G.-K. Plattner, M. Tignor, S.K. Allen, J. Boschung, A. Nauels, Y. Xia, V. Bex and P.M. Midgley (eds.)]. Cambridge University Press, Cambridge, United Kingdom and New York, NY, USA. 571-657.
7) Glasius, M., & Goldstein, A. H. (2016). Recent Discoveries and Future Challenges in Atmospheric Organic Chemistry. Environmental Science & Technology Environ. Sci. Technol. 8) Jaoui, M., Kleindienst, T. E., Offenberg, J. H., Lewandowski, M., & Lonneman, W. A. (2011).
SOA formation from the atmospheric oxidation of 2-methyl-3-buten-2-ol and its implications for PM2.5. Atmospheric Chemistry and Physics Discussions Atmos. Chem. Phys. Discuss.,11(8), 24043-24083.
9) Carrasco, N., Doussin, J. F., O’Connor, M., Wenger, J. C., Picquet-Varrault, B., Durand-Jolibois, R., Carlier, P. (2006). Simulation Chamber Studies of the Atmospheric Oxidation of 2-Methyl-3-Buten-2-ol: Reaction with Hydroxyl Radicals and Ozone Under a Variety of Conditions. Journal of Atmospheric Chemistry J Atmos Chem.56(1), 33-55.
10)Zhang, H., Worton, D. R., Lewandowski, M., Ortega, J., Rubitschun, C. L., Park, J.-H., Kristensen, K., Campuzano-Jost, P., Day, D. A., Jimenez, J. L., Jaoui, M., Offenberg, J. H., Kleindienst, T. E., Gilman, J., Kuster, W. C., de Gouw, J., Park, C., Schade, G. W., Frossard, A. A., Russell, L., Kaser, L., Jud, W., Hansel, A., Cappellin, L., Karl, T., Glasius, M., Guenther, A., Goldstein, A. H., Seinfeld, J. H., Gold, A., Kamens, R. M., and Surratt, J. D. Organosulfates as Tracers for Secondary Organic Aerosol (SOA) Formation from 2-Methyl-3-Buten-2-ol (MBO) in the Atmosphere, Environ. Sci. Technol., 46, 9437– 9446, doi:10.1021/es301648z, 2012a.
23 Table 1. Summary of experimental conditions, SOA growth concentrations, SOA yields, and concentrations of major MBO-derived SOA constituents.
Expt.
# Seed [OH-svg.]o
[MBO]o
[O3]o
Max SOA Growth
SOA
Yield DHIP
2-Me Erythritol
MBO OS at
m/z 199
ppmv ppbv ppbv µg/m3 % µg/m3 µg/m3 µg/m3
1 Acidic - 250 361 3.36 0.73 0.15 0.33 0.05
2 Acidic - 449 512 19.29 2.73 0.53 0.38 0.12
3 Acidic - 451 903 26.16 2.92 2.37 1.52 0.12
4 Acidic 60 440 798 11.20 1.36 0.05 0.22 0.02
5 Neutral - 431 800 25.82 2.23 3.01 0.36 0.02
6 Neutral 60 421 793 12.02 1.18 0.09 0.06 0.01
7 - - 462 815 23.63 1.89 14.91 0.39 0.00
8 - 60 436 850 5.22 0.47 0.13 0.03 0.00
9 Acidic - 485 795 31.81 3.94 1.72 0.37 0.22
10 Acidic 60 449 880 16.82 1.94 0.02 0.35 0.05
Max SOA Growth is the maximum net SOA growth after correction for wall loss and density of aerosol particles.
DHIP is the abbreviation for 2,3-dihydroxyisopentanol. OS is the abbreviation for organosulfate.
Experiment Number
Description Peroxides in (µg/m3)
Percent Contribution to Total SOA Mass (%
8 No seed, Scavenger 17.05 327
9 Acidified seed 50.71 159
10 Acidified, Scavenger 20.29 121
24 Figure 1. Structure of 2-methyl-3-buten-2-ol
Figure 2. Structure of 2-hydroxy-methylpropanal
Figure 3. 2,3-dihydroxyisopentanol
26 Figure 6. SOA growth values in µg/m3 and associated SOA yield values. Red bars indicate experiments involving acidic sulfate aerosol particles, and blue bars indicate neutral sulfate aerosol experiments. Grey bars indicate seedless (or nucleation) experiments. The slashed colored bars indicate experiments that used OH scavenger.
0.0% 0.5% 1.0% 1.5% 2.0% 2.5% 3.0% 3.5% 4.0% 4.5% 0.00 5.00 10.00 15.00 20.00 25.00 30.00 35.00
1 2 3 9 4 10 5 6 7 8
SOA Y ie ld (% ) SOA Fo rm at ion (u g/m 3)
SOA Formation and Yield
27 Figure 7. Quantification of MBO-derived SOA constituents.
3.01 0.00 0.05 0.10 0.15 0.20 0.25 0.0 0.5 1.0 1.5 2.0 2.5 3.0 3.5
1 2 3 9 4 10 5 6 7 8
MBO OS (u g/m 3) DHI P an d 2 -Me Ery th rito l (u g/m 3)