Variations in Performance and Scalability when
Migrating n-Tier Applications to Different Clouds
Deepal Jayasinghe, Simon Malkowski, Qingyang Wang, Jack Li, Pengcheng Xiong, and Calton Pu. Center for Experimental Research in Computer Systems, Georgia Institute of Technology
266 Ferst Drive, Atlanta, GA 30332-0765, USA. {deepal, zmon, qywang, jyl, pxiong3, calton}@cc.gatech.edu
Abstract—The increasing popularity of computing clouds con-tinues to drive both industry and research to provide answers to a large variety of new and challenging questions. We aim to answer some of these questions by evaluating performance and scalability when an n-tier application is migrated from a traditional datacenter environment to an IaaS cloud. We used a representative n-tier macro-benchmark (RUBBoS) and compared its performance and scalability in three different testbeds: Amazon EC2, Open Cirrus (an open scientific research cloud), and Emulab (academic research testbed). Interestingly, we found that the best-performing configuration in Emulab can become the worst-performing configuration in EC2. Sub-sequently, we identified the bottleneck components, high context switch overhead and network driver processing overhead, to be at the system level. These overhead problems were confirmed at a finer granularity through micro-benchmark experiments that measure component performance directly. We describe concrete alternative approaches as practical solutions for resolving these problems.
Keywords-Benchmarking, Clouds, Datacenter, EC2, Emulab, IaaS, n-Tier, Open Cirrus, Performance, RUBBoS, Scalability.
I. INTRODUCTION
The flexibility and scalability of commercial cloud infrastruc-tures make them an attractive application migration target; however, due to the associated complexity, it is difficult to make newly migrated applications run efficiently in clouds. For example, while clouds are good candidates for supplemen-tary system platforms during occasional overload of Internet applications (e.g., electronic commerce), reports on Amazon EC2 consistently mention that network latency may affect overall system performance considerably [26], [28], [31]. Such issues are compounded by dependencies among system components as requests are passed among the tiers, which are characteristic of real n-tier applications. Despite some published best-practices for the popular cloud environments (e.g., [9]), the tradeoff between guaranteed performance (e.g., bounded response time) and economical efficiency (e.g., high utilization for sustained loads) remains a serious challenge for mission-critical applications.
In this paper we analyze the performance and scalability when migrating n-tier applications from a traditional datacen-ter to an Infrastructure as a Service (IaaS) cloud. We use a representative n-tier macro-benchmark application (RUB-BoS [7]) and perform a large-scale experimental study on three testbeds. We use Emulab [4] (a more traditional compute cluster environment) as our reference testbed and compare the
performance and scalability characteristics to Open Cirrus (a scientific research cloud with high isolation) and to Amazon EC2 [8] (a popular commercial cloud). Our experiments cover scale-out scenarios under varying hardware and software con-figurations with up to 44 concurrent servers. These RUBBoS experiments are generated and executed automatically using the Elba toolkit [1], [21], [23]. Concretely, we use automated experiment management tools, which set-up, execute, monitor, and analyze large-scale application deployment scenarios. For the detailed analysis of non-trivial performance issues and system bottlenecks, we use micro-benchmarks (both standard and custom) to zoom into individual system components and confirm our initial hypotheses at finer granularity.
In the course of our analysis, we found that configurations that work well in one environment may cause significant performance problems when deployed in a different cloud. In fact, we found that the best-performing RUBBoS configuration in Emulab can become the worst-performing configuration in EC2 due to a combination of factors. These factors such as net-work driver overhead and thread context-switching overhead are often subtle and not directly controllable by users. We provide a set of candidate solutions to overcome the observed performance problems. More generally, this study shows that clouds are a relatively immature technology and significantly more experimental analysis will be necessary in order for public clouds to become truly suitability for mission-critical applications.
The remainder of this paper is structured as follows. Sec-tion II provides an overview of the benchmark applicaSec-tion, the experimental setup, and the tools used during the experiments. In Section III we analyze performance and scalability in the three platforms. In Section IV we discuss the performance impact associate with multithreading, and Section V provides results on network overhead. Related work is summarized in Section VI, and Section VII concludes the paper.
II. EXPERIMENTALSETTING
In this section we discuss our experimental approach. Sec-tion II-A introduces our experiment procedure and automated framework. In Section II-B and Section II-C we provide a brief overview for macro-benchmark application and MySQL cluster respectively, and in Section II-D we present our exper-imental infrastructure, tools, and notations.
A. Experimental Automated Framework
To enable experimental research at the scale of thousands of experiments, we created a set of software tools in the Elba project [1] [21] [23] to automate the process of setting-up, executing, and monitoring an experiment in addition to the logging of results and statistical analysis.
Our experimental cycle with Elba tools consists of three stages, and each stage consists of a number of sub-steps. For each new target platform (e.g., EC2), we start with the current Elba code generation templates, which have been successfully used in previous experiments and environments (e.g., Emulab). In the first stage, we enhance our code generator input template with the API specifications of the new hardware and software platform on which experiments are run. The last step of stage one uses the templates to generate the scripts that will create and execute the experiments.
In the second stage, the first step runs the initialization scripts to set up the experimental environment. These scripts take into account the dependencies among the system com-ponents, including hardware and hypervisor (usually invariant through the experiments), operating system configuration, and server configurations such as the database load on the database server. In the second step, we run the planned experiments ac-cording to the availability of hardware resources. For example, we usually run the experiments by increasing the workload. For each workload, we run the easily scalable (browse only) scenario first, followed by read/write scenarios. To minimize cache inter-dependencies across experiments, after each batch of experiments, we finish the data collection, ramp-down the system, stops all servers, and start the next batch with sufficient ramp-up time. The iterations continue until all the experiments are finished.
The third stage consists of data analysis. In the first step of this stage, we copy all the collected data from the experimental environment to our data warehouse for analysis. In the second step, we run a number of statistical tools to analyze application behavior. If performance limitations are found, we run tools such as intervention and correlation analysis to find resource bottlenecks, including multi-bottlenecks where dependencies link multiple resources that limit their utilization. Sometimes additional data is needed, either due to data quality problems (e.g., interference during an experiment) or for a more refined analysis (e.g., previous uncovered configuration settings).
B. Macro-benchmark Application
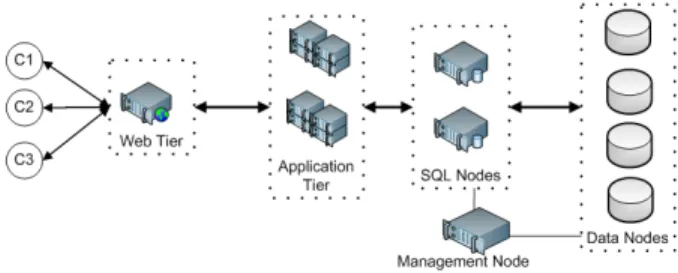
RUBBoS [7] is an n-tier electronic commerce system modeled on bulletin board news sites such as Slashdot, and it is widely used in large scale experiment studies. We modified the benchmark to suite for our experiment workloads and to collect various statistics. The workload consists of 24 different interactions such as register user, view story and post comments. The benchmark can be deployed as a three-tier or four-tier system and places a high load on the database tier. A typical RUBBoS deployment with MySQL cluster is shown in Figure 1. Also, benchmark includes two kinds of workload modes: browse-only and read/write interaction mixes. We have
Fig. 1. A typical RUBBoS deployment with MySQL Cluster TABLE I
HARDWARE CONFIGURATIONS IN THREE TESTBEDS. Platform Type Processor Memory Arch Amazon EC2 Small 1 EC2 Compute Unit 1.7 GB 32-bit
Large 4 EC2 Compute Units 7.5 GB 64-bit Ex Large 8 EC2 Compute Units 15 GB 64-bit Cluster 33.5 EC2 Compute Units 23 GB 64-bit
Emulab PC3000 3GHz 2 GB 64-bit
Open Cirrus X3210 3.00GHz (Quad Core) 4 GB 64-bit
limited our discussion to browse-only workloads in this paper mainly due to the space constraints.
C. MySQL Cluster
MySQL Cluster [2] is an open source transactional database designed for scalable high performance access to data through both data partitioning and data replication. In our experiment we used an “in-memory” version of MySQL Cluster and the NDBCLUSTER storage engine. MySQL Cluster is imple-mented by a combination of three types of nodes (Management nodes, SQL nodes and Data nodes). A Management node maintains the configuration of SQL nodes and Data nodes, plus starting and stopping of those nodes. A Data node stores cluster data. And an SQL node is the clustering middleware that handles the internal data routing for partitioning, and consistency among replicas for replication. Figure 1 illustrates three types of nodes and how they are connected. The total number of Data nodes is the product of the replication factor and the number of partitions. For example, with replication factor of 2 and database divided into 2 partitions, the resulting MySQL Cluster will have four Data nodes.
D. Overview of Experiments
The experiments discussed in this paper were run in three testbeds (i.e., Emulab [4], EC2 and Open Cirrus). Table I shows the server types we used in three platforms (EC2 Compute Unit provides the equivalent CPU capacity of a 1.0– 1.2 GHz 2007 Xeon processor). We evaluated both horizontal and vertical scalability on EC2, in contrast we limited our analysis only to horizontal scalability in Emulab and Open Cirrus. By horizontal scalability we mean the increase of the number of nodes in the application (e.g., from 12 large instances to 16 large instances), and by vertical scalability we mean the same number of nodes but with better hardware settings (e.g., from 12 large instances to 12 ex-large instances). The nodes were connected over 1GB Ethernet in Emulab, Infiniband in Open Cirrus, and for EC2 the connection types
were not exposed. To focus this study on the differences among three platforms, we allocated each server to a dedicated physical node. Specifically, the sharing of physical resources (e.g., CPU) in a node is among the threads within each server, not between servers. For each concrete hardware configuration we observed the most appropriate software configuration (e.g., number of threads and thread pool sizes) by using the approach mentioned in our previous work [34].
Each of our macro-benchmark experiment trials consisted of three periods: 8-minute ramp-up, a 12-minute run period, and a 30-second ramp-down. Performance measurements (e.g., CPU or network bandwidth utilization) were taken during the Run period using lightweight system monitoring utilities (e.g., dstat andsar) with a granularity of one second.
While the macro-benchmark data gave us the interesting bottleneck phenomena described in this paper, we often need more detailed data to confirm concrete hypotheses on the non-trivial causes of such phenomena. We have used both existing tools and custom tools to obtain such micro scale data. We employed a number of hardware monitoring and soft resource monitoring tools such as LMBench [5] and NetPipe [6].
Notation:We use a notation #A-#T-#M-#D-ppp to represent each concrete configuration. #A denotes the no. of Web servers, #T for no. of Tomcat servers, #M for no. of SQL nodes and #D for no. of Data nodes in the experiment. A short string (ppp) denotes the platform (ec2 for EC2, em for Emulab, and ocfor Open Cirrus). For example, Figure 1 shows a 1-2-2-4-em configuration with 1 Web server, 2 Tomcat servers, 2 SQL nodes and 4 data nodes in Emulab. In EC2 we add the instance (node) type at the end (small, large, exlarge, or cluster).
III. CLOUDCOMPARISON
In this section we present our experimental results. In Sec-tion III-A we present performance and scalability charac-teristics on reference platforms (i.e., Emulab) and compare it with Open Cirrus, and Section III-B provides scalability characteristics and performance issues on EC2.
A. Performance on Reference Platforms
To compare and contrast the performance complications of commercial clouds against other alternative platforms it is essential to have a good reference, Emulab and Open Cirrus were used for this purpose. Methodically, we start with the smallest possible configuration and then gradually scale up based on the observed results.
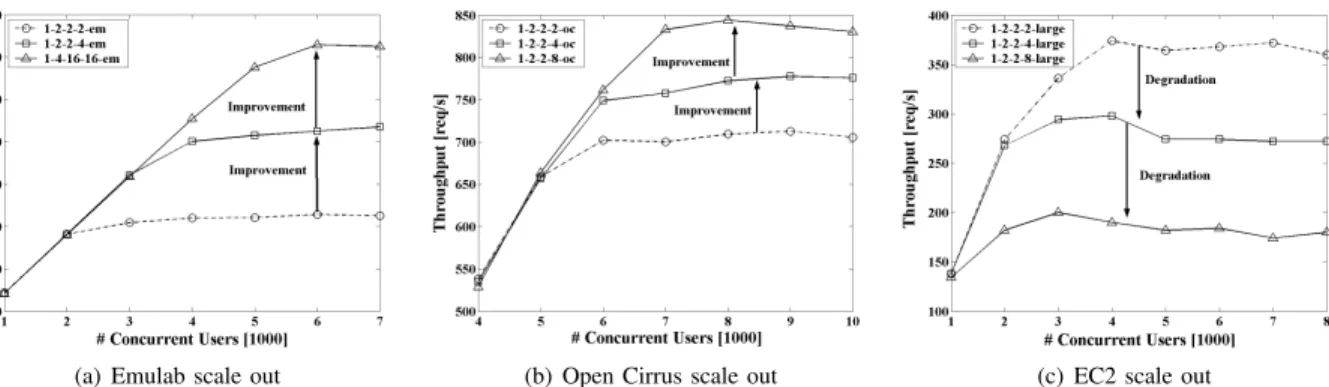
More concretely, we started on Emulab with1-2-2-2-em configuration; the configuration consists of two SQL nodes and two Data nodes, and we performed experiments from 1000 to 10,000 workloads (i.e., concurrent clients) with 1000 workload increments. Each client runs as a separate thread and generates HTTP request using an exponential distribution with average think time of 7s. As shown in Figure 2(a), for 1-2-2-2-emconfiguration throughput saturated at 3000 workloads. Detailed analysis of monitoring data shows that SQL node CPU utilization had become the bottleneck (see
Figure 3(a)). To resolve it, we scale-up our experiment and introduce two additional Data nodes (1-2-2-4-em configu-ration) by partitioning the database into two groups. Running experiments with 4 Data nodes and 2 SQL nodes, we observed that knee point shifted from 3000 to 5000. Next, we increased the number of SQL nodes to 4 to get 1-2-4-4-em configu-ration, likewise we continued this scaling-up process until we resolved the hardware bottleneck. Through our analysis we found1-4-16-16-emas the smallest configuration which can sustain our workload without system hardware resources being bottlenecked (software resource started to saturate [34]). Notably, as shown in Figure 2(a) our benchmark application scales well on Emulab.
To better explain the observed performance charac-teristics on Emulab we have provided CPU utilizations for 1-2-2-2-em and 1-2-2-4-em configurations, Fig-ure 3(a), 3(b) and 3(c) illustrate the CPU utilization in the Tomcat Server, the SQL nodes and the Data nodes respectively. As shown in the Figure 3(b), for both configurations SQL node CPU has become the bottleneck, and as a result we have a flat curve for throughput values (see Figure 2(a)).
We used the same methodology and performed a similar set of experiments on Open Cirrus cloud. We achieved compara-tively higher throughput values, and more importantly, Open Cirrus shows much better scalability. Due to space limitations we have only provided the observed throughput values (see Figure 2(b)). Notably, in Open Cirrus we observed very low resource utilization (e.g., less than 30% CPU utilization), thus, we have omitted utilization graphs.
Our analysis on two reference platforms illustrated better application scalability. More specifically, we did not observe any performance degradation when migrating n-tier applica-tion from a tradiapplica-tional datacenter to an IaaS cloud.
B. Amazon EC2 Performance
1) Horizontal Scale-Out (same nodes): We used the same methodology as in Section III-A, and performed a similar set of experiments in EC2. We kept as many experimental parameters untouched as possible (except platform specific parameters). Our initial expectation was to achieve better or similar results to those from Emulab since we used better hardware in EC2. Surprisingly, our assumptions were shown to be wrong when we observed quite different behavior in EC2. As shown in Figure 2(a) and (b) benchmark application scales well on both Emulab and Open Cirrus, increasing the number of Data nodes gives better performance; however, in EC2 increasing the number of Data nodes reduces the performance. As shown in Figure 2(c) scaling from 1-2-2-2-large to 1-2-2-4-large significantly reduced the throughput and moving from 1-2-2-4-large to 1-2-2-8-large further reduces the throughput. More specifically, the scalable application on Emulab and Open Cirrus shows poor scalability on EC2.
Our analysis of system monitoring data in EC2 shows interesting results. Figure 3(a), 3(b) and 3(c) illustrate CPU utilization for both Emulab and EC2. As we have already
(a) Emulab scale out (b) Open Cirrus scale out (c) EC2 scale out
Fig. 2. Horizontal scalability (same node type) analysis with heterogeneous throughput performance characteristics for three testbeds.
(a) Tomcat CPU (b) SQL CPU (c) Data node CPU
Fig. 3. Average CPU utilization for1-2-2-2and1-2-2-4configurations for Emulab and EC2. discussed, in Emulab the key limiting factor was CPU
con-sumption (mostly saturated). Scaling up and down causes a CPU bottleneck shift from one tier to another or a concurrent bottleneck phenomenon in several tiers, however in EC2 we observed a completely different utilization pattern and found that all the server types have very low CPU utilization.
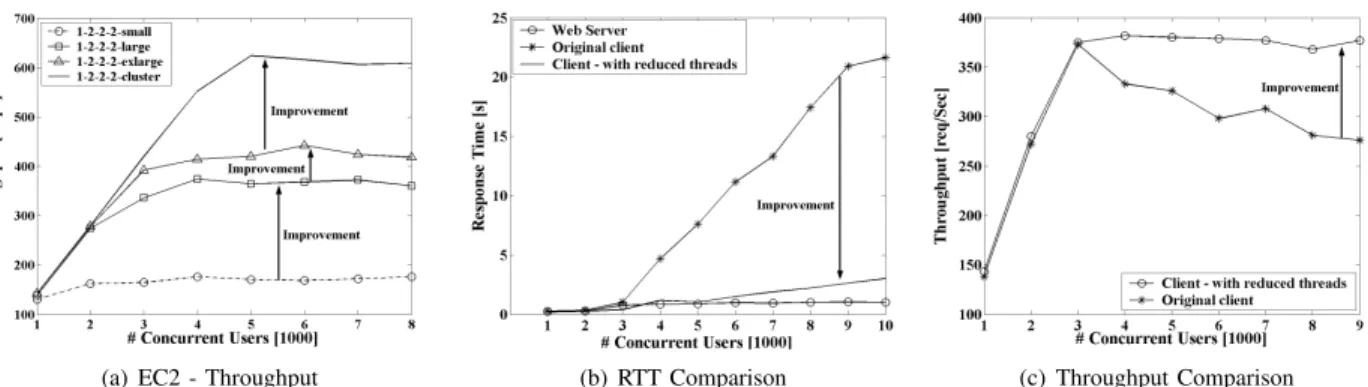
2) Vertical Scalability (different nodes): Here we present our analysis results for vertical scalability on EC2. We started our analysis with 1-2-2-2-ec2on small instances (similar hardware configurations as the PC3000s on Emulab) and observed very poor performance (as compared to EC2’s hori-zontal scalability), our results are shown in Figure 4(a). Node level data analysis revealed that for small instances, the Data node has considerably different CPU and I/O characteristics compared to that of large instances. There are two main reasons causing this issue: first, as Guohui et al. [28] described, small instances always get 40% to 50% of the physical CPU sharing, and second, differences in memory configurations (Table I(b)). According to MySQL cluster documentation, small instances does not have sufficent memory to keep the complete database in memory, thus, it needs to use virtual memory. As a pratical solution to this problem, we moved to large instances and followed the same procedure; likewise, we continued our process for the other EC2 instance types. As shown in Figure 4(a), EC2 shows good vertical scalability as compared to its horizontal scalability. As illustrated in the figure we achieved the highest throughput with cluster instances (cluster instances are the most powerful instances available at the time we perform our experiments). In addition, for 1-2-2-2-cluster we used software colocation, and
used only two cluster instances. In our colocation we deployed two sets of 1-Tomcat, 1-SQL node, and 1-Data node in a single cluster instance (i.e., total of two nodes).
The representative benchmark shows better horizontal scal-ability on Emulab and Open Cirrus, better vertical scalscal-ability on EC2, and in contrast poor horizontal scalability on EC2. As illustrated in Figure 3(a), (b) and (c), the EC2 performance degradation was not caused by CPU utilization. For our exper-iments, we collected over 24 types of monitoring data (e.g., CPU, Memory, Disk read/write, network read/write, context switches, interrupts), and thus, we extended our analysis on other monitoring data and micro-benchmarks. We observed two key issues: overhead associated with concurrent threads (e.g., context switching and scheduling overhead) and network driver overhead (e.g., latency and queuing delays).
IV. MULTITHREADINGCOSTS INEC2
Here we present multithreading overhead analysis for EC2. We discuss observed application instability due to an increased number of threads, in Section IV-A we quantify context switching overhead, and Section IV-B shows how to redesign the application to guard against the multithreading issues.
Multi-tier systems are inherently difficult to analyze due to complex dependencies of the system. As previously discussed (see Section III-B), the benchmark application saturated in EC2 due to effects of initially hidden resources utilization. Consequently, we extended our systematic analysis with de-tailed micro level analysis. Subsequently, we observed an in-teresting phenomenon when using multithreading applications on EC2. To illustrate, we selected a RUBBoS client workload
(a) EC2 - Throughput (b) RTT Comparison (c) Throughput Comparison
Fig. 4. Detailed EC2 Throughput and RTT analysis: (a) Vertical Scalability (Scales well); (b) RTT comparison of Apache, Client, and Client with reduced threads; (c) Throughput—before and after reducing thread overhead.
generator and measured the round trip time (RTT) for each request when increasing the number of concurrent threads. We observed a sudden increase in RTT when the number of threads increases. Typically, these types of observations lead to assume server saturation; despite this, we observed the issue to be caused by instability at the client.
To further illustrate the observed phenomena we used RUBBoS application and logged the response time for each individual request at the client nodes and the Apache web server. Next, we used these two logs and calculated average RTT separately. The results are shown in Figure 4(b). For higher workloads, the calculated RTT using client logs differs significantly from the Apache logs. In contrast, for lower workloads, the RTT difference is negligible (e.g., RTT for workloads less than 3000). Figure 4(b) illustrates how work-load increases (i.e., number of concurrent threads) causes the recording of larger and inaccurate RTTs at the client. Using micro-benchmark studies we observed that the recorded RTT difference is largely due to I/O intensive thread dispatching overheads, which leads to the unstable behavior in the client.
A. Context Switching Overhead
To further analyze the previously observed phenomenon we used LMbench [5]. We started with the default settings of LMbench and performed all supported tests on Emulab and EC2. We found surprising results for context switching overhead. It recorded the context switching overhead in EC2 to be twice as high as in Emulab. Figure 5(a) shows time for a single switch when varying the number of threads. As generally accepted, measuring context switching time with high accuracy is a difficult task. Nevertheless, analysis shows that for a few number of threads (<40) EC2 takes less time for a switch compared to Emulab; in contrast, with a greater number of threads, EC2 takes considerably longer time.
In our benchmark, the client is configured to have more than 250 concurrent threads; therefore, context switching becomes a key issue. To illustrate the importance of this issue, we cal-culated the average number of context switches when running the benchmark application. Figure 5(b) shows the calculated averages for both EC2 and Emulab. As shown in the figure Emulab has a significantly higher number of context switches compared to that of EC2. Moreover, combining Figure 2(a), (c)
and Figure 5(b) we can observe a close relationship between EC2 throughput and the number of context switches.
To analyze context switching overhead from the resource perspective, we calculated the overhead as CPU percentages. In our experiments we measured the number of switches per second (see Figure 5(b)), using LMBench we approximated the time for a single context switch (against no. of threads), and finally combining the two values we estimated the con-text switching overhead for an experiment cycle. Figure 5(c) illustrates the calculated overhead. As shown in the figure, for the workloads which are higher than 3000, context switching uses 10% of the CPU resources for both Emulab and EC2. Note that the overhead is much more significant in EC2, because the number of context switches and the throughput are significantly lower while having similar overhead.
B. Proposed Alternative Approach
We experimentally showed how multithreading can affect ap-plication performance in cloud environments. Here we propose how to redesign the application to resolve the observed issues. First, the most trivial solution in commercial clouds is to rent more nodes so that each gets a lower number of users (threads). This approach helps to reduce the overhead caused by concurrent threads (see Section IV-A), and eventually brings the application into a stable state. While this solution is acceptable for occasional users that run an application only a few times, for long term users who run their applications often or continuously, this is not a viable option mainly due to the associated renting cost.
Second, overhead can be reduced by reducing the number of threads and increasing the amount of work done by a single thread. For example, we redesigned RUBBoS workload gen-erator to generate 7 times more messages (with same number of threads) by reducing the average client think time (e.g., reducing think time from 7s to 1s). This code-level change is analogous to loop-unrolling. Our solutions show significant improvements, both in RTT (Figure 4(b)) and throughputs (Figure 4(c)). We confirmed our hypothesis by calculating the average response time using Apache logs and the clients’ logs. With the thread reduction, the recorded response time at a client is much closer to that of the Apache logs. The remaining difference can be explained with the queuing effects
(a) Time per a switch (measured by LMBench) (b) Context switches per second (c) Fraction of CPU spent on switching Fig. 5. Comparative context switching analysis for Emulab and EC2.
that naturally take place between the two tiers. While this solution is practical in many cases, it depends on the nature of the application whether the desired concurrency level can still be reached in this manner.
V. NETWORKDRIVEROVERHEAD
We increased the number of client nodes to 10 and resolved the client issue, and subsequently shifted the bottleneck to the back-end. In Section V-A we show the network traffic increase through database partitioning and subsequent network transmission overhead on EC2. In Section V-B we provide our solutions to achieve higher performance in production clouds.
A. Network Driver Overhead
We extended our analysis to the network layer, and our results revealed two important findings. First, increasing the number of Data nodes (partitioning the database) caused a significant increase in the network traffic generated at the Data nodes. Second, we observed significantly higher transmission queue sizes for EC2 compared to that of Emulab. We observed that moving from 2 Data nodes to 4 Data nodes doubles the network traffic. Nevertheless, for 1-2-2-2configuration both Emulab and EC2 shows similar network traffic patterns, and also somewhat similar throughput values. However, for 1-2-2-4 shows different behaviors both in network traffic and throughput (Figure 2(a) and (c)).
We selected the 1-2-2-4-em for Emulab and the 1-2-2-4-large for EC2 and used our network analysis tools to observe network behavior. Through our data, we observed a surprising behavior in the Data node server. As shown in Figure 6(a), we observed that the sending queue size (at the network layer) of the Data node in EC2 is much higher than in Emulab. In contrast, the receiving sides of both EC2 and Emulab show similar characteristic, and both have negligible queue sizes.
In our benchmark, the Data node is the first server which starts to generate a large amount of data in the request prop-agation chain. Initially, users send a HTTP request to Apache HTTPd, and then it forwards request to Tomcat. Tomcat processes the request and generates SQL statements that are sent to the SQL servers. The SQL servers send the query to the Data nodes, which then processes those queries and generates
results. In this process, especially in the read-only scenario, the message sizes of generated output are significantly higher than the incoming message. Therefore, when the message rate is high, the Data node generates more data. However, when there is a problem at the transmitting side, the Data node cannot send the data as required, which then results in a long queue at the network buffers. Next, in the other tiers (e.g., Tomcat and Apache HTTPd), the connections start to wait as well. Therefore, the overall message transmission rate reduces. Eventually this behavior affects the entire system performance. To further analyze observed hypothesis we used Net-PIPE [6] and measured the achievable bandwidth. NetNet-PIPE is a protocol-independent performance tool that visually represents the network performance under a variety of conditions. Our results show that the two systems have similar bandwidth, thus, confirming that the sending buffer issue is not caused by network bandwidth.
We then used theUnix Pingprogram and measured the RTT between the two Data nodes in two environments. First, we evaluated ping RTT without generating any application load, thus, makingpingprogram the only process. Second, we evaluated RTT while generating representative application load. We observed the following very interesting behavior. When there is no load EC2 shows significantly less RTT compared (approximately 20 times less) to Emulab (see Fig-ure 6(b)). In contrast, when populating the database, EC2 shows very large RTT that varies between 0.4 ms to 30ms (see Figure 6(c)), but Emulab shows more similar results for both cases (average of 0.2 ms). This provides additional evidence to confirm network driver overhead on EC2 and potential performance degradation.
B. Proposed Alternative Approach
As we discussed in Section V, due to this network overhead, the scalable software system becomes not scalable in EC2. We experimentally evaluated ways to overcome this issue. In general, MySQL Cluster is a sophisticated but heavily used database middleware in industry. It has a number of advantages including availability, reliability, and scalability compared to simpler replication solutions. Unfortunately, due to higher network traffic generation of MySQL cluster, the complete application shows poor scalability.
(a) Data node sending queue length analysis (b) Ping RTT without load (EC2 is lower) (c) Ping RTT with load (Emulab is lower) Fig. 6. Analysis of network driver overhead and characteristics for Emulab and EC2.
(a) Throughput improvement (b) Database tier—total traffic Fig. 7. Performance comparison C-JDBC vs. MySQL Cluster. solution we used the C-JDBC [30] middleware and performed the same set of experiments as in Section III-A on EC2. The observed throughput values are shown in Figure 7(a). As shown in the figure C-JDBC shows very good scalability and achieves very high throughput. Next, we measured the amount of data generated at the database tier by the two approaches, and our results are shown in Figure 7(b). As demonstrated in the figure, C-JDBC generates a significantly smaller amount of data compared to MySQL Cluster. Consequently, the middle-ware results in lower pressure on the network, which causes better performance. In contrast, MySQL Cluster produced a large network traffic and higher pressure on the network driver.
VI. RELATEDWORK
Traditionally, performance analysis in IT systems builds mod-els based on expert knowledge and uses a small set of experimental data to parameterize them [15], [16], [33]. The most popular representative of such models is queuing theory. Queuing networks have been widely applied in many perfor-mance prediction methodologies [17], [18]. These approaches are often constrained because of their rigid assumptions when handling n-tier systems due to the complex dependencies. As an illustration of significant characteristics that are hard to capture with traditional analysis, consider the significance of context switching—as shown in this paper—towards system performance when a large number of threads is involved.
While the increasing popularity of cloud computing has spawned very interesting research on private and public clouds, to the best of our knowledge, no previous work has evaluated IaaS clouds using complex n-tier systems to find performance and scalability issues at all tiers. Jim et al. presented a method
for achieving optimization in clouds by using performance models in the development, deployment, and operation of applications that run in the cloud [10]. They illustrated the architecture of the cloud, the services offered by the cloud to support optimization, and the methodology used by developers to enable runtime optimization of the clouds. Thomas et al. analyzed the cloud for fundamental risks that may arise from sharing physical infrastructure between mutually distrustful users, even when their actions are isolated through machine virtualization [14]. Ward et al. discussed the issues and risk associated with migrating workloads to clouds, and the authors also proposed an automated framework for “smooth” migra-tion to cloud [25]. In contrast, we have studied the potential scalability and performance issues after migration.
Mayur et al. evaluated Amazon S3 as a black box and formulated recommendations for integrating S3 with science applications and for designing future storage utilities targeting this class of applications [13]. They discussed how costs can be reduced by exploiting data usage and application characteristics to improve performance and, more importantly, by introducing user managed collaborative caching in the system. Despite the apparent differences, this work has some important similarities to our work: first, both approaches evaluate commercial clouds; second, both papers use real applications and not simulations; third, both approaches derive recommendations to address the uncovered issues.
Guohui et al. have deeply analyzed the network overhead on EC2 and presented a quantitative study on end-to-end network performance among different EC2 instances [28]. Furthermore, Walker has presented a performance analysis and shown that a performance gap exists between performing HPC computations on a traditional scientific cluster and on an EC2 provisioned scientific clusters [26]. Similar to our findings, his experiments also revealed the network as one of the key overhead sources.
As part of our analysis, we have shown the significance of virtualization and associated network overhead. Padma et al. have looked at both the transmit and receive aspects of this workload. Concretely, they analyzed virtualization overheads and found that in both cases (i.e., transmit and receive) the limitations of VM scaling are due to dom0 bottlenecks for servicing interrupts [3]. Koh et al. also analyzed the I/O overhead caused by virtualization and proposed an outsourcing
approach to improve the performance [27]. VII. CONCLUSION
In this paper we presented an experimental analysis of perfor-mance and scalability when n-tier applications are migrated to IaaS clouds. We employed the RUBBoS benchmark to measure the performance on Emulab, Open Cirus, and EC2. Especially the comparison of EC2 and Emulab yielded some surprising results. In fact, the best-performing configuration in Emulab became the worst-performing configuration in EC2 due to a combination of several factors. Moreover, in EC2 the network sending buffers limited the overall system performance. For computation of intransitive workloads, a higher number of concurrent threads performed better in EC2 while for network based workloads, high threading numbers in EC2 showed a significantly lower performance. Our data also exemplified the significance of context switching overheads. We provided a set of suitable candidate solutions to overcome the observed performance problems.
More generally, this work enhances the understanding of the risks and rewards when migrating n-tier application workloads into clouds and shows that clouds will require a variety of further experimental analysis to be fully understood and accepted as a mature technological alternative. In addition, experiment results show the neediness of refactoring n-tier applications before they are deployed on commercial clouds especially when one has to satisfy production SLAs.
VIII. ACKNOWLEDGMENT
This research has been partially funded by National Science Foundation by IUCRC, CyberTrust, CISE/CRI, and NetSE programs, National Institutes of Health grant U54 RR 024380-01, PHS Grant (UL1 RR025008, KL2 RR025009 or TL1 RR025010) from the Clinical and Translational Science Award program, National Center for Research Resources, and gifts, grants, or contracts from Wipro Technologies, Fujitsu Labs, Amazon Web Services in Education program, and Georgia Tech Foundation through the John P. Imlay, Jr. Chair endow-ment. Any opinions, findings, and conclusions or recommen-dations expressed in this material are those of the author(s) and do not necessarily reflect the views of the National Science Foundation or other funding agencies and companies mentioned above.
REFERENCES
[1] The Elba project. http://www.cc.gatech.edu/systems/projects/Elba/. [2] MySQL Cluster. http://www.mysql.com/products/database/cluster/. [3] P Apparao, S Makineni, D Newell. Characterization of network
processing overheads in Xen. InSecond International Workshop on VTDC 2006.
[4] Emulab - Network Emulation Testbed. http://www.emulab.net. [5] LMbench - Tools for performance analysis. http://www.bitmover.com/
lmbench/.
[6] NetPIPE - A Network Protocol Independent Performance Evaluator. http://www.scl.ameslab.gov/netpipe/.
[7] RUBBoS: Bulletin board benchmark. http://jmob.objectweb.org/rubbos. html.
[8] Amazon Elastic Compute Cloud EC2. http://aws.amazon.com/ec2/. [9] T. Economist. A special report on corporate it. http://www.economist.
com/specialReports/showsurvey.cfm?issue=20081025, October 2008.
[10] J. (Zhanwen) Li, J. Chinneck, M. Litoiu and G. Iszlai. Performance Model Driven QoS Guarantees and Optimization in Clouds. In
CLOUD’09, Vancouver, Canada, May, 2009.
[11] A. Lenk, M. Klems, J. Nimis, S. Tai, and T. Sandholm. What’s Inside the Cloud? An Architectural Map of the Cloud Landscape. InCLOUD’09. [12] Edward P. Holden, Jai W. Kang, Dianne P. Bills and M. Ilyassov. Databases in the Cloud: a Work in Progress. In SIGITE’09, Fairfax, Virginia, USA, October, 2009.
[13] M. Palankar, A. Iamnitchi, M. Ripeanu, and S. Garfinkel. Amazon S3 for Science Grids: a Viable Solution?. InDADC’08, Boston, USA. [14] T. Ristenpart, E. Tromer, H. Shacham, and S. Savage. Hey, You, Get Off
of My Cloud:Exploring Information Leakage in Third-Party Compute Clouds. InCCS’09, Chicago, USA, November, 2009.
[15] R. Jain.The art of computer systems performance analysis: techniques for Experimental design, measurement, simulation, and modeling. John Wiley & Sons, Inc., New York, NY, USA, 1991.
[16] D. J. Lilja. Measuring Computer Performance - A Practitioner’s Guide. Cambridge University Press, New York, NY, USA, 2000.
[17] C. Stewart and K. Shen. Performance modeling and system management for multi-component online services. InNSDI ’05.
[18] B. Urgaonkar, G. Pacifici, P. Shenoy, M. Spreitzer, and A. Tantawi. An analytical model for multi-tier internet services and its applications.
SIGMETRICS Perform. Eval. Rev., 33(1):291–302, 2005.
[19] I. Cohen, M. Goldszmidt, T. Kelly, J. Symons, and J. S. Chase. Correlating instrumentation data to system states: a building block for automated diagnosis and control. InOSDI’04.
[20] M. K. Aguilera, J. C. Mogul, J. L. Wiener, P. Reynolds, and A. Muthi-tacharoen. Performance debugging for distributed systems of black boxes. InSOSP ’03.
[21] G. Swint, G. Jung, C. Pu, A. Sahai. Automated Staging for Built-to-Order Application Systems. InNOMS 2006, Vancouver, Canada. [22] G. Swint, C. Pu, C. Consel, G. Jung, A. Sahai, W. Yan, Y. Koh, Q. Wu.
Clearwater - Extensible, Flexible, Modular Code Generation. InASE 2005.
[23] S. Akhil, C. Pu, G. Jung, Q. Wu, W. Yan, G. Swint. Towards Automated Deployment of Built-to-Order Systems. InDSOM 2005.
[24] M. Welsh, D. Culler, E. Brewer. SEDA: An Architecture for Well Conditioned, Scalable Internet Services. InSOSP18.
[25] C. Ward, N. Aravamudan, K. Bhattacharya, K. Cheng, R. Filepp, R. Kearney, B. Peterson, L. Shwartz. Workload Migration into Clouds Challenges, Experiences, Opportunities. InCLOUD2010.
[26] Edward Walker. Benchmarking Amazon EC2 for High Performance Scientific Computing. InUSENIX,;login, vol. 33(5), Oct 2008. [27] Y. Koh, C. Pu, Y. Shinjo, H. Eiraku, G. Saito, and D. Nobori. Improving
Virtualized Windows Network Performance by Delegating Network Processing. NCA 2009.
[28] Guohui Wang T. S. Eugene Ng. The Impact of Virtualization on Network Performance of Amazon EC2 Data Center. INFOCOM 2010. [29] M. Ronstrom, J. Oreland. Recovery Principles of MySQL Cluster 5.1.
VLDB 2005, Trondheim, Norway.
[30] E. Cecchet, J. Marguerite, and W. Zwaenepoel. C-jdbc: Flexible database clustering middleware. InIn Proceedings of the USENIX 2004 Annual Technical Conference, 2004.
[31] N. Yigitbasi, A. Iosup, S. Ostermann, and D.H.J. Epema. C-Meter: A Framework for Performance Analysis of Computing Clouds. InCloud 2009.
[32] Malkowski, S., Hedwig, M., Jayasinghe, D., Pu, C., and Neumann, D. CloudXplor: A tool for configuration planning in clouds based on empirical data. InACM SAC2010.
[33] K. Xiong, H. Perros. Service Performance and Analysis in Cloud Computing. InCLOUD2010.
[34] Q. Wang, S. Malkowski, D. Jayasinghe, P. Xiong, C. Pu, Y. Kanemasa, M. Kawaba, L. Harada. The Impact of Soft Resource Allocation on n-Tier Application Scalability. InIPDPS 2011.