R E S E A R C H
Open Access
Integrated analysis of differentially
expressed long noncoding RNAs and
mRNAs associated with high-fat
diet-induced hepatic insulin resistance in mice
Zengyuan Zhou
†, Xue Zhao
†, Liang Chen, Yuzheng Li, Zhao Chen, Yuanyuan Wang, Zihao Zhou and Xia Chu
*Abstract
Background:Hepatic insulin resistance (IR) is an early pathological characteristic of many metabolic diseases, such as type 2 diabetes. Long noncoding RNAs (lncRNAs) have been identified as mediators of IR and related diseases. However, the roles of lncRNAs in hepatic IR remain largely unknown.
Method:High-throughput sequencing was performed on ten liver tissue samples from five normal diet (ND)-fed mice and five high-fat diet (HFD)-induced hepatic IR mice, respectively. lncRNAs and mRNAs that were differentially expressed (DE) between the two groups were identified by bioinformatic analyses. Seven DE lncRNAs were validated by quantitative real-time PCR (q-PCR). The potential functions of the DE lncRNAs were predicted by Gene Ontology and Kyoto Encyclopedia of Genes and Genomes pathway analyses of target genes. In addition, integrated analysis was performed for the DE lncRNAs and mRNAs to predict their interaction relationships.
Results:A total of 232 DE lncRNAs were identified in the HFD-induced hepatic IR mice compared with the ND-fed mice. These DE lncRNAs included 108 upregulated and 124 downregulated lncRNAs, and 7 of the DE lncRNAs were validated by q-PCR. In addition, 291 DE mRNAs including 166 upregulated and 125 downregulated mRNAs were identified in the HFD group. Furthermore, target genes of the DE lncRNAs were predicted, and functional enrichment results showed that the enriched genes were involved in IR- and glycolipid metabolism-related processes. Additionally, the coexpression network was also constructed to further reflect the potential functions of the DE lncRNAs.
Conclusion:The study describes the expression profiles of lncRNAs and mRNAs and the functional networks involved in HFD-induced hepatic IR. These findings may provide a new perspective for the study of lncRNAs in hepatic IR- and glycolipid metabolism-related diseases.
Keywords:High-throughput sequencing, Long noncoding RNAs, Hepatic insulin resistance
© The Author(s). 2020Open AccessThis article is licensed under a Creative Commons Attribution 4.0 International License, which permits use, sharing, adaptation, distribution and reproduction in any medium or format, as long as you give appropriate credit to the original author(s) and the source, provide a link to the Creative Commons licence, and indicate if changes were made. The images or other third party material in this article are included in the article's Creative Commons licence, unless indicated otherwise in a credit line to the material. If material is not included in the article's Creative Commons licence and your intended use is not permitted by statutory regulation or exceeds the permitted use, you will need to obtain permission directly from the copyright holder. To view a copy of this licence, visithttp://creativecommons.org/licenses/by/4.0/. The Creative Commons Public Domain Dedication waiver (http://creativecommons.org/publicdomain/zero/1.0/) applies to the data made available in this article, unless otherwise stated in a credit line to the data.
* Correspondence:[email protected]
Introduction
Insulin resistance (IR) is considered to be associated with many metabolic disorders, such as type 2 diabetes and obesity. The liver is a main target organ for the ac-tion of insulin in the body. Under normal physiological conditions, insulin promotes anabolic metabolism in the liver by enhancing glucose consumption and lipid syn-thesis; however, the IR state is characterized by a failure to inhibit hepatic glucose production, with paradoxically increased fat accumulation, resulting in hyperglycemia and hypertriglyceridemia [1, 2]. Therefore, elucidating the pathogenic mechanism underlying hepatic IR is key to preventing and treating metabolic disorders and re-lated diseases.
Long noncoding RNAs (lncRNAs) belong to a class of regulatory noncoding RNAs with transcript lengths greater than 200 nucleotides and serve vital roles in tran-scriptional and posttrantran-scriptional gene expression regula-tion [3, 4]. Recently, dysregulation of lncRNAs has been found to be important in various human diseases, such as cancer, diabetes and cardiovascular diseases [5–7]. In par-ticular, some reports have noted that lncRNAs play an im-portant role in liver glycolipid metabolism. For instance, Zhu et al. showed that the expression of the lncRNA MEG3 was increased in high-fat diet (HFD)-fed and ob/ob mice and upregulated by palmitate, oleate or linoleate. The suppression of the lncRNA MEG3 improved the ele-vation in triglyceride levels and the impaired glucose toler-ance and downregulation of the glucogen content in the HFD-fed mice or ob/ob mice [8]. However, lncRNAs spe-cifically involved in the progression of hepatic IR are poorly characterized.
In our previous studies, hepatic IR in mice was estab-lished with HFD feeding [9]. In an attempt to under-stand the mechanisms underlying the lncRNAs involved in hepatic IR, in this study, systematic analyses of the hepatic expression profiles of lncRNAs and mRNAs in normal diet (ND)-fed mice and HFD-induced hepatic IR mice were performed. DE lncRNAs and mRNAs were identified in these two groups of mice. In addition, some of the DE lncRNAs were verified by quantitative real-time PCR (q-PCR). The target genes of the DE lncRNAs were also predicted, and biological functions and path-way enrichment were analyzed by Gene Ontology (GO) and Kyoto Encyclopedia of Genes and Genomes (KEGG) enrichment analyses. Moreover, interaction and coex-pression networks were constructed for the DE mRNAs and lncRNAs to determine the regulatory roles of lncRNAs in hepatic IR.
Materials and methods
Animal experiments
Ten liver tissue samples were derived from HFD-induced liver IR mice and ND-fed mice in our previous
study (ND, n= 5; HFD,n= 5) [9]. Briefly, male 8-week-old C57BL/6 J mice were purchased from Vital River La-boratory Animal Technology (Beijing, China). After 1 week of adaptive feeding, mice were randomly assigned to either a ND (n= 12) group or a HFD (n= 12) group, and were fed for 12 weeks. Diet formula was showed in our previous study [9]. At the end of the 12th week of the feeding experiment, five mice randomly selected from each group were sacrificed for liver tissue collection.
RNA extraction, library construction, and high-throughput sequencing
High-throughput sequencing was performed on the liver tissue samples of each mouse individually (Majorbio Bio-Pham Technology Co., Shanghai, China). Briefly, total RNA was extracted from the liver tissue using TRI-zol® Reagent (Invitrogen, Carlsbad, CA, USA), and the concentration and purity of the extracted RNA were de-tected by using a NanoDrop 2000 spectrophotometer (Thermo Scientific, Wilmington, DE, USA). The integ-rity of the isolated RNA was evaluated by agarose gel electrophoresis, and the RNA integrity number was de-termined with an Agilent 2100 (Agilent Technologies, Palo Alto, CA, USA). Total RNA without rRNA was uti-lized for RNA sample preparation using a Ribo-Zero Magnetic kit (EpiCentre Biotechnologies, Madison, WI, USA). Subsequently, RNA libraries were prepared by using the rRNA-depleted RNA with the TruSeq™ Stranded Total RNA Library Prep Kit (Illumina, San Diego, CA, USA). High-throughput sequencing was per-formed using the HiSeq 4000 SBS Kit (Illumina, San Diego, CA, USA).
Analysis of sequencing data
Through quality control of the raw reads produced by high-throughput sequencing, clean reads were obtained. The raw reads were processed by removing the reads with no insert clip, an N ratio exceeding 10%, sequences < 20 nucleotides (nt) and low quality. The Q20 and Q30 content of the clean data were subsequently calculated. The high-quality reads were used to analyze lncRNAs and mRNAs by mapping to a mouse reference genome with HISAT2 software [10]. The remaining reads with-out comment information were analyzed by StringTie novel transcript [11].
Identification of lncRNAs
Preliminary filtering included removing mRNAs and selecting the transcripts with a length≥200 bp, exon number≥2, ORF length≤300 bp and fragment count≥3 by using gffcompare information to filter different types of lncRNAs (intergenic lncRNAs, intronic lncRNAs, and antisense lncRNAs). Advanced filters of the coding po-tential of lncRNAs included a Coding Popo-tential Calcula-tor (CPC) score < 0, a Coding-Non-Coding Index (CNCI) score < 0, a Coding Potential Assessment Tool (CPAT) result indicating low coding potential and no significance in the Pfam database.
Expression analysis of lncRNAs and mRNAs
RSEM can be used to calculate the expression of genes or transcripts from single- or double-terminal sequen-cing data. The quantitative expression of both lncRNAs and mRNAs in each sample was calculated in fragments per kilo-base of exon per million reads mapped. Tran-scripts with a P value < 0.05 and |log2 (HFD/ND)|≥1 were determined to be DE genes and transcripts. A Vol-cano plot and hierarchical clustering were used to analyze the DE lncRNAs and mRNAs identified between ND- and HFD-fed mice.
Q-PCR
The expression of seven lncRNAs in the liver of ten mice (ND, n= 5; HFD, n= 5) was assessed using q-PCR to verify the accuracy of the high-throughput sequencing results. Total RNA was extracted from samples by using TRIzol® Reagent (Invitrogen, Carlsbad, CA, USA), and cDNA was synthesized by using the miScript II RT Kit (Qiagen, Hilden, Germany). Real-time PCR was per-formed with the miScript SYBR® Green PCR Kit (Qiagen, Hilden, Germany) using a 7500 FAST real-time PCR sys-tem (Applied Biosyssys-tems, Foster City, CA, USA). The relative expression of lncRNAs was calculated by the 2-△△Ctmethod. A two-tailed Student’sttest was used to compare lncRNA expression between samples from the ND group and those from the HFD group in 3 experi-mental replicates. The forward and reverse primers for lncRNAs are shown in supplemental file 1. The PCR products were sequenced to verify that they had been identified correctly.
GO and KEGG enrichment analyses
The prediction of lncRNA functions is based on the functional annotations of related cis- and trans-target genes. The protein-coding genes located within 100 kb upstream or downstream of the identified DE lncRNAs were defined as cis-target genes. The RNAplex program was used to identify possible trans-target genes of the DE lncRNAs. Then, GO and KEGG enrichment analyses were performed to predict the biological functions of the DE lncRNA target genes. GO analysis was applied for
the identification and annotation of genes in the three categories of molecular functions, biological processes, and cellular components. KEGG enrichment analysis was used to analyze the important pathways involving the target genes of the DE lncRNAs. The threshold (a P value ≤0.05 and false discovery rate≤0.05) was calcu-lated using Fisher’s exact test.
Interaction analysis and coexpression network analysis Interactions among the identified DE mRNAs were eval-uated with Search Tool for the Retrieval of Interacting Genes/Proteins (STRING). These genes required an interaction score≥0.4, and the interaction network was built with Cytoscape (version 3.6.1).
A weighted gene coexpression network (WGCNA) can be used to find clusters (modules) of highly correlated genes. The coexpression network of the DE lncRNAs and mRNAs was constructed by using the R package WGCNA. We used step-by-step network construction with a soft threshold of β= 16 (R2= 0.43) and a mini-mum module size of 30. The topological overlap dis-tance calculated from the adjacency matrix was then clustered with average linkage hierarchical clustering. The connections in each module were visualized using Cytoscape (version 3.6.1).
Results
Sequencing data summary
In our study, libraries were constructed from liver tissue samples from ND-fed mice (n= 5) and HFD-induced hepatic IR mice (n= 5) and subjected to sequencing ana-lysis. High-throughput sequencing produced 516,429,450 and 457,341,558 raw reads from the two groups, respect-ively. The raw reads were filtered to obtain high-quality clean reads. In total, 506,933,232 and 448,761,362 clean reads were retained for the ND and HFD groups, re-spectively (Table1). The Q20 and Q30 of the clean data were subsequently calculated to evaluate the quality of the RNA-sequencing data. The Q20 and Q30 quality scores were higher than 90%, and the sequencing error rate was less than 1%. The data indicated that the RNA-sequencing results had reliable quality. The obtained clean reads were mapped to a mouse reference genome, with the mapping ratio ranging from 96.10 to 97.13% (supplemental file2).
Identification and classification of lncRNAs in the liver of mice
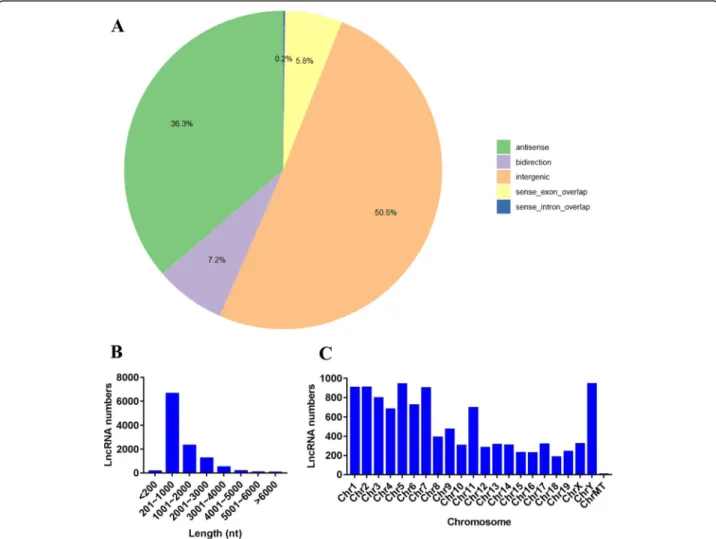
position of the coding gene, the novel lncRNAs were classified into five broad categories: 5572 intergenic lncRNAs (50.5%), 4004 antisense lncRNAs (36.3%), 642 sense exonic overlap lncRNAs (5.8%), 22 sense intronic overlap lncRNAs (0.2%) and 796 bidirectional lncRNAs (7.2%) (Fig. 1a). Furthermore, the distributions of these lncRNAs in terms of length and chromosomal location were analyzed in this study. In different length groups,
most of the lncRNAs were 201–1000 nt long (Fig. 1b). Chromosomal distribution analysis revealed that chro-mosomes 1, 2, 5 and Y contained relatively higher amounts of lncRNAs (Fig.1c).
Differential expression analysis of lncRNAs and mRNAs After high-throughput sequencing, a total of 11,036 lncRNAs were obtained by comparing the ND and HFD Table 1Results of sequencing before and after quality control of ND and HFD libraries
ND HFD
Raw data Clean data Raw data Clean data
Total_Reads 516,429,450 506,933,232 457,341,558 448,761,362
Total_Bases 77,980,846,950 68,519,999,495 69,058,575,258 60,357,317,965
Error% 0.01242 0.0112 0.0124 0.01116
Q20% 97.762 98.806 97.748 98.81
Q30% 94.532 96.266 94.516 96.274
Error% means base Error rate. Q20% and Q30% means the percentage of bases with Phred value greater than 20 and 30 in the total bases. ND, normal diet mice; HFD, high-fat diet mice
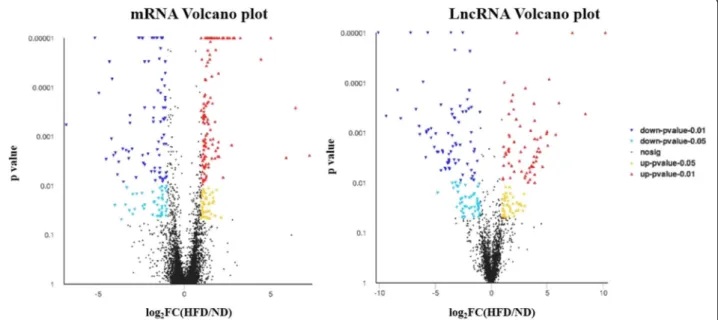
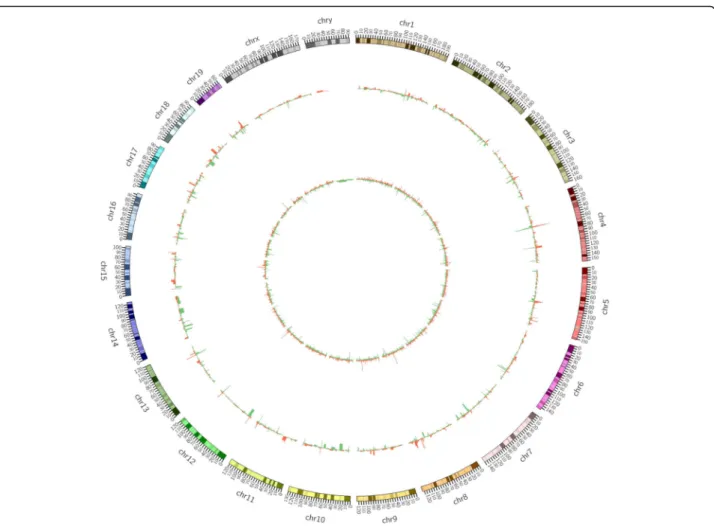
groups. The analysis of the lncRNAs DE between the two groups showed that compared with the ND group, the HFD group contained 232 DE lncRNAs, among which 108 were upregulated lncRNAs and 124 were downregulated lncRNAs. Regarding the expression pro-files of mRNAs, 40,675 mRNAs were present in both groups. Among all of these mRNAs, compared with the ND group, the HFD group contained 291 DE mRNAs, including 166 upregulated mRNAs and 125 downregu-lated mRNAs. A volcano plot and heatmap were gener-ated to visualize the DE lncRNAs and DE mRNAs identified by comparing the two groups, as shown in Fig.2and in supplemental file4. Moreover, the chromo-somal distributions of the DE lncRNAs and mRNAs are shown in Fig.3.
DE lncRNA validation by q-PCR
To validate the reliability of the lncRNA expression data, seven lncRNAs that exhibited relatively abundant ex-pression and significant differential exex-pression in the livers from mice in the two groups were selected and evaluated by q-PCR. These lncRNAs included one up-regulated lncRNA (ENSMUST00000200707) and six downregulated lncRNAs (ENSMUST00000107095,
ENSMUST00000146928, ENSMUST00000153523,
MSTRG.7107.6, MSTRG.19471.1 and MSTRG.19772.3). The results showed that the level of the lncRNA ENSMUST000030200707 was significantly increased, while the levels of the lncRNAs ENSMUST00000107095,
ENSMUST00000146928, ENSMUST00000153523,
MSTRG.7107.6, MSTRG.19471.1 and MSTRG.19772.3
were obviously decreased in the HFD group compared with the ND group (Fig.4). The q-PCR validation results for these DE lncRNAs were consistent with our bioinfor-matic analysis based on high-throughput sequencing.
GO and KEGG enrichment analyses of the DE lncRNAs and mRNAs
First, target genes of the DE lncRNAs were predicted by bioinformatic approaches, and the results are presented in supplemental file5. Subsequently, GO and KEGG en-richment analyses were performed on the predicted tar-get genes of the DE lncRNAs. The top 30 GO terms are shown in Fig.5a, in which“glycerol biosynthetic process from pyruvate” was majorly enriched in the biological process category. GO enrichment also indicated enrich-ment of other important biological processes, including various compounds and nucleic acid metabolism in the cell, mitochondrial modification, catalytic enzyme activ-ity and molecular function regulation. Furthermore, the top 30 enriched KEGG pathways are presented in Fig.6a, and the“Renin-angiotensin system”was the top enriched pathway. More importantly, pathway enrichment ana-lysis showed enrichment of several pathways related to IR or glycolipid metabolism, such as the citrate cycle (TCA cycle), the PPAR signaling pathway, the AMPK signaling pathway, the MAPK signaling pathway, glycoly-sis/gluconeogenesis, the glucagon signaling pathway, biosynthesis of unsaturated fatty acids, the PI3K-Akt sig-naling pathway, insulin resistance, and the insulin signal-ing pathway.
For the DE mRNAs, the top 30 enriched GO terms and KEGG pathways are shown in Fig. 5b and Fig. 6b. The GO terms mainly included cellular_component, bio-logical regulation, regulation of cellular process, meta-bolic process, intracellular organelle and cytoplasmic part. KEGG pathway analysis showed that DE mRNAs were mainly associated with Protein digestion and ab-sorption, Pancreatic secretion, Arachidonic acid metab-olism, PPAR signaling pathway and Retinol metabolism.
Interaction and coexpression network analysis
The interactions among the proteins encoded by the DE mRNAs are shown in Fig. 7a. The Cxcl2, Serpine1 and Prss2 genes were the important genes that interacted with many of the other DE mRNAs in this network. Moreover, a DE lncRNA-mRNA coexpression network, which consisted of 87 nodes (59 DE lncRNAs and 28 DE mRNAs) and 1125 edges, was constructed (Fig. 7b). Within this RNA network, the lncRNA MSTRG.8007.2 had the maximum number of targets. The Pnlip, Ctrl,
Cpb1 and Amy2a3 genes had the maximum number of coexpressed lncRNAs.
Discussion
Increasing evidence has shown that the abnormal ex-pression of lncRNAs is closely related to the occurrence and development of IR and related diseases [8, 12, 13]. Nevertheless, a comprehensive database of the potential role of lncRNAs in the pathogenesis of hepatic IR still lacks. Therefore, in this study, using high-throughput RNA sequencing, we obtained the expression profiles of lncRNA and mRNA in the liver of ND-fed mice and HFD-induced hepatic IR mice. On this basis, we ana-lyzed DE lncRNAs and mRNAs between the two groups and explored the potential roles of lncRNAs in progress of HFD-induced hepatic IR by various bioinformatics methods. Our results provided the valuable information for the understanding of the lncRNA function in HFD-induced hepatic IR.
Fig. 3Distributions of differentially expressed lncRNAs and mRNAs on chromosomes. The outer layer shows the distribution on chromosomes, the middle layer indicates the differential expression of lncRNAs on the chromosomes, and the inner layer shows the distribution of differentially expressed mRNAs on the chromosomes. Red indicates upregulation, green indicates downregulation, and the height indicates the
In this study, after high-throughput sequencing, a total of 11,036 lncRNAs were obtained in livers of the two groups of mice. Among these lncRNAs, most of the transcripts were intergenic lncRNAs. DE lncRNA ana-lysis showed that compared with ND mice, HFD-induced hepatic IR mice expressed 232 DE lncRNAs in the liver, including 108 upregulated lncRNAs and 124 downregulated lncRNAs. Subsequently, q-PCR was per-formed to validate the high-throughput sequencing re-sults for the DE lncRNAs. Seven DE lncRNAs, which were relatively enriched in the liver and significantly DE, were subjected to experimental verification. The results showed that the expression changes in the seven lncRNAs detected by q-PCR were consistent with the se-quencing results, indicating the reliability of the lncRNA sequencing data. In addition, by examining the literature, we found that the lncRNA ENSMUST00000107095 (lncRNA Gm15441), a DE lncRNA validated by q-PCR in our study, has been recently reported to be a
regulator of fatty acid oxidation in hepatocytes [14]. This result further confirms the reliability and reflects the ap-plication value of our results, which provide a basis for further study of the mechanism involving lncRNAs in hepatic IR.
has also been tested in some studies. For instance, PAI-1, which is encoded by the Serpinel gene, has been re-ported to exhibit elevated expression in obesity and type 2 diabetes [19,20]. Coudriet GM et al. recently showed that the absence of PAI-1 resulted in improvements in glucose tolerance and IR [21].
The prediction of lncRNA functions is based on the functional annotation of lncRNA target genes. Thus, tar-get genes of the DE lncRNAs were identified, and GO and KEGG enrichment analyses were applied to deter-mine the functional distributions of these target genes.
The GO functional enrichment analysis showed that the target genes associated with the DE lncRNAs were sig-nificantly involved in glycerol biosynthesis from pyruvate and various compounds and nucleic acid metabolism in the cell. It is worth noting that the target genes were sig-nificantly enriched in a variety of IR- and glycolipid metabolism-related pathways, such as the citrate cycle (TCA cycle), PPAR signaling pathway, PI3K-Akt signal-ing pathway and insulin signalsignal-ing pathway, by the KEGG enrichment analysis. Therefore, the finding effectively suggests that these DE lncRNAs identified in HFD-Fig. 5The top 30 GO terms for differentially expressed genes.aThe top 30 GO terms for the target genes of differentially expressed lncRNAs.b
induced hepatic IR mice may be involved in mediating the process of IR by regulating various signaling pathways.
Coexpression network analysis of DE lncRNAs and mRNAs is helpful for further investigating the potential functions of lncRNAs. In the network we constructed, most of the mRNAs coexpressed with the lncRNAs encoded digestive or metabolic enzymes. Some of these mRNAs have been reported to be associated with IR. For example, Nishimura et al. found that Enpp2 contrib-uted to adipose tissue expansion and IR in diet-induced obesity [22]. Reeves et al. also reported that there is a
relatively strong and consistent relationship between serum Enpp2 and glucose homeostasis or insulin sensi-tivity in relatively old, nondiabetic humans who were overweight or obese [23]. Thus, whether those lncRNAs coexpressed with Enpp2 are also involved in the process of IR needs to be further verified by experiments.
further research needed to be carried out to validate the expression of lncRNAs of interest. Second, though the potential functions of the DE lncRNAs were predicted through GO and KEGG enrichment analyses of their target genes and coexpression network analysis of DE lncRNAs and mRNAs, these results lack experimental validation. Therefore, the specific lncRNAs that function
in hepatic IR and their associated mechanisms should be further verified by in vivo and in vitro study in the future.
Conclusions
In summary, our study systematically analyzed the ex-pression profiles of lncRNAs and mRNAs in the liver of Fig. 7Interaction and coexpression network analyses.aInteractions between differentially expressed mRNAs. The red circle represents
ND-fed mice and HFD-induced hepatic IR mice, and identified DE lncRNAs and mRNAs between the two groups. The results of relevant biological functions and pathway enrichment analysis indicate that these DE lncRNAs may be involved in glycolipid metabolism and mediating the process of IR by regulating various signal-ing pathways. Our results provided not only a systematic perspective on lncRNAs in hepatic IR but also a valuable data resource for further study of the potential functions of lncRNAs in the pathogenesis of hepatic IR and glyco-lipid metabolism-related diseases.
Supplementary information
Supplementary informationaccompanies this paper athttps://doi.org/10. 1186/s12986-020-00467-7.
Additional file 1.
Additional file 2.
Additional file 3.
Additional file 4.
Additional file 5.
Abbreviations
IR:Insulin resistance; lncRNAs: Long noncoding RNAs; ND: Normal diet; HFD: High-fat diet; DE: Differentially expressed; q-PCR: Quantitative real-time PCR; GO: Gene Ontology; KEGG: Kyoto Encyclopedia of Genes and Genomes; CPC: Coding Potential Calculator; CNCI: Coding-Non-Coding Index; CPAT: Coding Potential Assessment Tool
Acknowledgements
Not applicable.
Authors’contributions
XC conceived and designed the study. ZZ, XZ, YL and ZC performed experiments and wrote the manuscript. LC, YW and ZZ interpreted the data and prepared the manuscript. All authors read and approved the final manuscript.
Funding
The research was supported by grants from the National Natural Science Foundation of China (No.81673153 and No. 81973034).
Availability of data and materials
All data generated or analyzed during this study are included in this published article (and its supplementary information files).
Ethics approval and consent to participate
All procedures described involving animals were approved by the Harbin Medical University Institutional Animal Care Committee, and conducted in accordance with the guidelines of Harbin Medical University on the experimental use of laboratory animals.
Consent for publication
Not applicable.
Competing interests
The authors declare that they have no competing interests.
Received: 3 January 2020 Accepted: 8 June 2020
References
1. Santoleri D, Titchenell PM. Resolving the paradox of hepatic insulin resistance. Cell Mol Gastroenterol Hepatol. 2019;7:447–56.
2. Méndez-Sánchez N, Chávez-Tapia NC, Zamora-Valdés D, Medina-Santillán R, Uribe M. Hepatobiliary diseases and insulin resistance. Curr Med Chem. 2007;14:1988–99.
3. Coe FL, Evan A, Worcester E. Kidney stone disease. J Clin Invest. 2005;115: 2598–608.
4. Polovic M, Dittmar S, Hennemeier I, Humpf H-U, Seliger B, Fornara P, et al. Identification of a novel lncRNA induced by the nephrotoxin ochratoxin a and expressed in human renal tumor tissue. Cell Mol Life Sci. 2018;75:2241–56. 5. Kopp F, Mendell JT. Functional classification and experimental dissection of
long noncoding RNAs. Cell. 2018;172:393–407.
6. Uchida S, Dimmeler S. Long noncoding RNAs in cardiovascular diseases. Circ Res. 2015;116:737–50.
7. Huarte M. The emerging role of lncRNAs in cancer. Nat Med. 2015;21:1253–61. 8. Zhu X, Wu Y-B, Zhou J, Kang D-M. Upregulation of lncRNA MEG3 promotes hepatic insulin resistance via increasing FoxO1 expression. Biochem Biophys Res Commun. 2016;469:319–25.
9. Zhao X, Chen Z, Zhou Z, Li Y, Wang Y, Zhou Z, et al. High-throughput sequencing of small RNAs and analysis of differentially expressed microRNAs associated with high-fat diet-induced hepatic insulin resistance in mice. Genes Nutr. 2019;14:6.
10. Kim D, Langmead B, Salzberg SL. HISAT: a fast spliced aligner with low memory requirements. Nat Methods. 2015;12:357–60.
11. Trapnell C, Roberts A, Goff L, Pertea G, Kim D, Kelley DR, et al. Differential gene and transcript expression analysis of RNA-seq experiments with TopHat and cufflinks. Nat Protoc. 2012;7:562–78.
12. Yan C, Chen J, Chen N. Long noncoding RNA MALAT1 promotes hepatic steatosis and insulin resistance by increasing nuclear SREBP-1c protein stability. Sci Rep. 2016;6:22640.
13. Goyal N, Kesharwani D, Datta M. Lnc-ing non-coding RNAs with metabolism and diabetes: roles of lncRNAs. Cell Mol Life Sci. 2018;75:1827–37. 14. Batista TM, Garcia-Martin R, Cai W, Konishi M, O'Neill BT, Sakaguchi M, et al.
Multi-dimensional transcriptional remodeling by physiological insulin in vivo. Cell Rep. 2019;26:3429.
15. Dong X, Park S, Lin X, Copps K, Yi X, White MF. Irs1 and Irs2 signaling is essential for hepatic glucose homeostasis and systemic growth. J Clin Invest. 2006;116:101–14.
16. Honma M, Sawada S, Ueno Y, Murakami K, Yamada T, Gao J, et al. Selective insulin resistance with differential expressions of IRS-1 and IRS-2 in human NAFLD livers. Int J Obes. 2018;42:1544–55.
17. Vidal-Puig A, Jimenez-Liñan M, Lowell BB, Hamann A, Hu E, Spiegelman B, et al. Regulation of PPAR gamma gene expression by nutrition and obesity in rodents. J Clin Invest. 1996;97:2553–61.
18. Zhang Y-L, Hernandez-Ono A, Siri P, Weisberg S, Conlon D, Graham MJ, et al. Aberrant hepatic expression of PPARgamma2 stimulates hepatic lipogenesis in a mouse model of obesity, insulin resistance, dyslipidemia, and hepatic steatosis. J Biol Chem. 2006;281:37603–15.
19. Shimomura I, Funahashi T, Takahashi M, Maeda K, Kotani K, Nakamura T, et al. Enhanced expression of PAI-1 in visceral fat: possible contributor to vascular disease in obesity. Nat Med. 1996;2:800–3.
20. Juhan-Vague I, Alessi MC. PAI-1, obesity, insulin resistance and risk of cardiovascular events. Thromb Haemost. 1997;78:656–60.
21. Coudriet GM, Stoops J, Orr AV, Bhushan B, Koral K, Lee S, et al. A noncanonical role for plasminogen activator inhibitor type 1 in obesity-induced diabetes. Am J Pathol. 2019;189:1413–22.
22. Nishimura S, Nagasaki M, Okudaira S, Aoki J, Ohmori T, Ohkawa R, et al. ENPP2 contributes to adipose tissue expansion and insulin resistance in diet-induced obesity. Diabetes. 2014;63:4154–64.
23. Reeves VL, Trybula JS, Wills RC, Goodpaster BH, Dubé JJ, Kienesberger PC, et al. Serum Autotaxin/ENPP2 correlates with insulin resistance in older humans with obesity. Obesity (Silver Spring, Md). 2015;23:2371–6.
Publisher’s Note