ISSN: 2147-611X
www.ijemst.com
Using
Data
Mining
Techniques
Examination of the Middle School
Students’ Attitude towards Mathematics
in the Context of Some Variables
Feriha Hande Idil, Serkan Narli, Esra Aksoy Dokuz Eylül University
To cite this article:
Idil, F.H., Narli, S., & Aksoy, E. (2016). Using data mining techniques examination of the
middle school students‟ attitude towards mathematics in the context of some variables.
International Journal of Education in Mathematics, Science and Technology, 4
(3), 210-228.
DOI:10.18404/ijemst.02496
This article may be used for research, teaching, and private study purposes.
Any substantial or systematic reproduction, redistribution, reselling, loan, sub-licensing,
systematic supply, or distribution in any form to anyone is expressly forbidden.
Authors alone are responsible for the contents of their articles. The journal owns the
copyright of the articles.
Volume 4, Number 3, 2016
DOI:10.18404/ijemst.02496
Using Data Mining Techniques Examination of the Middle School
Students’ Attitude towards Mathematics in the Context of Some Variables
Feriha Hande Idil, Serkan Narli, Esra Aksoy
Article Info
Abstract
Article History
Received: 10 August 2015
The aim of this study is to examine middle school students‟ attitude towards mathematics in the context of their mathematic learning preferences using data mining which is data analysis methodology that has been successfully used in different areas including educational domains. „How do I actually learn?‟ questionnaire and attitude scale were applied to 702 middle school students studying in three different cities of Turkey. Demographic data (gender, grade level, parents‟ education level, pre-school education) were also gathered. Data mining techniques such as decision tree was implemented. Furthermore web graph was used for visualization of relationship between mathematic learning preference and attitude towards mathematics. Constructed decision tree models with C5.0 algorithm revealed that all of variables used in this study are related to the attitude towards mathematics but the most effective attribute is found as grade level. Using web graph, it was found that the strongest relationship was between reflective learning preference and positive level attitude towards mathematics.
Accepted: 08 December 2015
Keywords
Attitude towards mathematics Mathematic learning style/preference Educational data mining
Introduction
Ability to understand and use mathematics is of increasing importance (Ministry of Education in Turkey, 2009). Achievements in international examinations such as PISA (The Programme for International Student Assessment) and TIMSS (Trends in International Mathematics and Science Study) are important for many countries including Turkey. These examinations showed that Turkish students are not successful enough especially in mathematics. Therefore, factors affecting success directly or indirectly were examined in a lot of studies. And, different reasons have been found by researchers for the poor performance of students in mathematics. These factors consist of many personal components such as anxiety and attitude. There are a lot of studies claiming that there is a correlation between pupils‟ attitude towards mathematics and their mathematical results (e.g. Nicolaidou & Philippou, 2003; Aiken, 1976; Papanastasiou, 2000; Savaş & Duru, 2005; Tekindal, 1988; Baykul, 1990). Researchers concluded that positive attitude towards mathematics leads students towards success in mathematics. It appears that student attitudes towards mathematics influence their learning of the subject (Leder, 1992). That is, attitude towards mathematics plays a crucial role in the learning processes of mathematics. And present study aimed to investigate attitude towards mathematics and the factors affect attitude using a novel technique such as data mining which has given promising results in various studies.
Attitude towards Mathematics
There is no standard definition of the term „attitude‟. Generally it is defined as emotional reaction to an object, behavior tendency towards an object and beliefs about the object. According to Leder (1992) attitudes are learnt and predispose one towards action which may be either favorable or unfavorable with respect to a given object. A negative attitude towards mathematics can reduce a person‟s willingness to persist with a problem. For this reason, generating positive attitudes towards mathematics among students is an important goal of mathematics education. To generate positive attitude, individual features should be taken into consideration.
individual difference were considered to be leaning style/ preference and various demographic variables in the present study.
Attitude and Learning Styles/Preferences
Kolb (1984) defines learning style as a preferred way of gathering information, whereas for Dunn (1984), learning style is an individual way of absorbing and retaining information or skills. Learning style is not ability but is a preferred way of using one's abilities (Sternberg, 1994). Students‟ learning styles can be described as students‟ preferences on how they “receive and process information” (Felder & Silverman, 1988). Therefore learning style and learning preference were used in the same sense in present study.
Understanding students' learning preferences help teachers to overcome the learning difficulties, and assist them to invest in their capabilities. Özer (1998) reported that teachers must know students‟ learning styles for effective learning. In this regard, many scholars (Given 1996; Babadoğan, 2000; Peker, 2003 etc.) stated that understanding students‟ learning styles/preferences can improve learning process. There are many kinds of models (e.g. Felder & Silverman; Honey & Mumford; Kolb; Myers-Briggs; Grasha & Reichmann) which allow for determination of students‟ learning styles.
In company with planning learning environments and processes, considering individual differences is important for each course, and mathematics is also accepted as one of the most important discipline all over the world. In this context, it is important to take into consideration students‟ learning preferences in mathematics. So „How Do I Actually Learn?‟ questionnaire which was introduced by Forster (1999) can help educators to plan learning environments in mathematics.
This model identifies the following four dimensions of learning preferences:
Reflective: Individuals who select reflective learning learn by: Answering questions in whole class work, explaining things to the class, answering the teacher‟s questions(one-to-one), explaining her/his work to the teacher (one-to-one), explaining work to friends.
Inquisitive: Individuals who select inquisitive learning learn by: Asking the teacher if he agrees with her/his ideas in whole-class work, asking for an explanation in whole-class work, asking the teacher, one-to-one, if he agrees with his/her ideas, asking the teacher, one-to-one, to explain things, asking friends if they agree with his/her ideas, asking friends to explain things.
Diligent: Individuals who select diligent learning learn by: Listening to the teacher in whole-class work, listening to the teacher explain things to him/her one-to-one, listening to her/his friends explain things, working on problems along with the class, working with other students on problems, working by herself/himself.
User (Technology): Individuals who select user learning learn by: Using graphics calculator. Graphics calculator is easy to use; solving problems on a graphics calculator is doing proper mathematics; using a graphics calculator helps her/him understand mathematics, and a graphics calculator helps her/him explain mathematics.
Attitude and Demographic Variables
Studies in literature clearly showed that various factors had effects on mathematics attitude and it can be said that attitude is dependent on many factors (Taşdemir, 2009; Köğce, Yıldız, Aydın & Altındağ, 2009) . Discussing personal factors affects attitude, and demographic variables should not be forgotten. A lot of factors can be listed for demographic variables. Some of them such as gender, grade level, parents‟ education level and receiving pre-school education were used in this study.
Altındağ (2009) also reached similar results and their findings showed that there are significant differences between younger and older students‟ attitudes towards mathematics.
Educational Data Mining
There are a lot of definitions for data mining in literature such as „data analysis methodology used to identify hidden patterns in a large data set‟ (Tiwari & Vimal, 2013), „the process that analyzes the data from different points of view and summarizes the results as useful information‟ (Şuşnea, 2009), „a technology used to describe knowledge discovery and to search for significant relationships such as patterns, association and changes among variables in databases‟ (Pal, 2012). In brief, data mining can be defined as applications of different algorithms to identify patterns and relationships in a data set.
Data mining is similar to mining to obtain ore from the sand. That is, it can be considered that sand is data and ore is knowledge. Although it should be defined as knowledge mining, it is defined as ‟data mining‟ to emphasize large amounts of data. Data mining techniques can be classified as below:
Clustering
Classification and regression (decision tree, neural network etc.) Association rules
Data mining has been used in different areas such as Marketing, Banking, Insurance, Telecommunication, Health and Medicine, Industry, Internet, Science and Engineering etc. Recently, one of these areas is educational environment. As a result of application of data mining techniques in education, educational data mining (EDM) field has emerged. Educational Data Mining is defined as „an emerging discipline, concerned with developing methods for exploring the unique types of data that come from educational settings, and using those methods to better understand students, and the settings in which they learn‟ by International Educational Data Mining Society (http://www.educationaldatamining.org).
Data mining has attracted a great deal of attention in the information industry and in society as a whole in recent years, due to the wide availability of huge amounts of data and the imminent need for turning such data into useful information and knowledge (Han & Kamber, 2006). Education sector also has huge amounts of data and needs such techniques. EDM is an emergent discipline on the intersection of data mining and pedagogy. On the one hand, pedagogy contributes to the intrinsic knowledge of learning process. On the other hand, data mining adds the analysis and information modeling techniques (Kumar & Vijayalakshmi, 2011). Many educators and scholars have begun to pay more attention to applying data mining techniques to educational data.
Three objectives could be identified to use EDM as a technology in the field of education. One of them is Pedagogic objectives – To help the students to improve in academics, designing the content of the course in a better way etc. (Kumar & Vijayalakshmi, 2011). Romero and Ventura (2007) summarized a role of data mining in education sector understandably:
„The application of knowledge extraction techniques to educational systems in order to improve learning can be viewed as a formative evaluation technique. Formative evaluation (Arruabarrena, Pe´rez, Lo´pez-Cuadrado, & Vadillo, 2002) is the evaluation of an educational program while it is still in development, and for the purpose of continually improving the program. Data mining techniques can discover useful information that can be used in formative evaluation to assist educators establish a pedagogical basis for decisions when designing or modifying an environment or teaching approach‟
In present study, decision tree, one of the classification techniques of data mining, was applied. It can be describe as below:
Decision Tree
During the construction of these trees, the data is split into smaller subsets iteratively. At each iteration, choosing the most suitable independent variable is an important issue. Here, the split which creates the most homogenous subsets with respect to the dependent variable should be chosen (Güntürkün, 2007).
Decision trees work by recursively partitioning the data based on input field values. The data partitions are called branches. The initial branch (sometimes called the root) encompasses all data records. The root is split into subsets, or child branches, based on the value of a particular input field. Each child branch can be further split into sub-branches, which can in turn be split again, and so on. At the lowest level of the tree are branches that have no more splits. Such branches are known as terminal branches (or leaves) (Clementine 10.1).
Purpose of the Study
The aim of this study is to examine middle school students‟ attitude towards mathematics in the context of their mathematic learning preferences using data mining. This study would help teacher educators understand students‟ attitudes towards mathematics and learning preference. Furthermore, second aim of present study is to determine the variables which affect attitude. Making this examination using different, useful and novel techniques is also one of the aims. So, unlike conventional methods, data mining techniques were applied to data collected from students. Compared to traditional statistical studies, data mining can (1) provide a more complete understanding of data by finding patterns previously not seen and (2) make models that predict, thus enabling people to make better decisions, take action, and therefore mold future events (Nisbet, Elder & Miner, 2009). In this context the following research questions guided this study:
Research Question 1: Which variables (gender, grade level, pre-school education (yes/no), mother/father education level, math learning preference) are effective in determining the level of attitude towards mathematics? And which one is the most effective?
Research Question 2: What is the relationship between attitudes and preferences for learning math?
Method
Research Design
This study was conducted by descriptive and quantitative statistical method. The descriptive statistics are composed of a set of procedures that can be applied to summarize data, enabling the researcher to make comparisons and correlations (Merriam & Simpson, 2000).This study was designed with relational screening model that is one of the general screening models. Relational screening is a research model which aims to determine the existence and/or degree of joint variation between two or more variants (Karasar, 2009).
Participants
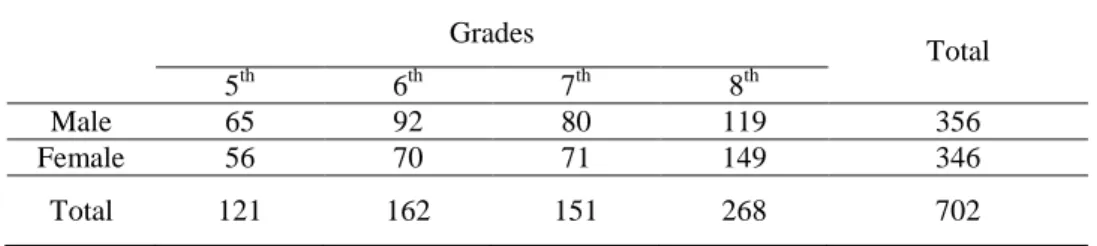
Convenience sampling was used for this study. Sample of the study consists of 702 middle school students from five urban middle schools in three different cities of Turkey (İzmir, Aydın and Manisa). Distribution of the participants according to grade and gender can be seen in Table 1.
Table 1. Demographic characteristic of students Grades
Total
5th 6th 7th 8th
Male 65 92 80 119 356
Female 56 70 71 149 346
Instrument
All participants responded to a three-part questionnaire, including the „How do I Actually Learn?‟ Questionnaire (Forster, 1999), Mathematics Attitude Scale (Aşkar, 1986), and a range of questions that elicited such demographic information as gender, grade level, pre-school education (yes/no), parents‟ education levels (elementary school/middle school/high school/university).
„How do I Actually Learn?‟ Questionnaire: The questionnaire was developed by Forster (1999) to identify middle school students‟ mathematics learning style preferences. The questionnaire asks students to indicate on a four-point Likert scale for 23 questions „How do I actually learn?' and to indicate their four preferred ways of learning. It was translated and adapted to Turkish by Yenilmez and Çakır (2005). Reliability analysis was carried out and Cronbach's alpha value was found as .82.
Mathematics Attitude Scale: It was developed by Aşkar (1986) in order to measure students‟ attitude towards mathematics. It is a five-point Likert-type scale and consists of 20 items. In present study, scale scores were divided into three groups as positive, negative and mid-level. According to reliability analysis the scale has a high internal consistency (α = .93).
Data Analysis
SPSS Clementine 10.1 was used to analyze collected data. Clementine is the SPSS enterprise-strength data mining workbench. Its name has changed as SPSS Modeler is an extensive predictive analytics platform that is designed to bring predictive intelligence to decisions made by individuals, groups, systems and the enterprise (http://www-01.ibm.com/software/analytics/spss/products/modeler/). For the analyses, a data mining technique such as decision tree was implemented. Furthermore, web graph was used for visualization of relationship among features.
Results
There were two research questions being planned to investigate in this study.
Findings for Research Question 1
The first question asks: „Which variables (gender, grade level, pre-school education (yes/no), mother/father education level, math learning preference) are effective in determining the level of attitude towards mathematics? And which one is the most effective?‟
To answer Research Question 1, data were analyzed using decision tree. Decision trees work by recursively partitioning the data based on input field values. The data partitions are called branches. The root is split into subsets, or child branches, based on the value of a particular input field. Each child branch can be further split into sub-branches, which can in turn be split again, and so on. At the lowest level of the tree are branches that have no more splits. Such branches are known as terminal branches (or leaves) (Clementine 10.1).
There are different types of algorithm that use different „attribute selection measure‟ to construct decision tree (e.g. ID3 (Iterative Dichotomiser 3), CART (Classification and Regression Trees), C4.5, C5.0, CHAID (Chi-Squared Automatic Interaction Detector), QUEST (Quick, Unbiased, Efficient Statistical Tree) etc.). As for this study, C5.0 algorithm is used. C5.0 works by splitting the sample based on the field that provides the maximum information gain. It can also build both decision tree and rule set (Clementine 10.1).
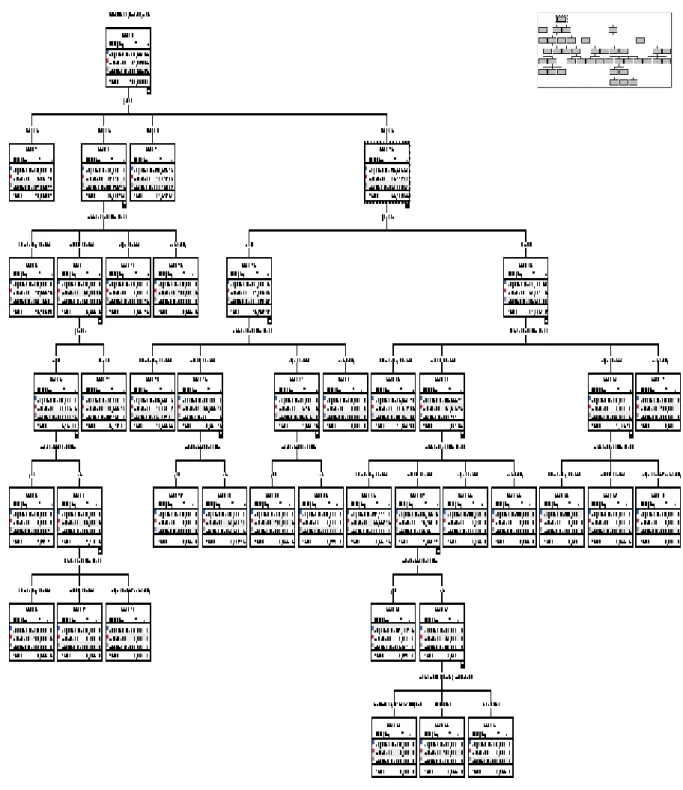
The represented tree is so large that the image of tree is minimized. To interpret the decision tree shown in Figure 1, it was divided into three parts and these parts are enlarged to read easily. The parts are shown using decision tree map so you can understand which part of tree it is. (see Figure2, Figure 3 and Figure 4).
So students with negative attitude should be investigated more than students with positive attitude. Thus, negative attitude can be searched for remedies to solve this problematic situation for math lesson. The second level represents the first partition of the data according to the most important factor suggested by the algorithm. (Şuşnea, 2009). The C5.0 tree indicated that all of independent variables have some sort of effect on the attitude towards mathematics but the most effective attribute is found to be grade level.
Figure 1. Decision Tree for Attitude towards Mathematics
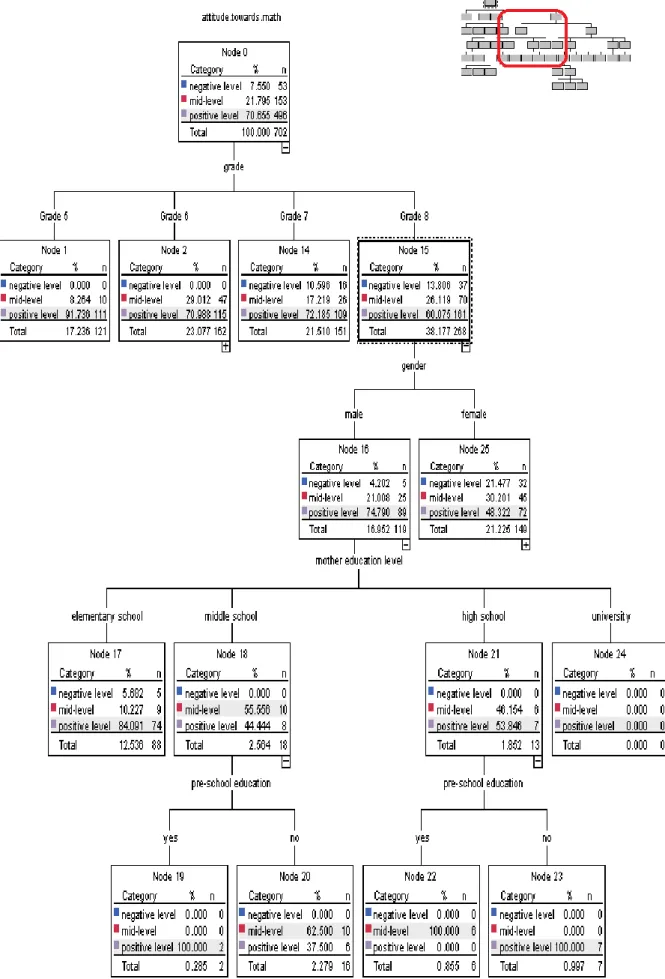
Node 1 and Node 2 contain no negative level, whereas Node 14 and Node 15 contain. This situation may stem from the fact that they will take the high school entrance exam and they are anxious about math. The more the grade level increases, the harder the math topics get for them. Node 2 is also divided into four nodes (Node 3, Node 4, Node 12, Node 13) with respect to the input variable mother education level. It means that mother education level has effect on attitude of students who are 6th grade. Moreover it is the most effective attribute to determine attitude level after the grade level. Most of the 6th grade students, whose mothers have elementary school or high school degree, have positive attitude. On the other hand Node 4 contains middle school degree. It covers the students having mid-level and positive level attitude with equal proportions. Node 13 contains mothers who have educational degree of university and it is interesting that there are totally 6 students who have mid-level attitude in this node. The reasons for this situation should also be investigated. This situation may stem from the fact that most of the mothers having university degree work and consequently they cannot spend enough time with their children to study lesson or to do their homework together. Moreover they may pressure on their children to be successful in school because they studied hard and had a degree of university.
The branching stops in Node 3, Node 12 and Node 13 but the branch covering middle school education level keeps being branched (Node 4). In this node, mother education degree and students education level which is going on are the same and thus it can be interpreted that this situation is critical for attitude. Node 5 and Node 11 which were created by the splitting of Node 4 are generated by the division made with respect to gender input data. Node 11 consists of female students and they mostly have mid-level attitude. The other node, Node 5, has 22 students and they mostly have positive attitude towards math. The difference between male and female students „attitude level may stem from puberty.
Node 5 is also separated into two by the pre-school education input variable. Node 6, one of the child nodes of Node 5, contains students who received pre-school education. All of them have positive level attitude. In the other node, Node 7, seventy-five percent of the students have mid-level attitude. However they did not receive pre-school education.
The branching stops in Node 6 but the branch covering pre-school education (NO) keeps being branched (Node 7). Node 8 and Node 9 are generated by the division made with respect to father education level input data. Node 8 contains students whose fathers have elementary school education and all of them seem to have neither positive nor negative level attitude towards math. At the same time, Node 9 contains students whose fathers have middle school education and all of them have positive level. However this node contains quite a few students. Node 10 has no one. It means that there were no 6th grade male students whose mothers have middle school degree and who received pre-school education, their father have high school or university degree at the same time in this sample. The last division with respect to father education level showed that mother education level is more important for 6th grade students than father education level in determining the attitude.
In Figure 3, the next split from Node 15 involving 8th grade students is made with respect to the gender. In other words, gender is the most effective factor for 8th grade students to determine attitude level. The facts about Node 4 are also valid for this node. The gender factor becomes important to attitudes towards mathematics for these students during 8th grade. Moreover male students may have a higher self-confidence as seen in Node 16 and Node 25, and they have a higher rate of positive level attitude than female students. The next split from Node 16 is made with respect to the mother education level. Node 17 contains students whose mothers have elementary school degree and eighty four percent of them have positive level attitude. And it is a leaf node. That means it stopped branching. Node 24 contains no students. However Node 18 and Node 21 also split into two terminal nodes, with respect to pre-school education. These nodes contain students whose mothers have middle school or high school education degree. The positive attitude proportions of these nodes are relatively low as compared to Node 17. Studying in middle school and preparing for high school entrance exam, 8th grade male students whose mothers have middle or high school degree may be in critical period for attitude towards mathematics.
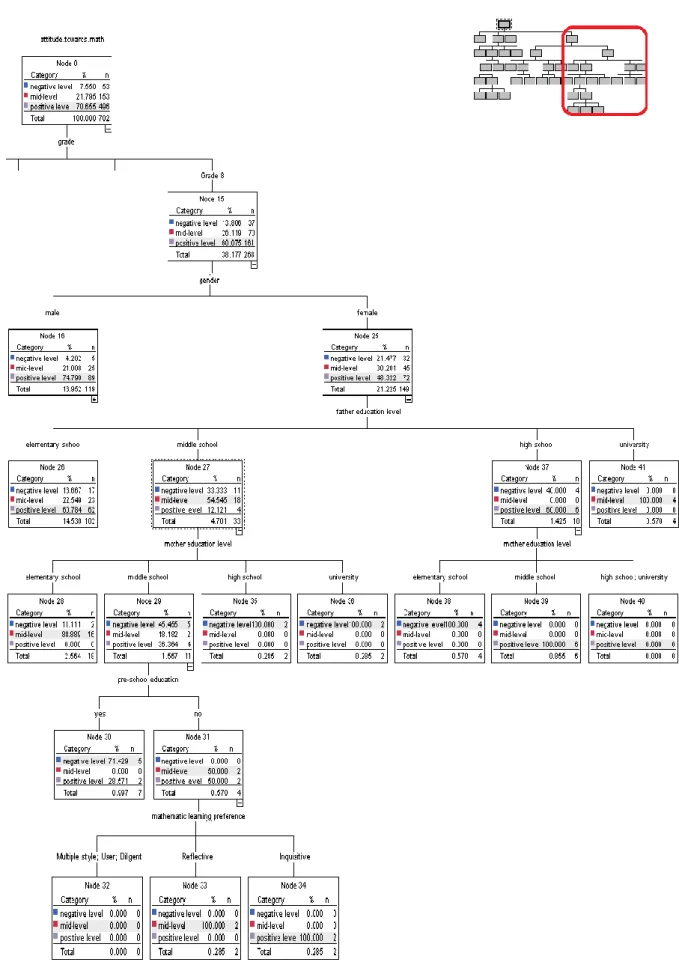
In Figure 4, Node 16 and Node 25 are divided by the gender predictor variable from Node 15. Examining Figure 3, 8th grade male students were discussed above. Remember that Node 16 consisting of male students was divided by the mother education level predictor variable. Female students (8th grade) in Node 25 will be discussed below using Figure 4. The other splitting happens here in this node with respect to the father education level input variable. Examining these two results, father education level is the most effective factor for female students to determine attitude level while mother education level is the most effective for male students. This is quite an interesting result. It is generally known that girls are fond of their fathers and boys are fond of their mothers mostly. Therefore this situation may affect the attitude. Similarly the support density provided by the mother or father may vary. This result should be deeply analyzed, too.
To stop branching, Node 26 and Node 41 generated leaves. Father education level is elementary school in Node 26 and sixty percent of students in this node have positive level attitude. Node 41 consists of students whose fathers have university degree. All of them have mid-level attitude. Both Node 27 and Node 37 are going on branching and are divided by mother education level (middle school and high school). The facts about Node 18 and Node 21 are also valid for these nodes. That is, studying in middle school and preparing for high school entrance exam, 8th grade male students whose mother/father have middle or high school degree may be in critical period for attitude towards mathematics. In Node 37, students have either positive or negative level attitude, and positive level proportions are higher than negative level. Besides, this node is also split into three terminal nodes, with respect to mother education level. Node 40 has no one. That means in this sample, there isn‟t any 8th grade female student whose father has high school degree and whose mother has high school or university degree. Node 38 consists of those whose mothers have elementary school degree. All of the students in this node have negative level attitude. On the other hand, all of the 8th grade female students whose fathers have high school degree and mothers have middle school degree have positive level attitude. There are six students in this node.
As for Node 27, students whose mothers have middle school degree have mid-level attitude mostly and negative level attitude proportions are lower than positive level attitude proportions in this node. It is divided into four child nodes with respect to mother education level input variable. These nodes involve students having negative level mostly. Due to the fact that positive level attitude was the most frequently observed in this sample, this situation should be investigated.
Node 28 which is a leaf node has a mother education level with elementary school and contains 18 students. And most of them have mid-level attitude. Node 35 and Node 36 are also leaf nodes covering up the students whose mothers have an educational degree of high school or university. And they all have negative level attitude. Thus, an interesting result emerged. If you need to review nodes 15, 25, 27, 28, 29, 35 and 36 together, following comments can be made: students whose mothers‟ education levels are higher than fathers‟ education levels have negative level attitude. Especially in Turkey, because of the fact that father is the head of the family, it may be expected by girls that their fathers should have higher education level than mothers.
It should be remembered that father education level was not seen in part 2 which shows 8th grade male students‟ attitude level, while both mother and father education levels were in part 3 which shows 8th grade female students‟ attitude level. Maybe, girls are more keen on family and more sensitive about this issue than boys. Node 29, which is one of the child nodes of Node 27, is also split into two nodes with respect to pre-school education. Node 30 consists of students who received pre-school education and seventy one percent of them have negative level attitude unlike expected. As for Node 31, students in this node didn‟t receive pre-school education and half of them have mid-level attitude while the other half have positive level.
Decision Rules
The knowledge represented by decision tree can be extracted and represented in the form of IF-THEN rules as shown in Table 2. Using C5.0 decision rules for attitude are extracted. Thus, these rules can be searched to understand some of the reasons underlying negative level attitude.
Table 2. Decision rules for attitude towards mathematics
Rule If; Then,
1
Gender=Female and Grade=8
and Mother education level= elementary school and Father education level= high school
Attitude level=negative
2
Gender=Female and Grade=8
and Mother education level= high school and Father education level= middle school
Attitude level=negative
3 Grade=8
and Mother education level= university Attitude level=negative
4
Grade=8
and Pre-school education= yes
and Mother education level= middle school and Father education level= middle school
Attitude level=negative
5 Grade=6
and Mother education level= university Attitude level= mid /medium
6
Gender=Male and Grade=8
and Pre-school education= yes
and Mother education level= high school
Attitude level= mid /medium
7
Grade=6
and Pre-school education= no
and Mother education level= middle school and Father education level= elementary school
Attitude level= mid /medium
8
Gender=Female and Grade=8
and Father education level= university
Attitude level= mid /medium
9
Gender=Female and Grade=6
and Mother education level= middle school
Attitude level= mid /medium
10
Gender=Male and Grade=8
and Pre-school education= no
and Mother education level= middle school
Attitude level= mid /medium
11
and Gender=Male and Grade=8
and Mother education level= middle school
Attitude level= mid /medium
12
Gender=Female and Grade=8
and Father education level= middle school
Attitude level= mid /medium
13 Grade=6
and Mother education level= high school Attitude level=positive
14
Gender=Female and Grade=8
and Mother education level= middle school and Father education level= high school
Attitude level=positive
15 Grade=6
• If a student is female and 8th grade and her mother‟s education level is elementary school and her father‟s education level is high school, then she has negative attitude towards mathematics.
Evaluation of Created Decision Tree Model
To evaluate the created decision tree mode, validity of the model were examined. To determine validity of the model, cross-validation, which allows using all data, was used. A cross validation method is a preferred method when the amount of data is limited. Because mentioning large amounts of data in data mining applications, is relatively more difficult to reach in educational areas, this evaluation analysis was preferred.
Cross-Validation is a statistical method of evaluating and comparing learning algorithms by dividing data into two segments: one used to learn or train a model and the other used to validate the model (Refaeilzadeh, Tang, & Liu, 2009). After the validation rate of this model is calculated, the same process is repeated by changing the roles of testing and training sets. Consequently, the model's validation rate is calculated by the average value of two independent validation rates (Berthold & Hand, 2000). Results of cross validation analysis for the decision tree created in this study, were found to be 76.56 percent and 77.53 percent. Consequently the average of these two ratios was determined to be 77.04 percent.
Findings for Research Question 2
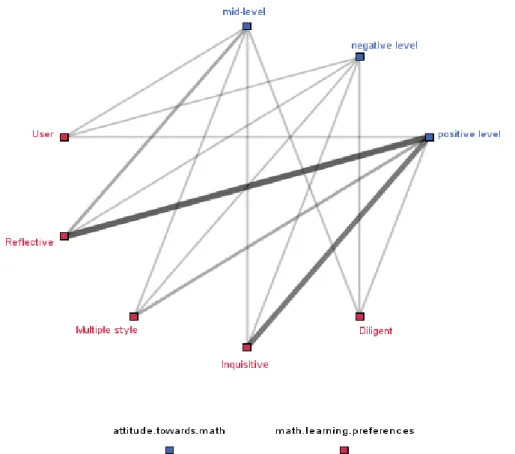
The second research question asked what the relationship between attitudes and preferences for learning math is. To answer this question, web graph, a kind of graph in Clementine 10.1 programme, was used. Web graph shows the relations among the variables using lines. The thickness of the lines shows the strength of the relationship between them. Figure 5 shows the relationship between these variables.
Answering questions in whole class work. Explaining things to the class.
Answering the teacher‟s questions, one-to-one. Explaining her/his work to the teacher, one-to-one. Answering friends‟ questions.
Explaining work to friends.
At this point, it should be questioned why the students, who have reflective learning style/preference, have positive attitudes and why the others have relatively less positive attitudes. It may be examined in future studies. There is no need to examine each links separately. For instance, the link between user learning style and mid-level attitude is thinner than the link between reflective learning style and mid-mid-level attitude. It means that the relationship between reflective learning style and mid-level attitude is stronger than the relationship between user learning style and mid-level attitude. The other relationships can be interpreted similarly. Consequently web graph provides convenience to comment visually.
Discussion and Conclusion
Generating positive attitudes towards mathematics among students is an important goal of mathematics education (Mathematics Benchmarking Report, TIMMS 1999). So, teachers and researchers should strive to develop a positive attitude towards learning mathematics considering that attitudes develop and change with time (Rubinstein, 1986). It is inferred from literature that children‟s attitudes can be influenced by a wide variety of factors. This study has gone some way to identifying what a few of these factors might be. It is thought that findings of this research will be able to give opinion to researchers, mathematics educators and parents, besides contributing to the literature.
The knowledge represented by decision tree were extracted and represented in the form of IF-THEN rules. These rules can be used in education to understand students‟ attitudes towards mathematics without using a scale. It should be accepted that these rules are not adequate to determine students‟ attitude but are important to show its usefulness. Educators can develop these rules by increasing the sample size and using much more attributes. Thus, the rules can be generalized and used in educational environment.
The created decision tree covers much information to be used for observing attitude profiles of students. Analyzing the tree, factors effecting attitude, can be listed respectively in decision tree as grade level, mothers‟/fathers‟ education level, receiving pre-school education, gender and learning preference for math. The results revealed that, in general, students held positive attitudes towards mathematics despite the lower performance in international exams. This result supports the previous comments that students had positive attitudes toward mathematics (Nicolaidou & Philippou, 2003; Mata, Monteino & Peixoto, 2012; Middleton, Ricks, Wright, Grant, 2013; Piht & Eisenschmidt, 2008; Yücel & Koç, 2011), and differentiated from the other studies (Goodykoontz, 2008; Akın, 2002) stated that students develop negative attitude to math in general. Constructed decision tree models with C5.0 algorithm revealed that all of variables used in this study have some sort of effect on the attitude towards mathematics but the most affective attribute was found to be grade level.
Grade Level and Attitude towards Mathematics
Gender and Attitude towards Mathematics
As for gender, a great deal of studies examining relationship between gender and attitude can be encountered in literature. Some of them asserted that gender has impact on attitude (Yaratan & Kasapoğlu, 2012; Middleton, Ricks, Wright, Grant, 2013; Hoang, 2008), and the others reached opposite results (Farooq & Shah, 2008; Köğce, Yıldız, Aydın & Altındağ, 2009; Mohamed & Waheed 2011; Nicolaidou & Philippou, 2003; Yücel & Koç, 2011) The proportions of positive level attitude of female students are lower than male students in both 6th and 8th grades. Similarly, Gunderson, Ramirez, Levine and Beilock, (2012), Mahanta and Islam (2012), Nicolaidou and Philippou (2003), Piht and Eisenschmidt (2008) pointed out that boys have more positive attitude towards math than girls. At the same time most of these studies mentioned that there are no statistically significant differences between girls‟ and boys‟ attitudes. Furthermore Frost, L. A., Hyde, J. S., & Fennema, E. (1994) examined 70 studies of gender differences in mathematics-related attitudes. The results of meta-analysis showed that females reported more negative attitudes than boys. Several studies give evidence that girls lack confidence in math and viewed mathematics as a male domain (Meelissen & Luyten, 2008; Odell & Schumacher, 1998; Hyde, Fennema, Ryan, Frost, & Hopp, 1990). This situation may stem from the fact that adolescent girls are more timid. Because different types of math related attitudes may reflect specific cognitive, emotional, and motivational processes, and may be therefore related to gender stereotypes in different ways (Lane, 2012).
In decision tree, gender factor has emerged at two branches including 6th and 8th grade students. Its effect on 6th grade students‟ attitude was seen after mother education level factor. However, it was the first branching for 8th grade students. This situation was considered to associate with puberty by the authors because of the fact that 8th grade students are at the age of 13-14. Therefore gender might have become a more effective factor for them.
Learning Style/Preference and Attitude towards Mathematic
In some of the research done (Peker, 2003; Peker & Mirasyedioğlu, 2008; Albayrak, 2008; Middleton, Ricks, Wright, Grant, 2013; Sırmacı, 2010), it was found that the students‟ attitudes towards mathematics showed differences according to the learning styles. Conversely, Orhun‟s (2007) research revealed that learning styles have no effect on attitudes to mathematics. In decision tree, it was found that some of students have equal scores for more than one preference/style. According to Denig (2004), individual has non-dominant learning style besides dominant learning style. And one of the general discussion in current studies about learning style is what degree of students whose dominant learning style is determined, have other learning styles (Narlı et al., 2014). So, this situation was called multiple styles by researchers in present study. Furthermore, as a result of the rough set analysis, Narlı, Özgen & Alkan (2011) reported that the potential secondary learning styles of any individual who had a primary style were identified using upper approximation sets. Consequently, fuzzy logic can be used to identify fuzzification of these styles. And it is considered to analyze deeply in further studies to find out underlying reasons.
The results of decision tree have also indicated that only two of learning styles/preferences had effect on attitude, besides, it was observed at only 8th grade female students. One of them is inquisitive and the other is reflective. Individual who prefers reflective style learns by answering questions in whole class work; answering the teacher‟s questions (one-to-one) etc. These students showed mid-level attitude. An inquisitive person learns by asking the teacher if he agrees with her/his ideas, asking for an explanation in whole-class work, asking the teacher, one-to-one, if he agrees with my ideas etc. In contrast to the results of the tree, findings, inferred from web graph, showed that one of the strongest relationships was between the students who have reflective learning style and the students who have positive level attitude towards mathematics. The students, who are reflective, have positive attitude towards mathematics generally for the entire sample while they have mid-level attitude if they are 8th grade and female and their parents have middle school degree and they did not receive preschool eduation. After all these results, it should be questioned which traditional statistical method could provide such detailed information. So, such as other areas, education sector should also benefit from data mining methods.
Parents’ Education Level and Attitude towards Mathematic
literature, Köğce, Yıldız, Aydın and Altındağ (2009), Wang (2004), Poyraz, Gülten and Bozkurt (2013), Yayan and Berberoğlu (2004) found a relationship between parental education levels and students‟ math achievement. Therefore, as mother‟s and father‟s education levels increase, it can be said that the child‟s confidence develops and level of success increases depending on providing the child with more academic guidance and support (Özan and Yüksel, 2003). As similar to literature, constructed decision tree in present study revealed that parents‟ education level has effect on attitude. When the findings of the decision tree are analyzed generally parents‟ education level is middle school degree, and it is more critical to determine middle school students‟ attitudes.
Pre-school Education and Attitude towards Mathematic
Preschool education is very important educational process which has positive effect on students‟ intellectual, emotional, social and language development (Taner & Başal, 2005). Dursun (2009) reported that students with preschool education have higher mathematical skills compared to those with no preschool education. Therefore it can be said that it has indirect effect on attitude. The findings of decision tree have also indicated that receiving pre-school education has a positive impact on attitude for 6th grade male students while the 8th grade the results for receiving preschool education are more complex.
As a result, the overall findings of the present study provided evidence for data mining techniques can contribute to the development of education. The results and the method of this study may open new perspectives in the search for education. In this regard this study covers some suggestions to the educators to show where to look at and how to design the plans. According these results, it may be advised to educators that they should take heed students personal attributes including demographic variables. Because the educators may have a students‟ personal information survey done at the beginning of year and it may guide the process of plan generation. Using student profiling through data mining will be the new competitive strength for the researchers, scholars, teachers, educators etc. in education sector. Educators can benefit from data mining by using each data collected from students or educational environments or educational databases.
Limitations
The sample size was an important limitation of this study. The number of the sample size may be quite acceptable for a far educational studies but data mining is related to large amounts of data which includes the millions in general. So the results can be more generalizable with increased number of data. But it is difficult to reach large amounts of data without using databases in educational studies. Another limitation of this study is the fact that only self-report measures were used. Observations and interviews can contribute to better identification of students‟ attributes.
Suggestions for Further Studies
As a result of present study, aims to investigate middle school students‟ attitudes towards mathematics in the context of their mathematic learning preferences using data mining, suggestions can be summarized as follows: First of all, increasing the sample size of the study may give more generalizable results. It may be done at different types of schools, in different cities, with different age groups. Also, intercultural including successful and unsuccessful countries in international exams should be included to study. By this means, conclusions containing more comprehensive information can be reached. Both more and different variables (anxiety, achievement, self-confidence, home environment, schools‟ climate and culture etc.), which might be considered to associate with attitude, can be used. In addition, it might be beneficial to compare the achievements of this research with other techniques of data mining. And different attributes can be searched by the same techniques as well.
References
Aiken, L. R (1976). Update on attitudes and other affective variables in learning mathematics. Review of Educational Research, 46, 293-311.
Albayrak, Y. (2008). Sağlık meslek lisesi öğrencilerinin öğrenme stilleri ile matematik dersine karşı tutumları arasındaki ilişki. (Unpublished master‟s thesis). Abant İzzet Baysal, Bolu, Turkey.
Aşkar, P. (1986). Matematik dersine yönelik tutumu ölçen likert tipi bir ölçeğin geliştirilmesi. Education & Science, 11(62), 31-36.
Babadoğan, C. (2000). Öğretim stili odaklı ders tasarımı geliştirme. Milli Eğitim Dergisi, 147, 61-63.
Barkatsas, A. T., Kasimatis, K., & Gialamas, V. (2009). Learning secondary mathematics with technology: Exploring the complex interrelationship between students‟ attitudes, engagement, gender and achievement. Computers & Education, 52(3), 562-570.
Barnett, W. S. (1992). Benefits of compensatory preschool education. Journal of Human Resources, 27, 279-312.
Baykul Y. (1990). Matematikle ilgili düşünceler anketi. Ankara: ÖSYM Yayınları.
Berthold, M., & Hand, D. I. (2000). Intelligent data analysis. Technometrics, 42(4), 442-442.
Betz, N. E. (1978). Prevalence, distribution, and correlates of math anxiety in college students. Journal of Counseling Psychology, 25(5), 441−448.
Denig, S. (2004). Multiple intelligences and learning styles: two complementary dimensions. Teacher College, 106(1), 96-111.
Dunn, R. (1984). Learning style: State of the science. Theory into Practice, 23(1), 10-19.
Dursun, Ş. (2009). İlköğretim birinci sınıf öğrencilerinin matematiksel becerilerinin okul öncesi eğitimi alma ve almama durumuna göre karşılaştırılması. Kuram ve Uygulamada Eğitim Bilimleri, 9, 1691-1715. Ekizoglu, N., & Tezer, M. (2009). The relationship between the attitudes towards mathematics and the success
marks of primary school students. Cypriot Journal of Educational Sciences, 2(1), 43-57.
Farooq, M. S., & Shah, S. Z. U. (2008). Students‟ attitude Towards Mathematics. Pakistan Economic and Social Review, 75-83.
Felder, R. M., & Silverman, L.K (1988). Learning and teaching styles in engineering education. Engineering Education, 78(7), 674-681.
Forster, P.A. (1999). How do I Actually Learn? A questioner for (co) participatory learning in the presence of tecnology. Proceedings Western Australian Institute for Educational Research Forum.
Frost, L. A., Hyde, J. S., & Fennema, E. (1994). Gender, Mathematics performance, and Mathematics-related attitudes and affect: A meta-analytic synthesis. International Journal of Educational Research, 21(4), 373-385.
Given, B. K. (1996). Learning Styles; A synthesized model. Journal of accelerated learning and teaching, 21, 11- 44, [Online]: http://www.ialearn.org/files_jalt/jalt_21_1996_1%20&%202.pdf Retrieved on 12.06.2005.
Goodykoontz, E. N. (2008). Factors that Affect College Students' Attitude Toward Mathematics. ProQuest. Gunderson, E. A., Ramirez, G., Levine, S. C., & Beilock, S. L. (2012). The role of parents and teachers in the
development of gender-related math attitudes. Sex Roles, 66(3-4), 153-166.
Güntürkün, F. (2007). "A comprehensive review of data mining applications in quality improvement." (Unpublished master‟s thesis). Ortadoğu Technical University, Ankara.
Han J, Kamber M (2006) Data mining: concepts and techniques, 2nd ed. Morgan Kaufmann
Hannula, M. S. (2002). Attitude towards mathematics: Emotions, expectations and values. Educational studies in Mathematics, 49(1), 25-46.
Hoang, T. N. (2008). The effect of grade level, gender and ethnicity on attitude and learning environment in mathematics in high school. International Electronic Journal of Mathematics Education, 3(1), 47-59. Hopko, D. (2003). Confirmatory factor analysis of the Math Anxiety Rating Scale Revised. Educational and
Psychological Measurement, 63, 336−351.
Hyde, J. S., Fennema, E., Ryan, M., Frost, L. A., & Hopp, C. (1990). Gender comparisons of mathematics attitude and affect. Psychology of Women Quarterly, 14, 299–324.
Karasar, N. (2009). Bilimsel Araştırma Yöntemi (19.bs.). Ankara: Nobel Yayın Dağıtım.
Kiray, S.A., Gok, B., & Bozkir, A.S. (2015). Identifying the factors affecting science and mathematics achievement using data mining methods. Journal of Education in Science, Environment and Health (JESEH), 1(1), 28-48.
Kolb, D. A. (1984). Experiential learning: Experience as the source of learning and development. New Jersey: Prentice-Hall.
Köğce, D., Yıldız, C., Aydın, M., & Altındağ, R. (2009). Examining elementary school students‟ attitudes towards mathematics in terms of some variables. Procedia-Social and Behavioral Sciences, 1(1), 291-295.
Lane, K. A. (2012). Being narrow while being broad: The importance of construct specificity and theoretical generality. Sex roles, 66(3-4), 167-174.
Leder, G. (1992). Attitudes to mathematics. Mathematics Education Research Journal, 4, 1-7.
López-Cuadrado, J., Pérez, T. A., Vadillo, J. Á., & Arruabarrena, R. (2002). Integrating adaptive testing in an educational system. In First International Conference on Educational Technology in Cultural Context. Mahanta, S. & Islam, M. (2012). Attitude of secondary students towards mathematics and its relationship to
achievement in mathematics. International Journal of Computer Technology & Applications, 3(2), 713-715.
Mata, M. D. L., Monteiro, V., & Peixoto, F. (2012). Attitudes towards Mathematics: Effects of individual, motivational, and social support factors. Child Development Research, 2012.
Mathematics Benchmarking Report, TIMMS 1999
http://timss.bc.edu/timss1999b/mathbench_report/t99bmath_chap_4_4.html Ministry of Education (2009). Middle School Mathematics Program.
Meelissen, M. & Luyten, H. (2008). The dutch gender gap in mathematics: Small for achievement, substantial for beliefs and attitudes. Studies in Educational Evaluation, 34, 82-93
Merriam, S. B., & Simpson, E. L. (2000). A guide to research for educators and trainers of adults (Updated 2nd ed.). Malabar, FL: Krieger.
Middleton, K., Ricks, E., Wright, P., & Grant, S. (2013). Examining the relationship between learning style preferences and attitudes toward Mathematics among students in higher education. Institute for Learning Styles Journal, 1(1), 1-15.
Mohamed, L., & Waheed, H. (2011). Secondary students‟ attitude towards mathematics in a selected school of Maldives. International Journal of humanities and social science, 1(15), 277-281.
Narli, S., Aksoy, E., & Ercire, Y. E. (2014). Investigation of prospective elementary Mathematics Teachers‟ learning styles and relationships between them using data mining. International Journal of Educational Studies in Mathematics, 1(1), 37-57.
Narlı, S., Özgen, K., & Alkan, H. (2011). In the context of multiple intelligences theory, intelligent data analysis of learning styles was based on rough set theory. Learning and Individual Differences, 21(5), 613-618. Nicolaidou, M., & Philippou, G. (2003). Attitudes towards Mathematics, self-efficacy and achievement in
problem solving. European Research in Mathematics Education III. Pisa: University of Pisa.
Nisbet, R., Elder, J., & Miner, G. (2009). Handbook of statistical analysis and data mining applications. Academic Press.
Odell, P. M. & Schumacher, P. (1998). Attitudes towards mathematics and predictors of college mathematics grades: gender difference in a 4-year business college. Journal of Education for Business, 74(1), 34-38 Orhun, N. (2007). An investigation into the mathematics achievement and attitude towards mathematics with
respect to learning style according to gender. International Journal of Mathematical Education in Science and Technology, 38(3), 321-333.
Özan, M. B. & Yuksel, Y. (2003) Oğrencilerin sınav kaygılarının öğrenmeleri üzerindeki etkileri. Fırat Universitesi, Eğitim Bilimleri Fakultesi, Doğu Anadolu Bölgesi Araştırmaları 3.
Özer, B. (1998). Öğrenmeyi öğretme, (Ayhan Hakan (Ed.). Eğitim Bilimlerinde Yenilikler (ss. 146–164), Eskişehir: Anadolu Üniversitesi Açıköğretim Fakültesi İlköğretim Öğretmenliği Lisans Tamamlama Programı.
Pal, S. (2012) Mining educational data to reduce dropout rates of engineeering students. International Journal of Information Engineering and Electronic Business, 2, 1-7.
Papanastasiou, C. (2000). Internal and external factors affecting achievement in mathematics: Some findings from TIMSS. Studies in Educational Evaluation, 26, 1-7.
Peker, M. (2003). Öğrenme stilleri ve 4 MAT yönteminin öğrencilerin matematik tutum ve başarılarına etkisi, Gazi Üniversitesi Eğitim Bilimleri Enstitüsü (Unpublished doctoral dissertation), Ankara.
Peker, M., & Mirasyedioğlu, Ş. (2008). Pre-service elementary school teachers‟ learning styles and attitudes towards mathematics. Eurasia Journal of Mathematics, Science & Technology Education, 4(1), 21-26. Piht, S., & Eisenschmidt, E. (2008). Pupils‟ attitudes toward mathematics: Comparative research between
Estonian and Finnish practice schools. Problems of Education in the 21st Century, 9, 97-106.
Poyraz, C., Gülten, Ç., & Bozkurt, S. (2013). Analysis of the relationship between students‟success in mathematics and overall success. International Journal on New Trends in Education and Their Implications.
Refaeilzadeh, P., Tang, L., & Liu, H. (2009). Cross-validation. In Encyclopedia of database systems (pp. 532-538). Springer US.
Randolph, T. D. (1997). An assessment of mathematics anxiety in students from grades fou through eight. (Unpublished doctoral dissertation), Southern Illinois University, United States-Illinois.
Rubinstein, M. F. (1986). Tools for thinking and problem solving. New Jersey : Prentice Hall.
Savaş, E. & Duru, A. (2005). Gender differences in mathematics achievement and attitude towards mathematics among first grade of high school. Eurasian Journal of Educational Research, 19, 263–271.
Sirmaci, N. (2010). The relationship between the attitudes towards mathematics and learning styles. Procedia-Social and Behavioral Sciences, 9, 644-648.
SPSS Inc. Clementine 10.1 Node Reference. USA: 2004.
Sternberg, R. J. (1994). Allowing for thinking styles. Educational leadership, 52(3), 36-40.
Şuşnea, E. (2009, November). Classification techniques used in Educational System. The 4th International Conference on Virtual Learning, Romania.
Taner, M. ve Başal, H.A. (2005). Farklı sosyoekonomik düzeylerde okulöncesi eğitimi alan ve almayan ilköğretim birinci sınıf öğrencilerinin dil gelişimlerinin cinsiyete göre karşılaştırılması. Uludağ Üniversitesi Eğitim Fakültesi Dergisi, 18(2), 395-420.
Taşdemir, C. (2009). İlköğretim ikinci kademe öğrencilerinin matematik dersine karşı tutumları: Bitlis ili örneği. Dicle Üniversitesi Ziya Gökalp Eğitim Fakültesi Dergisi, 12, 89-96.
Tekindal, S. (1988). Okula ilişkin tutum ile akademik başarı arasındaki ilişki. Çağdaş Eğitim, 139, 29–33. Tiwari, M., Vimal, N. (2013, February). Evaluation of Student performance by an application of Data Mining
techniques. National conference on challenges & Opportunities for technological Innovation in India, India.
Tomlinson, C.A. (2007). Öğrenci gereksinimlerine göre farklılaştırılmış eğitim.(Trans.) İstanbul: Redhouse Eğitim Yayınları.
Ulular, G.F. (1997). Ortaokul Öğrencilerinin Okul Başarılarını Etkileyen Zihinsel Olmayan Etmenler,. (Unpublished master‟s thesis). Gazi University, , Ankara, Turkey.
Yaratan, H., & Kasapoğlu, L. (2012). Eighth grade students‟ attitude, anxiety, and achievement pertaining to mathematics lessons. Procedia-Social and Behavioral Sciences, 46, 162-171.
Yayan, B. & Berberoğlu, G., (2004). A re-analysis of the TIMSS 1999 mathematics assessment data of the Turkish students. Studies in Educational Evaluation, 30, 87–104.
Yenilmez, K., & Çakır, A. (2005). İlköğretim ikinci kademe öğrencilerinin matematik öğrenme stilleri. Kuram ve Uygulamada Eğitim Yönetimi Dergisi, 11(4), 569-585.
Yücel, Z., & Koç, M. (2011). The relationship between the prediction level of elementary school students‟ math achievement by their math attitudes and gender. Elementary Education Online, 10(1), 133-143. http://www.educationaldatamining.org Retrieved on (20.05.2014)
Wang, D. B. (2004). Family background factors and mathematics success: A comparison of Chinese and US students. International Journal of Educational Research, 41(1), 40-54.
Author Information
Feriha Hande IdilDokuz Eylül University Izmir, Turkey
Contact e-mail: [email protected]
Serkan Narli Dokuz Eylül University Izmir, Turkey
Esra Aksoy