http://dx.doi.org/10.29322/IJSRP.9.12.2019.p9647 www.ijsrp.org
Development Of Physics Learning Instruments With
Guided Inquiry Learning Model By PhET
Simulation To Train Student’s Science Process
Skills On Dynamic Electricity In High School
Miftakhul Ulum*, Soetjipto*, Leny Yuanita*
*
Postgraduate Study of Science Education, Postgraduate, State University of Surabaya, Indonesia
DOI: 10.29322/IJSRP.9.12.2019.p9647 http://dx.doi.org/10.29322/IJSRP.9.12.2019.p9647
Abstract- This research aims to: developing of physic learning instruments with guided inquiry learning model by PhET simulation to train student’s science process skills on dynamic electricity in high school. The subject of this research is physics learning instrume with a guided inquiry model assisted by a PhET simulation to practice the science process skills developed and will be tested to class X in Muhammadiyah 3 High School Tulangan, academic year 2018/2019. This research consists of 2 stages, namely the first stage of developing learning instruments, and the second stage is testing the learning instruments in class. The development phase consists of four stages, namely the 4D development model (design, define, develop, dessiminate). The quality of physics learning instruments with guided inquiry learning models by PhET simulations which include: syllabus, lesson plans, student textbooks, student worksheets, and assessment after being validated by a validator can be declared as a valid, practical and effective instruments. Readability of student worksheets and student books obtained through a questionnaire can be seen that the aspects of attracting student worksheets by 86,7%, interesting appearance of worksheets by 86,7%, about the difficulty of explanation by 80% of students stated there is no difficult explanation, about the ease of understanding the illustrations/picture of 80% and about the existence of an incomprehensible statement of 83,3% of students stating there is no statement that is not understood, while in the student book it can be seen that the interesting aspect of Student Book content is 86,7%, the attractiveness of the appearance of Student Book is 86,7%, about the difficulty of explanation by 83,3% of students said there was no difficult explanation, about the ease of understanding illustrations/drawings by 86,7%. The average score of observations of the implementation of the lesson plan for all learning activities which includes: introduction, core, and closing range from 3,45 to 4 and in the good category. The reliability of the implementation of the lesson plan is 97,06%, the results show that the learning implementation plan with the guided inquiry learning model can be implemented well, by the developed lesson plan. Obstacles or obstacles found during the most dominant learning process are found in each learning activity both at the first meeting, the second and third virtual-based experiments (PhET simulations) so that sometimes time is less efficient it occurs because virtual-based experiments are a way foreign for students to practice their science process skills so that in this case need more guidance and supervision by controlling the student's experiment activities step by step, and reminding the problem of time so that not much time is wasted. And in each group it is recommended to divide the tasks, some conduct experiments and some do worksheets while still discussing/contributing opinions from one another. Also, several general factors hinder students' teaching and learning activities including the lack of support for learning space and inadequate facilities. Of how many common factors encountered have their solutions, but the most core solution lies in how the teacher reacts and acts according to the needs that should be done with all due consideration. Based on the results of the analysis, discussion, and discussion, it can be concluded that: The quality of the development of physics learning instruments with guided inquiry learning models by PhET simulation which includes: Syllabus, RPP, Student Textbooks, Student Worksheet, and assessment after being validated by the validator can be stated as instruments are valid, so that it can be used for guided inquiry learning models by PhET simulations on dynamic electrictricity material to train student’s science process skills.
http://dx.doi.org/10.29322/IJSRP.9.12.2019.p9647 www.ijsrp.org
I. INTRODUCTION
Physics is a branch of the science of nature that studies the basic elements that make up the universe, the forces at work in it, and its consequences, from this physics the development of information and communication technology that changes human life. Physics provides more dynamic methods in helping humans solve complex life problems. But in reality it was found that many students studying physics were not interested and did not have an understanding after studying physics. So educators must be more creative in presenting meaningful physics learning and the younger generation is interested in learning it.
Student interest in learning can be formed if students are actively involved in mental, physical, and social activities. In the 2013 curriculum, the benchmark of success in learning physics must be student-centered which focuses on students, not just the ability of teachers to teach. The quality of the process and student learning outcomes are determined by many factors, one of which is the availability of laboratory facilities for conducting experiments. Experimental activities are important in learning Physics because aspects of products, processes, and attitudes of students can be further developed.
Based on the results of a preliminary study in Muhammadiyah 3 Tulangan High School, there are several problems relating to learning, among which there are several obstacles in terms of student activities, (a) students are less involved in learning, so students cannot overcome problems that require authentic investigation, namely investigations that require resolution real from real problems (related to daily life). (b) the number of tools in the laboratory are damaged from year to year so that another alternative is needed so that students can still do practical work without having to damage the tools again, (c) the lack of training in the science process skills of students. Science process skills (KPS) are the ability of students to apply scientific methods in understanding, developing and discovering science. The skills of the process are observing, asking questions, formulating hypotheses, determining experimental variables, sorting the steps of the experiment, conducting experiments, analyzing experimental results data, formulating conclusions, communicating. These skills are needed so that learning does not tend to be monotonous in lectures and assignments that are charged to students, and is expected to be able to improve student learning completeness in this school which is less than KKM with completeness value 75.
The problems that occur above require a learning model that can present authentic problems and can train students' science process skills. In the guided inquiry learning model (guided inquiry) learning involves more students (student-centered), by the 2013 curriculum. The guided inquiry learning model can be the right solution because through guided inquiry learning will focus more on students. Students can conduct experiments directly through observation of a phenomenon. This can make students able to visualize abstract physics material. The guided inquiry learning model consists of six stages, namely: (a) planning, (b) revenue information, (c) processing information, (d) making information, (e) communicating information, and (f) evaluating [1]. Guided inquiry has advantages, which are as follows: (a) the understanding obtained by students is usually deeper than the understanding of lectures and explanations; (b) teaching with this model tends to produce long-term retention and transfer compared to exposure; (c) implementing lessons with this model can give very satisfying results; (d) teaching becomes student-centered, one of the principles of learning psychology states that the greater the involvement of students in the learning process, the greater the motivation for student learning and achievement [2]. Guided inquiry is more appropriate to be applied in schools compared to free inquiry. Free inquiry requires students to have adequate initial knowledge for the material being studied, have a high scientific attitude, be active in experiments, and be able to process data so that they can eventually find a new concept. This type of inquiry is difficult to implement in classes with heterogeneous students. Dynamic electrical material is abstract physics material and has a high complexity, so students often have difficulty in understanding it, in this case, they need media that can describe something abstract, one of which is by using PhET simulations to simulate virtual experiments.
Physics Education Technology or PhET is a systematic endeavor that is responsive to the development of learning technology. PhET simulation is a moving image (animated), interactive and made like a game where students can learn by exploring. The simulation emphasizes the correspondence between real phenomena and computer simulation and then presents it in physical conceptual models that are easily understood by students. This simulation can describe abstract or invisible objects in the real world, such as electron atoms, electric fields and so on. Another advantage of the PhET simulation is that it can conduct experiments ideally, this cannot be done using real tools, besides this simulation is based on a java program that has the advantages of easy java simulations specifically designed to facilitate the task of teachers in making simulations physics by utilizing computers in accordance with their fields of science [3]. PhET simulation is very suitable to be used as learning support before students carry out the actual practicum. With the help of PhET, students will more easily recognize and learn the practicum to be carried out to minimize the possibility of students damaging tools when the actual practicum is carried out.
As the guided inquiry learning of PhET simulation also has a great influence in training student’s science process skills, stating that student activity is above 80%, showing the learning done can activate students [4]. The percentage of students' perceptions was 91.03% indicating that they were very much in agreement with the learning assisted by PhET simulations. States that high school physics learning subjects of dynamic electricity using PhET simulation media and simple kits can run effectively [5], where students are generally interested in the content, media, and learning methods/models. The development research uses a guided inquiry learning model that is different from this study.
http://dx.doi.org/10.29322/IJSRP.9.12.2019.p9647 www.ijsrp.org
The research is also supported, that guided inquiry learning can improve student understanding and can train the science process skills of class XI science students of SMA Negeri 2 Kuta 2011/2012 [7].
The problems that occur above require a learning model that can present authentic problems and can train students' science process skills, due to the need for learning tools and simulations before actual practice is implemented to minimize damage to laboratory equipment, and inquiry learning model for high school students was developed. Second semester dynamic electrical material which is oriented on PhET simulation and will be developed in the syllabus, lesson plans, worksheets, student textbooks and assessment and observation instruments that allow educators and students to learn.
Based on the background, the researcher will develop learning instruments through research with development of physics learning instruments with guided inquiry learning model by PhET Simulation to train student’s science process skills on dynamic electricity in high School.
II. EXPERIMENTAL METHOD
2.1 General Background of Research
The main purpose of this research to development of physics learning instruments with guided inquiry learning model by PhET simulation. The guided inquiry learning model consists of six stages, namely: (a) planning, (b) getting information, ( c) processing information, (d) making information, (e) communicating information, and (f) evaluating. The resulting learning instruments include a syllabus, lesson plan (RPP), Student Activity Sheet (LKS) for Student Textbooks (BAS) and assessment instruments.
2.2 Sample of Research
The subject of this research is physics learning instrume with a guided inquiry model assisted by a PhET simulation to practice the science process skills developed and will be tested to class X in Muhammadiyah 3 High School Tulangan, academic year 2018/2019 on dynamic electricity material.
2.3 Instrument and Procedures
This research consists of 2 stages, namely the first stage of developing learning instruments, and the second stage is testing the learning instruments in class. The development phase consists of four stages, namely the 4D development model (design, define, develop, dessiminate).
2.4 Data Analysis
Data or information to be analyzed in this study include the data of the validity of the learning kit, observational data and student response data to learning, and the results of student’s critical thinking.
a. Analysis of the Validity of Learning Instruments
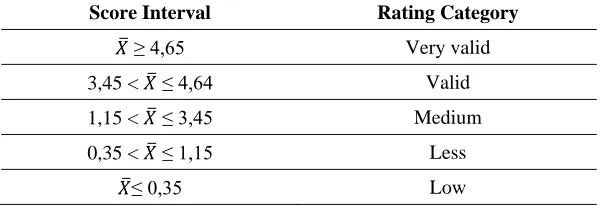
[image:3.612.157.458.494.597.2]Syllabus, lesson plans, student worksheets, and student books that have been developed will be reviewed by experts and practitioners to provide assessments. Data validation results were analyzed using qualitative descriptive analysis techniques, because the data obtained in the form of an average number (𝑋̅) from the results of the assessment of the validators were further categorized, to determine the level of validity of the assessment sheets developed by matching them with the validity assessment criteria as follows [8].
Table 2.1 Criteria for Categorizing the Validity Assessment
Score Interval Rating Category
𝑋̅ ≥ 4,65 Very valid
3,45 < 𝑋̅ ≤ 4,64 Valid
1,15 < 𝑋̅ ≤ 3,45 Medium
0,35 < 𝑋̅ ≤ 1,15 Less
𝑋̅≤ 0,35 Low
b. Analysis of Readability of Student Worksheets and Student Books
Analyst readability of the Student Worksheet and Student Book is done in a descriptive qualitative way by asking students to provide corrections regarding the readability of the Student Worksheet and Student Book. The results of student corrections are then based on positive and negative responses of students in filling out the LKS readability questionnaire sheets and Student Books. c. Learning Implementation Analysis
Data from observing the implementation of the lesson plan were analyzed by calculating the average score given by 2 observers to the implementation of the steps in the lesson plan at each face-to-face. The score categories for each aspect observed are as follows: Score 0 – 1,0 : not good
Score 1,1 – 2,0 : less
Score 2,1 – 3,0 : good enough Score 3,1 – 4,0 : good
http://dx.doi.org/10.29322/IJSRP.9.12.2019.p9647 www.ijsrp.org
Data or information about student’s responses to learning is obtained by distributing questionnaires to students. Students respond to learning by choosing statements that are by their own volition which consists of 2 categories namely yes and no or is called the Guttman scale. Students answer Yes is worth (1) and students answer No value (0). Data were analyzed based on groups of respondents who answered: "Yes" and groups of respondents who answered "No". Mathematically it can be written as follows:
𝑃 =Σ𝐾
ΣN𝑥100%
Information:
P : Percentage score of student responses
∑K : Number of students who chose the answer Yes or No ∑N : Number of students who filled out the questionnaire
The percentage of student responses converted with the following criteria [9]: Figures 0% - 20% = Very weak
Figures 21% - 40% = Weak Figures 41% - 60% = Enough Figures 61% - 80% = Strong Figures 81% - 100% = Very strong
e. Completeness Analysis of Student Learning Achievement
Data analysis of student learning achievement using qualitative descriptive analysis techniques aims to describe the completeness of student learning achievement (complete/incomplete). Data to be analyzed are pretest and posttest data. To describe the pretest and posttest data, the mastery learning reference is used by the Minimum Mastery Criteria, ie students are said to have finished learning if they have absorbed at least 70%, while classical completeness is achieved if at least 85% of students in the class have finished learning. The mastery of individual and classical learning is calculated by the following formula.
𝑃𝑖𝑛𝑑𝑖𝑣𝑖𝑑𝑢𝑎𝑙= (𝑛𝑢𝑚𝑏𝑒𝑟 𝑜𝑓 𝑖𝑛𝑑𝑖𝑐𝑎𝑡𝑜𝑟𝑠 𝑟𝑒𝑎𝑐ℎ𝑒𝑑
𝑡ℎ𝑒 𝑠𝑢𝑚 𝑜𝑓 𝑎𝑙𝑙 𝑖𝑛𝑑𝑖𝑐𝑎𝑡𝑜𝑟𝑠 ) 𝑥100%
𝑃𝑐𝑙𝑎𝑠𝑠𝑖𝑐𝑎𝑙= (
𝑡ℎ𝑒 𝑛𝑢𝑚𝑏𝑒𝑟 𝑜𝑓 𝑠𝑡𝑢𝑑𝑒𝑛𝑡𝑠 𝑤ℎ𝑜 ℎ𝑎𝑣𝑒 𝑐𝑜𝑚𝑝𝑙𝑒𝑡𝑒𝑑
𝑡ℎ𝑒 𝑡𝑜𝑡𝑎𝑙 𝑛𝑢𝑚𝑏𝑒𝑟 𝑜𝑓 𝑠𝑡𝑢𝑑𝑒𝑛𝑡𝑠 ) 𝑥100%
The completeness of each indicator is calculated using the formula:
𝐶𝑜𝑚𝑝𝑙𝑒𝑡𝑒𝑛𝑒𝑠𝑠 𝑜𝑓 𝑡ℎ𝑒 𝑖𝑛𝑑𝑖𝑐𝑎𝑡𝑜𝑟 =Σstudents who reach indicators
Σall student 𝑥100%
An indicator is complete when at least 70% of students reach the indicator. Achievement of basic competencies is calculated using the formula:
𝐴𝑐𝑐𝑒𝑠𝑠𝑖𝑏𝑖𝑙𝑖𝑡𝑦 𝐾𝐷 =Σcomplete indicator Σall indicators in KD𝑥100%
Ministry of National Education explains that students are said to have mastered basic competencies if the KD achievement is 100% or all indicators in the KD are complete. If the achievement of KD students ˃50%, students can learn the next KD by following the remedial for indicators that have not been completed. But if the KD achievement of students siswa50%, students can not learn the next KD.
f. Analysis of the Results of Science Process Skills Tests
Data on learning achievement of student’s science process skills was obtained from performance tests in the form of student performance tests in conducting learning activities under the observation of two people. Students are said to be complete if the grades can meet the KKM or a value of more than 75. The aspects of science process skills assessed, namely the ability to formulate problems, formulate hypotheses, identify variables, analyze data and make conclusions. Students' science process skills are analyzed through the science process skills rubric.
g. Analysis for Student Response Data
Data about student responses were obtained from student questionnaire responses to learning activities and then analyzed using descriptive qualitative. The response data obtained are used to follow up on learning activities using the guided inquiry model. Analysis of student response questionnaire data using the Guttman scale. Students answer Yes is worth (1) and students answer No value (0). Then analyzed based on the group of respondents who answered "Yes" and the group of respondents who answered "No". And mathematically it can be written as follows:
𝑃 =Σ𝐾
ΣN𝑥100%
Information:
P : Percentage score of student responses
∑K : Number of students who chose the answer Yes or No ∑N : Number of students who filled out the questionnaire
The percentage of student responses converted with the following criteria [9]: Figures 0% - 20% = Very weak
http://dx.doi.org/10.29322/IJSRP.9.12.2019.p9647 www.ijsrp.org
Figures 61% - 80% = Strong Figures 81% - 100% = Very strong
h. Analysis of Learning Obstacles
Constraints during the implementation of teaching and learning activities were analyzed with qualitative descriptive that is the observer and the researcher gave notes of the obstacles that occurred in the implementation of learning as much as two meetings accompanied by advice from the observer.
III. RESULT AND DISCUSSION
Based on the results of the analysis of research data and discussion of the discussion of research results related to the research questions obtained thats syllabus is needed as a reference in developing lesson plans. Therefore, before developing the lesson plan, a syllabus must be available. learning (4,40), learning activities (4,50), time (4,00), tools and teaching materials (4,13) and assessment are (4,00) with valid categories and can be used with a little revision. This shows that the syllabus developed has fulfilled the existing components, as the syllabus rules are made according to Process Standards so that the syllabus that has been developed is feasible to be implemented with a few revisions. Learning Implementation Plan is a guide for a teacher in carrying out learning activities in the classroom that provides direction for student learning activities to achieve KD. The RPP is arranged by the development of learning instruments by PhET simulation. The aspects assessed from the validation of the lesson plan are (components of learning achievement (4,25), learning activities (4,38), time (4,00), learning instruments (4,50), presentation methods (4,38) and language is based on (4,00). Based on the data, it can be stated that the average value in the assessment of the validated lesson plan components includes the learning objectives component, learning activities, time, learning instruments, presentation methods and language with valid categories. Textbooks that have been independently developed by researchers who provide material reviews by KD and learning objectives. The development of this Student Textbook is motivated by looking at KD 5.1, which is formulating the electrical quantities of simple closed circuits (one loop) and KD 5.2, namely identifying the application of AC and DC electricity in daily life on current, voltage and resistance material. This textbook was developed from several references so it is easy for students to understand and understand. The textbook consists of: competency standards and basic competencies, introduction, concept maps of the objectives to be achieved and accompanied by examples of questions and exercises, science info, charts or pictures that support illustrations in the description of the material, experimental activities using tools and simple materials that can be done by students, material summary, references and glossary. There are three aspects assessed from BAS validation, namely: (1) content worthiness, (2) language, (3) presentation. Based on data, it can be stated that the average value of the validated Student Textbook components includes: the content eligibility component (4,18), the linguistic component (4,09), and the presentation component is (4,00) with valid category. Worksheets are developed as a guide for students to carry out experiments. The worksheet contains activities that train some of the science process skills taught including making problem formulations, formulating hypotheses, identifying variables, carrying out PhET simulations before experiments, compiling observational data, analyzing data and making conclusions on observations. Based on data aspects assessed by LKS, namely: guidance aspects (4,17), content eligibility (4,24), Science Process Skills (4,00), procedures (4,25) and questions of (4,00) with all valid categories. Learning objectives can be measured by using the achievement test/assessment test instrument Assessment test is equipped with a grid of questions. The grid is used as a reference so that the assessment test is by the learning objectives that have been set and each learning objective gets a portion of the questions to be tested. In addition to knowing the level of achievement of learning competencies, the assessment also serves as feedback for teachers in improving the methods, approaches, and learning resources used. There are three aspects assessed from validation of assessment, namely: (1) products and (2) science process skills. Based on data, it can be stated that the average value of each aspect of the product learning achievement test is (4,38) and the process is (4,18) with an average validation result of (4,21) valid categories.
LKS readability data and Student Books were obtained through a questionnaire. The results of student corrections are then based on positive and negative responses of students.. Based on the data table, it can be seen that the aspect of attracting the contents of the worksheet is 86,7%, attracting the appearance of the worksheet by 86,7%, about the difficulty an explanation of 80% of students stated there was no difficult explanation, about the ease of understanding illustrations/pictures by 80% and the existence of an incomprehensible statement of 83,3% of students stated there was no statement that was not understood. The results of the readability assessment of student books showed that the aspect of attracting the contents of student books was 86,7%, attracting the appearance of Student Books by 86,7%, about the difficulty of explanation by 83,3% of students stating there was no difficult explanation, about the ease of understanding illustrations/pictures amounted to 86,7%. The results of the assessment both on the worksheet and student book show that the instrument is interesting both in content and appearance and easy to understand, so the book is worthy of being used as a guide to help students in the learning process.
RPP implementation data is obtained through a questionnaire. The results of observers at 3 learning meetings. Based on the data table, observations of the implementation of this learning carried out at three meetings with the observed aspects include (1) introduction, (2) core activities, and (3) closing activities. From the observations of the data of the two observers obtained the average preliminary observations in three meetings of 3,65% with a good category, core activities which include planning an average of 3,65%, core activities consisting of six aspects, among others (1) planning an average of 3,62%, (2) getting information on average of 3,50%, (3) processing information at an average of 3,63%, (4) making information on average of 3,52%, (5) analyzing information on average 3,83%, (6) evaluating an average of 3,33%, and finally the closing average in three meetings was 3,66%, and the overall average of the introduction, core, and cover was 96,08% in the good category.
http://dx.doi.org/10.29322/IJSRP.9.12.2019.p9647 www.ijsrp.org
sequence. The data shows that the completeness of product objectives in the pretest has not been achieved, because the percentage of completeness of the product objectives is still below 75%. After carrying out problem-based learning with the help of PhET simulation, the posttest results showed that of the 20 product indicators there were 16 completed indicators or the completeness of the indicators/objectives of 80%. Unfinished product goals are goals 4, 10, 13 and 18 indicators. The number of students who finished at goal 4 was 21, at goal 10 there were 17 students and at goal 13 there were 19 students. Whereas for the 18th destination, only 15 students. The results of the pretest process skills include formulating problems, formulating hypotheses, planning experiments (identifying experimental variables), carrying out experiments, recording experimental data, analyzing data and drawing conclusions that no students have been completed, so completeness of process skills indicators is 0%, after learning based the problem is aided by a PhET simulation, the posttest results indicate the completeness of the goal of problem solving skills is reached with a percentage of 100%. This shows that students can master the process skills well Based on the description above, it can be said that the learning of incur mentor assisted by PhET simulation can improve the completeness of the objectives.
Data on the results of learning the aspects of product skills were obtained from giving pretest at the beginning and posttest at the end of the learning sequence. The data shows that the completeness of the objective aspects of knowledge in the pretest has not been achieved, because the scores obtained by students are below the KKM (75). After conducting guided inquiry learning assisted by PhET simulations, the average student score is above 75, only 6 students are incomplete out of 30 students, in the sense that there are 20% of all incomplete students, so the mastery of learning outcomes in a classical product can be said to reach 80%. The data shows that the average score obtained by students is below the KKM (75), so individually there are no students who complete it. After the learning process has been carried out, the average student scores above 75 only 5 students who did not complete out of 30 students in the sense that there were 16,67% of the total students who did not complete, so the mastery of learning achievement of the product can be said to be classically achieved (83,3%). The results of completeness of individual affective student values at the first meeting of 86%, the second meeting of 92,6% and the third meeting of 95,7% with an average percentage of 91,59%. This shows that the effective value of students is above 80% so it can be categorized as very high grades. Also, viewed from the reliability of the instrument at the first meeting that is equal to 92% while at the second and third meetings is the same that is equal to 95% with an overall average of 93,89%. This shows that the values are above 75%, so they are categorized as reliable.
The Ministry of National Education in 2006 explained that students were said to have mastered Basic Competence (KD) if all the indicators in the KD were complete. indicators in KD include formulating the problem, formulating hypotheses, determining research variables consisting of manipulation variables, response variables and control variables that use simulations, carrying out experiments based on PhET simulations, procedures in LKS, compiling observational data in data tables, analyzing data, drawing conclusions. The indicators in the KD in the pretest have not been achieved, because the scores obtained by students on average below the KKM (75), so individually there are no students who complete. After carrying out the development of a physics learning device with a guided inquiry learning model assisted by a PhET simulation, the process skills pretest results were obtained which showed that formulating the problem 80%, formulating the hypothesis 87%, determining the research variables consisting of 77% manipulation variable, 87% response variable as well as control variables that use a 90% PhET simulations, carry out experiments based on a PhET 90 simulations, 90% LKS procedures, compile observational data in 90% data tables, analyze 93% data, draw 87% conclusions, pretest results do not most students master all basic competencies. The total number of 30 students was only 5 remedial students or 83,33% of students were complete. The results of indicators in KD, as a follow-up, the 5 students are allowed to learn the KD further, after participating in remedial for indicators that have not been completed. The Ministry of National Education in 2006 explained that students were said to have mastered Basic Competence (KD) if all the indicators in the KD were complete. Most students master all basic competencies and the total number of 30 students was only 5 remedial students or 83, 33% of students were complete. As a follow-up, the 5 students are allowed to study KD in the future, after taking remedial for incomplete indicators.
The results of the analysis of student responses shows that 89,45% of students feel attracted to the components (teaching materials, Student Books, worksheets, learning atmosphere, exercises with the PhET media and the way the teacher teaches), while several 10,55% of students expressed less interest. Student responses to the renewal of the component indicate that 90% of students stated new. Whereas 10% of students said that they were not new. Student responses to the development of the device and the implementation of learning during the trials showed that 91.33% of students stated new things while 8.67% of students stated that it was not easy, thus almost all students said the components were easy to understand. Student responses to the renewal of the process skills component showed that 95% of students stated new things, while 5% of students stated not new. Thus almost all students stated that the process skills component was new. 84% of students responded that the process skills component was easy to follow during the learning activities, while 16% of students stated that the process skills component was difficult. Student responses using PhET applied to the next subject and applied to other subjects are 93,33%. The students' responses to the teacher's explanation at the time of the KBM took place and the teacher's guidance when working on the worksheet stated that 90% were clear while 10% of the students stated unclear or unclear. Several 86,67% of students responded that the items tested were easy, whereas, in terms of the updating of the items, 88.33% of students stated that the items were new, while 11,67% of the other students stated that the items included were lacking or not new. This is because the items are not only in the form of theoretical tests but also in the form of process performance tests.
http://dx.doi.org/10.29322/IJSRP.9.12.2019.p9647 www.ijsrp.org
with the test divided into 2 sessions. The third obstacle Not all computers can function/work optimally when used. This obstacle is overcome by choosing which computer positions are more and more supportive to use
IV. CONCLUSION
Based on the results of the analysis, discussion, and discussion, it can be concluded that: The quality of the development of physics learning instruments with guided inquiry learning models by PhET simulation which includes: Syllabus, RPP, Student Textbooks, Student Worksheet, and assessment after being validated by the validator can be stated as instruments are valid, so that it can be used for guided inquiry learning models by PhET simulations on dynamic electrictricity material to train student’s science process skills.
ACKNOWLEDGMENT
Authors wishing to acknowledge assistance or encouragement from supervisor, colleagues and Acknowledgments section immediately following the last numbered section of the paper.
REFERENCES
[1] Branch J & Oberg D 2004 Focus On Inquiry A Teacher Guide To Implementing Inquiry Based Learning Canada: Alberta Education [2] Eggen P D & Kauchak D P 1996 Strategy for Teachers Singapore: Allyn and Bacon
[3] Fatik Z & Madlazim 2012 Pengembangan Perangkat Pembelajaran Fisika Dengan Lab Virtual PHETPada Materi Gelombang Elektromagnetik Di SMAN 1 Kutorejo
E Journal UNESA Diunduh dari http://ejournal.unesa.ac.id/article/6031/32/article.pdf
[4] Yusuf & Subaer2013 Pengembangan Perangkat Pembelajaran Fisika Berbasis Media Laboratorium Virtual Pada Materi Dualisme Gelombang Partikel Di SMA Tut Wuri Handayani Makasar Jurnal Pendidikan IPA Indonesia 2 2 189-194 Diunduh dari http://journal.unnes.ac.id/nju/index.php/jpii
[5] Samsuri 2010 Pengembangan Perangkat Pembelajaran Berbasis Media Simulasi Phet Dan Kit Sederhana Pada Pembelajaran Fisika Sma Pokok Bahasan Listrik Dinamis Tesis tidak dipublikasikan Surabaya: Universitas Negeri Surabaya
[6] Ulfa S Manurung B & Edi S 2014 Pengaruh Pembelajaran Berbasis Masalah Terhadap Kemampuan Berfikir Tingkat Tinggi (Menganalisis, Mengevaluasi, Mencipta) Dan Keterampilan Proses Sains Mahasiswa STIPAP LPP Medan Program Pascasarjana UNIMED Medan Diunduh dari http://digilib.unimed.ac.id/4839/1/Fulltext.pdf [7] Juliawan D 2014 Pengaruh Model Pembelajaran Berbasis Masalah Terhadap Pemahaman Konsep Dan Keterampilan Proses Sains Siswa Kelas XI IPA SMA Negeri 2 Kuta Tahun Pelajaran 2012/2013 Jurnal Pascasarjana Universitas Pendidikan Ganesha Diunduh dari http://pasca.undiksha.ac.id/ejournal/index.php/jurnal_ipa/article/download/400/192
[8] Ruddinnillah, A. (2011). Pengembangan buku siswa dan lembar kegiatan siswa inovatif fisika dengan pendekatan inkuiri untuk melatihkan keterampilan proses siswa
kelas X SMK. (Tesis tidak dipublikasikan), Universitas Negeri Surabaya, Surabaya.
AUTHORS
First Author – Miftakhul Ulum, M.Pd., Postgraduate Study of Science Education, Postgraduate, State University of Surabaya, Indonesia,
Second Author – Dr. Soetjipto, M.S., Postgraduate Study of Science Education, Postgraduate, State University of Surabaya, Indonesia.
Third Author – Prof. Dr. Leny Yuanita, M.Kes., Postgraduate Study of Science Education, Postgraduate, State University of Surabaya,