THE IMPACT OF LOGO DESIGN TOWARDS CUSTOMER’S
BRAND IMAGE PERCEPTION: A RESEARCH OF LOGO
SHAPES AND COLORS IN THE HOTEL INDUSTRY
Munawaroh Swiss German University
Abstract
Brand image is how a brand perceived by the customer. The brand image perception shaped by certain attributes of the company that has been delivered through Corporate Visual Identity (CVI). CVI is a visible elements of a brand, often regarded as one aspect that creates company’s image through logo or symbol. The purpose of this research was to determine the significant impact between shapes and colors used in logo design and customers’ brand perception in hotel industry. This research was done with quantitative method where the data was primarily collected through distributing the questionnaires. The data collecting process involves 100 respondents who reside in the Greater Jakarta Area. Multiple regression analysis in SPSS version 21.0 was used to analyze the data. The result of this research showed that both shapes and colors used in the logo have strong impact on how brand image perceived by the customers. Shapes of the logo influence the brand image perception with a percentage of 92.5%, while colors affect the brand image perception with a percentage of 92.4%. Based on the result, it can be concluded that applying certain shapes and colors in the logo design can help hotel industry to enhance the desired brand image and create a strong brand positioning in the market.
Keywords: Logo Design, Brand Image, Shapes, Colors, Hotel Industry
Introduction
Corporate Identity is described as the communications, impressions, and personality projected by an organization (Mullins & Orville C Walker, 2010). Corporate Identity aids the company to shape the right image for the customer to perceive. One of the essential parts that shape corporate identity is the logo, which is also known as Corporate Visual Identity (CVI). An effective logo must be able to portray the company’s values and present clear messages and images of the company.
The objective of this research is to understand the correlation between shapes and colors in logo design towards how customers perceive the brand. Hence, the hypotheses can be presented as follows:
H01: The shapes of the logo will not build certain perception of a brand which
defines the company brand’s personality.
H02: The colors of the logo will not build certain perception of a brand which
defines the company brand’s personality.
Literature Review
Logo :As one of the marketing tool, logo has specific purpose for the company. The functions of logo based on Rustan (2010):
1. Corporate Identity, to show the specific characteristic a company has. 2. Ownership, to differentiate one company to another.
3. Quality assurance 4. Avoiding piracy
Brand: is a unique design, sign, words, or a combination of these, employed in creating an image that identifies a product or company (Business Dictionary, 2014). A distinctive brand of a company will help the company to stand out among competitors, and thus creates images for customer to perceive. The images will further be associated with the corporate identity, including its quality, standard, and value. The branding process through visual identity when undertaken properly, will outcome a significant impact. According to Brand Cookbook (Holland & Surya, 2012), a brand is the result of combining all elements, characteristic and emotional experience, from which customers gain a unique offering in terms of reputation, consumer experience, implicit promises, price, attitude, and many more.
benefits defined as the personal value and meaning that consumers attach to the product or service attributes (Keller, 2013).
Aaker Brand Personality Scale : Brand personality is defined as the set of human characteristics associated with a brand. Five dimensions of brand personality are sincerity, excitement, competence, sophistication, and ruggedness. Each dimension then consists of several traits that belong to the group. (in Munir and Marchetti 2011 ).
Methodology
This research follows a descriptive and causal study method as was conducted to gain knowledge by analyzing the variables and to measure the impact of logo design towards brand perception. The primary research data was gathered from the questionnaire that distributed to the citizen in Greater Jakarta Area. The research emphasizes on citizen’s basic knowledge about hotel brand and how a logo design of the hotel affected the hotel brand’s personality. The questionnaire consisted of 21 close ended questions with 4 general questions regarding respondents’ demographic profile, 1 colorblind test question to ensure that respondent participated in the questionnaire do not suffer from color blindness. There are also 8 questions with shapes as stimulus and another 8 questions with colors as stimulus, and the respondents would choose the answer based on the Aaker Brand Personality Scale characteristics.
Table 1
Questionnaire Outline
Category Source
Demographic General Questions
Color Blindness Test Dr. Shinobu Ishihara Color Blindness Test derived from Colblindor (2010)
Logo Shapes 8 shapes with specific meaning in logo design derived from Bradley(2010) and Wilde (2013):
Circle
Rectangles and Squares Triangles
Vertical Lines/ Shapes Horizontal Lines/ Shapes Curves
Sharp Angles Spirals
Logo Colors 8 colors with specific meaning in logo design derived from Labrecque & Milne (2011) and Cerrato (2012):
Category Source
Brand Image Perception The Aaker Brand Personality Scale derived from Aaker (1997) in Muniz & Marchetti (2010):
Sincerity Excitement Competence Sophistication Ruggedness
Figure 1
Conceptual Framework
Data Testing, pre- testing was done in order to validate the questionnaires. The pre-test conducted by distributing 30 questionnaires to the preliminary example online. The result of this 30 questionnaire was analyzed using SPSS. After the questionnaires were distributed to the respondents, the post test was conducted. Post testing provides analysis of validity and reliability by using SPSS as the analytical tool. In post test, stated hypotheses of the research are being analyzed and also checks whether the collected data through the distributed questionnaires goes in accordance to the research purpose.
Results and Discussion
Hypothesis Testing 1
The first hypothesis will test whether the shapes of the logo will build certain perception of a brand which defines the company brand’s personality.
Model Summary
In the model summary table, R Square value will determine how great the independent variable affects the dependent variable.
Table 1
Model Summary (Shape)
Mode l
R R Square Adjusted R Square
Std. Error of the Estimate
1 .962a .925 .924 12.690
a. Predictors: (Constant), Shape
From the model summary table of shape, it can be seen that the R Square value for shape is 0.925, which means that 92.5% of the dependent variable (brand image perception) affected by the logo shape. The other 7.5% caused by other factors not mentioned in the model.
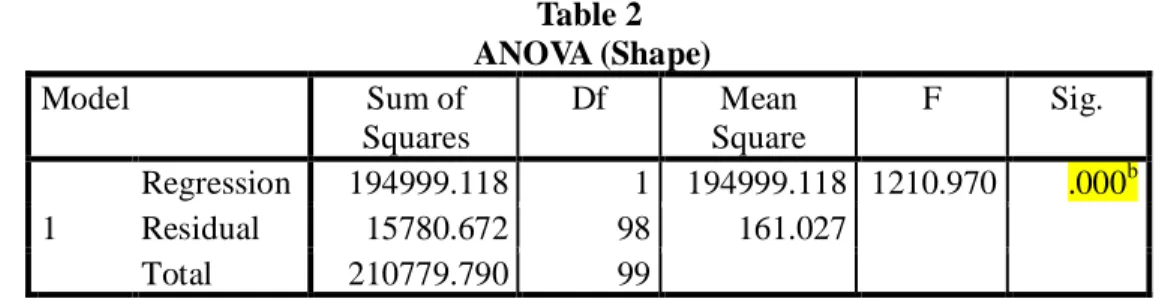
ANOVA
ANOVA (Analysis of Variance) table is used to determine whether the independent variable can be used to measure the pre-determined dependent variable. The ANOVA table of the shape variable is shown below:
Table 2 ANOVA (Shape)
Model Sum of
Squares
Df Mean
Square
F Sig.
1
Regression 194999.118 1 194999.118 1210.970 .000b
Residual 15780.672 98 161.027
Total 210779.790 99
Hypotheses
H0: Regression model can be used to determine the dependent variable
H1: Regression model cannot be used to determine the dependent variable
Decision Making
If the Sig. value is < ( = 0.05), H0 is not rejected, H1 is rejected
If the Sig. value is > ( = 0.05), H0 is rejected, H1 is not rejected
Result
The sig. of shape variable in ANOVA table shows the value of 0.000 (< ), which means that H0 is not rejected and H1 is rejected. Therefore, shapes can be used to
determine the brand image perception.
Coefficients
The coefficients table is used to determine whether the proposed hypothesis is approved or rejected. The coefficients table of variable X1 (shape) is shown below:
Table 3 Coefficients (Shape)
Model Unstandardized
Coefficients
Standardized Coefficients
t Sig.
B Std. Error Beta
1 (Constant) 11.846 2.177 5.442 .000
Shape 1.844 .053 .962 34.799 .000
a. Dependent Variable: BIP Hypotheses
H01: The shapes of the logo will not build certain perception of a brand which
defines the company brand’s personality.
H1: The shapes of the logo will build certain perception of a brand which defines
the company brand’s personality. Decision Making
If the Sig. value is > ( = 0.05), H0 is not rejected, H1 is rejected
If the Sig. value is < ( = 0.05), H0 is rejected, H1 is not rejected
Result
The sig. of shape variable in the coefficients table shows the value of 0.000, which is lesser than (0.05). This means that H0 is rejected and H1 is not rejected.
Hypothesis Testing 2
The second hypothesis will test whether the colors of the logo will build certain perception of a brand which defines the company brand’s personality.
Model Summary
In the model summary table, R Square value will determine how great the independent variable affects the dependent variable.
Table 4
Model Summary (Color)
Mode l
R R
Square
Adjusted R Square
Std. Error of the Estimate
1 .961a .924 .923 12.766
a. Predictors: (Constant), Color
From the table above, R Square value of color is 0.924, which explained that 92.4% of the brand image perception of a company is influenced by the color selection used in a logo. The other 7.6% caused by other factors not mentioned in the model.
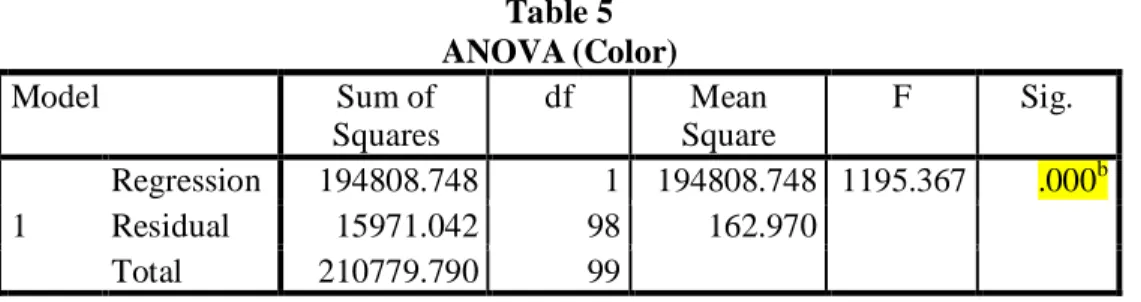
ANOVA
ANOVA (Analysis of Variance) table is used to determine whether the independent variable can be used to measure the pre-determined dependent variable. The ANOVA table of the color variable is shown below:
Table 5 ANOVA (Color)
Model Sum of
Squares
df Mean
Square
F Sig.
1
Regression 194808.748 1 194808.748 1195.367 .000b
Residual 15971.042 98 162.970
Total 210779.790 99
a. Dependent Variable: BIP b. Predictors: (Constant), Color Hypotheses
H0: Regression model can be used to determine the dependent variable
H1: Regression model cannot be used to determine the dependent variable
Decision Making
If the Sig. value is < ( = 0.05), H0 is not rejected, H1 is rejected
Result
The sig. of color variable in ANOVA table shows the value of 0.000 (< ), which means that H0 is not rejected and H1 is rejected. Therefore, colors can be used to
determine the brand image perception.
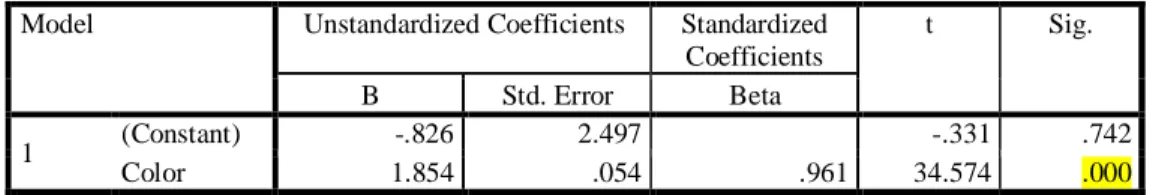
Coefficients
The coefficients table is used to determine whether the proposed hypothesis is approved or rejected. The coefficients table of variable X2 (color) is shown below:
Table 6 Coefficients (Color)
Model Unstandardized Coefficients Standardized Coefficients
t Sig.
B Std. Error Beta
1 (Constant) -.826 2.497 -.331 .742
Color 1.854 .054 .961 34.574 .000
a. Dependent Variable: BIP
Hypotheses
(H02): The colors of the logo will not build certain perception of a brand which
defines the company brand’s personality.
(H2): The colors of the logo will build certain perception of a brand which defines
the company brand’s personality. Decision Making
If the Sig. value is > ( = 0.05), H0 is not rejected, H1 is rejected
If the Sig. value is < ( = 0.05), H0 is rejected, H1 is not rejected
Result
The sig. value of color variable in the coefficients table is 0.000. The value is lesser than (0.05). Thus, H0 is rejected and H1 is not rejected. The test proves
that the colors of the logo will build certain perception of a brand which defines the company brand’s personality.
Conclusion
The conclusions of this research are as follows:
1. Relationship between logo shape and brand image perception
shape of the logo. The brand image perception is generated from the brand personality measured by the Aaker Brand Personality Scale.
2. Relationship between logo color and brand image perception
Multiple regression analysis conducted in previous chapter proved that color used in a logo is significantly influence brand image perception with the percentage of 92.4%. It conclude that the brand image of the hotel company is greatly affected by the color of the logo. The brand image perception is generated from the brand personality measured by the Aaker Brand Personality Scale.
Furthermore, practical recommendations are made for the hotel company in greater Jakarta Area in order to gain better understanding about Corporate Visual Identity (CVI) in term of logo and how it best applied to create the desired brand image perception through the utilization of shapes and colors.
1. It has been proven that the shape used in logo will determine how a brand perceived by the customers. Therefore, certain shape should be applied to create the desired personality of the hotel company. The personality will then be categorized into several dimensions in the Aaker Brand Personality Scale to define how the image of the brand is perceived by the customers. Some of the examples of shapes and its application in logo design are as follows:
o If a hotel company desired to be seen as a sincere establishment, it is recommended for the company to use circle or horizontal lines as their logo shape.
o For an exciting establishment, it is recommended for the company to use spirals, curves, or sharp angles shape for the logo.
o Rectangle, if used as a hotel’s logo will elaborate the establishment as competitive.
2. It was also proved that logo color plays an important role towards brand perception. Different color will be perceived differently since color has personality that can be categorized into several dimensions in the Aaker Brand Personality Scale. The dimensions will further define certain brand image that will be perceived by the customers. The examples of color application in logo design are presented below:
o If a hotel company desired to be seen as a sincere establishment, it is recommended for the company to use white as the color of their logo. o Further, the color yellow, orange, and purple can described a hotel as
an exciting establishment.
References
Aaker,JL (1997).Dimensions of Brand Personlity in Muniz and Marchetti 2012 Abd-El-Salam, E. M., Shawky, A. Y., & El-Nahas, T. (2013). The Impact of
Corporate Image and Reputation on Service Quality, Customer Satisfaction and Customer Loyalty: Testing the Mediating Role.
Abratt, R., & Kleyn, N. (2012). Corporate Identity, Corporate Branding and Corporate Reputations: Reconciliation and Integration.
Adir, V., Pascu, N.-E., & Ivascu, L. (2013). The Graphic Language of a Logo. American Marketing Association. (2013, July). Definition of Marketing. Retrieved March 10, 2014, from https://www.ama.org/AboutAMA/Pages/Definition-of-Marketing.aspx Andersen, H. S. (2011). Exploring Brand Associations’ Effect on (Un)conscious
Brand Liking.
Arday, D. (2012, October 16).Color Schemes Defined. Retrieved March 27, 2015, from www.theinformedillustrator.com:
http://www.theinformedillustrator.com/2012/10/color-schemes-defined_16.html
Aslam, M. M. (2005). Are you selling the right color? A cross-cultural review of color as a marketing cue.
Atrees, F. F. (2011). The Concept of Subliminal Messages in Brand design. Bortoli, M. d., & Maroto, J. (2001). Colours Across Cultures: Translating Colours
in Interactive Marketing Communications.
Bradley, S. (2010).The Meaning Of Shapes: Developing Visual Grammar.
Retrieved March 18, 2014, from vanseodesign: http://www.vanseodesign.com/web-design/visual-grammar-shapes/
Budelmann, K., Kim, Y., & Wozniak, C. (2012).Brand Identity Essentials. Rockport Publishers.
Budiman, A., Anantadjaya, S. P., & Prasetyawati, D. (2014). Does Job
Satisfaction Influence Organizational Citizenship Behavior? An Empirical Study in Selected 4-Star Hotels in Jakarta, Indonesia.
Business Dictionary. (2014).Definition of Brand. Retrieved 12 30, 2014, from Business Dictionary: http://www.businessdictionary.com/definition/brand.html
Cataract Surgery. (2011, July 1).Color Blindness Test. Retrieved March 4, 2015, from www.cataract-surgery.info: http://cataract-surgery.info/colour_blindness_test.html
Cerrato, H. (2012).The Meaning of Color: How Color Impact Our Daily Life in Business, Art, Work, and Love.
Christie, M. (2014, February 3).The Psychology of Logo Shapes: a Designer's Guide. Retrieved March 30, 2015, from www.creativebloq.com:
http://www.creativebloq.com/logo-design/psychology-logo-shapes-8133918
Colblindor. (2010).Color Blind Essentials.
http://www.colormatters.com/color-and-Color Wheel Pro. (2012).Classic Color Schemes. Retrieved March 28, 2015, from www.color-wheel-pro.com: http://www.color-wheel-pro.com/color-schemes.html
Color Wheel Pro. (2012).Color Theory Basics. Retrieved March 26, 2015, from http://www.color-wheel-pro.com/color-theory-basics.html
Cooper, D. R., & Schindler, P. S. (2014).Business Research Method. McGraw Hill .
Cooper, D. R., & Schindler, P. S. (2014).Business Research Method. New York: McGraw-Hill.
Cousins, C. (2012, February 28).Principles of Color and the Color Wheel.
Retrieved March 27, 2015, from www.tympanus.net: http://tympanus.net/codrops/2012/02/28/principles-of-color-and-the-color-wheel/
Crayola. (2015).What is Color? Retrieved March 25, 2015, from crayola.com:
view-source:http://www.crayola.com/for-educators/resources-landing/articles/color-what-is-color.aspx
Ekström, T. (2011). The Emotional Meaning of Form, Shape, and Music. Farhana, M. (2012). Brand Elements Lead to Brand Equity: Differentiate or Die. Feinberg, F. M., Kinnear, T. C., & Taylor, J. R. (2013).Modern Marketing
Research: Concepts, Methods, and Cases. USA: Cenage Learning. Ford, J. L. (2013).Color Combinations. Retrieved March 27, 2015, from
/www.worqx.com: http://www.worqx.com/color/combinations.htm Foroudi, P. (2011). Examining the Influence of the Corporate Logo on Corporate
Image and Corporate Reputation: Conceptual Framework and Research Propositions.
Foroudi, P., Melewar, T., & Gupta, S. (2014). Linking Corporate Logo, Corporate Image, and Reputation: An Examination of Consumer Perceptions in the Financial Setting.
Fraser, T., & Banks, A. (2004).Designer's Color Manual: The complete guide to color theory and application. Sand Francisco: Chronicle Books.
Fussel, M. (2014).Color Theory-The Elements of Art-Color. Retrieved March 26, 2015, from thevisualinstructor.com: http://thevirtualinstructor.com/Color.html
Ghozali, I. (2012).Aplikasi Analisis Multivariate Dengan Program IBM SPSS 20 Edisi 6. Semarang: Badan Penerbit Universitas Diponegoro.
Hagtvedt, H. (2011). The Impact of Incomplete Typeface Logos on Perceptions of the Firm.
Hofstede, G., Hofstede, G. J., & Minkov, M. (2010).Cultures and Organizations: Software of the Mind. McGraw-Hill.
Holland, D., & Surya, D. (2012).Brand Cookbook. Jakarta: DM-IDHOLLAND. Holland, R., Holt, C., Ariyatum, B., & Roberts-Lombard, M. (2010). Exploring
Corporate Identity and Branding to Integrate Design.
Hummelen, J. (2012). Congruency Effects of Symbolic Meaning in Design and Brand Impressions: Effects on Product and Brand Evaluation.
Hurmelinna-Laukkanen, P., Juntunen, M., Saraniemi, S., & Elving, W. J. (2010). Visual Identity and IPRs in Corporate Brand Management.
Accounting volume 27: Intellectual Capital and Public Sector Performance.
Keller, K. L. (2013).Strategic Brand Management: Building, Measuring, and Managing Brand Equity. London: Pearson.
Kim, V. W., Periyayya, T., & Ai Li, K. T. (2013). How Does Logo Design Affect Consumers' Brand Attitudes?
Kotler, P., & Armstrong, G. (2013).Principles of Marketing. Essex: Pearson. Kyrnin, J. (2014).Shape - Basic Elements of Design. Retrieved March 26, 2015,
from about.com:
http://webdesign.about.com/od/webdesignbasics/p/aashape.htm
Kyrnin, J. (2014, April 14).Visual Color Symbolism Chart by Culture. Retrieved March 20, 2015, from about.com:
http://webdesign.about.com/od/colorcharts/l/bl_colorculture.htm
Labrecque, L. I., & Milne, G. R. (2011). Exciting Red and Competent Blue: the Importance of Color in Marketing.
Lovett, J. (2014).The Element of Design. Retrieved March 20, 2014, from http://www.johnlovett.com/test.htm
Machado, J. C. (2013). Brand Logo Design: Examining Consumers’ Responses to Figurativeness.
Machado, J. C., Lencastre, P. d., Carvalho, L. V., & Costa, P. (2011). Brand Mergers: Examining Consumer Response to Name and Logo Design. May, M. (2012, October 23).The Story Behind The Famous FedEx Logo, And
Why It Works. Retrieved March 30, 2015, from www.fastcodesign.com: http://www.fastcodesign.com/1671067/the-story-behind-the-famous-fedex-logo-and-why-it-works
Mullins, J. W., & Orville C Walker, J. (2010).Marketing Management: A Strategic Decision-Making Approach. New York: McGraw-Hill. Muniz, K. M., & Marchetti, R. Z. (2010). Brand Personality Dimensions in the
Brazilian Context.
Ontario Ministry of Education. (2010).ELEMENTS AND PRINCIPLES OF DESIGN. Retrieved 2015 20, 1, from Differentiated Instruction Teaching and Learning Examples:
http://www.edugains.ca/resourcesDI/TeachingLearningExamples/TechEd/ GR9ExploringTechnologiesTIJ10orTGJ10App.pdf
Opara, E., & Cantwell, J. (2014).Best Practices for Graphic Designers, Color Works: Right Ways of Applying Color in Branding, Wayfinding,
Information Design, Digital Environments and Pretty Much Everywhere Else. Gloucester, MA: Rockport Publisher.
Parafruit Education. (2012).THE ELEMENTS OF ARTS. Retrieved 3 3, 2015, from parafruiteducation.org: http://parafruiteducation.org/elements-of-arts-and-design-principles/
Park, C. W., Eisingerich, A. B., Pol, G., & Park, J. W. (2012). The Role of Brand Logo in Firm Performance.
Payne, C. R., Hyman, M. R., Niculescu, M., & Huhmann, B. A. (2013). Anthropomorphic Responses to New-to-Market Logos.
Rider, R. (2009). Color Psychology and Graphic Design Applications.
Ridgway, J. L. (2011). Brand Personality: Consumer’s Perceptions of Color Used in Brand Logos.
Rustan, S. (2010).Mendesain Logo. Jakarta: Gramedia Pustaka Utama. Santoso, S. (2014).Konsep Dasar dan Aplikasi Sem dengan Amos 22. Jakarta:
Elex Media.
Schumacker, R. E., & Lomax, R. G. (2010).A Beginner's Guide to Structural Equation Modeling: Third Edition. New Jersey: Lawrence Erlbaum Associates.
Sekaran, U., & Bougie, R. (2013).Research Methods for Business: A Skill-Building Approach, 6th Edition. New Jersey: Wiley.
Singh, M. (2012). Marketing Mix of 4P’S for Competitive Advantage.
Sunjoyo, Setiawan, R., Carolina, V., & Magdalena. (2013).Aplikasi SPSS untuk SMART Riset. Bandung, Indonesia: Alfabeta.
Texas A&M University. (2002).THE ELEMENT OF COLOR. Retrieved March 25, 2015, from www.ironwarrior.org:
http://www.ironwarrior.org/ARE/Mechanical_Electrical/8946BST.pdf The Logo Company. (2013).Psychology Of Color In Logo Design. Retrieved
March 26, 2015, from www.thelogocompany.net:
http://thelogocompany.net/blog/infographics/psychology-color-logo-design/
Ueda, P. (2010). Food Marketing towards Children: Brand Logo Recognition, Food-Related Behavior and BMI among 3–13-Year-Olds in a South Indian Town.
Vellest, R. (2012, August 7).The Psychology of Logo Design. Retrieved March 30, 2015, from www.webdesignerdepot.com:
http://www.webdesignerdepot.com/2012/08/the-psychology-of-logo-design/
Vyas, P. H. (2013). Corporate Logo Change: Study of Stakeholder Perceptions. Wheeler, A. (2012).Designing Brand Identity: An Essential Guide for the Whole
Branding Team. New Jersey: Wiley.
Wijaya, T. (2010).Analisis Structural Equation Modeling Menggunakan AMOS untuk Penelitian. Yogyakarta: Universitas Atma Jaya Yogyakarta. Wilde, C. (2013).Logomark Shapes & Meanings. Retrieved March 14, 2015,
from The Psychology of Logos, Branding & Identity: