COMPARISON OF PERCENTAGE OF BIOGAS PRODUCED FROM
ANIMAL WASTE IN VARIOUS RATES, WATER WITH WASTE
EDMOND DEMOLLARI1, ETLEVA JOJIÇ2, VALDETE VORPSI2,
ENKELEJDA SALLAKU3, ERTA DODONA2, MARSEL KEÇI3
1PhD Student,2Crop Production Department,3Animal Production Department Contact: [email protected]
Keywords: Mixture rates, mesophilic process, the process of fermentation, waste cattle.
ABSTRACT
The purpose of this article is the observation of biogas production process, environment temperature and comparison of mixture rates of waste with water. Defined mixture reports are 1:1 and 1:2 (water-waste cattle). The average temperature set in experimental conditions is 24°C, ie within the limits mesophilic development process, ie between 20°C and 35°C. The experimental system of biogas production set up in the Didactic Experimental Economics, at the Agricultural University of Tirana. At the same time, unlike the conditions thermophilic requiring external power in the form of heat, to reach a temperature (55°C - 60°C), this experiment does not require 'extra cost' energy but could be created from an greenhouse (GH) environment type. Six (6) vessels used in the experiment are simple and modified with a plastic pipes communication system adapted to appeal to experiment. The average percentage of methane gas in the amount of biogas produced by the ratio 1:1 is 44.4% and the ratio of 1:2 is 37.5%. The impact of the mixture ratio and temperature constitute key factors associated with the process of fermentation and then the production of biogas. Comparing them will give us a clearer picture about the behavior of minidigesters reports under the influence of these conditions.
INTRODUCTION
The usage of fossil fuel origin as the primary energy source has led to global climate change, environmental degradation and human health problems [Adeniran,A.K., Ahaneku, I.E., Itodo, I.N and Rohjy, H.A 2014]. Biogas is produced by anaerobic digestion or biodegradation of materials like animal dung, sewage, municipal waste, green waste and plant and animal waste [Kaygusuz, K and Kaygysuz, A. 3:431-453, 2002]. Anaerobic digestion is one of the methods most commonly used widely in the world today, because the performance benefit that reduces the volume and therefore increases the production of biogas, its main byproduct of methane gas, which makes the process more profitable.
Many pretreatment methods such as mechanical, chemical, thermal are taken into consideration to improve the process and increase the performance hydrolyzing anaerobic digestion. It is known that anaerobic fermentation shows total mass reduction of waste generation in solid fertilizer or liquid and releases energy in the form of biogas. The biogas has a chemical composition close to that of natural gas, the biodigester, or a biogas plant, is a physical structure used to provide an anaerobic condition which stimulates various chemical and microbiological reactions resulting in the decomposition of input slurries and the production of biogas—mainly methane [Balat M. 2008]. This process has three stages temperature: Psichrophilic (up to 20°C), Mesophilic (up to 35°C) and Thermophilic (up to 60°C). Degradation or dissolution of easily volatile components in a conventional process mesophilic anaerobic accounts for about 40% of the time then from 30 to 40 days [F. P. Gene, 1986].
the temperature at which exceed this process: Psichrophilic (up to 20°C) and mezofilik (up to 35°C), and the conditions termofilike it is impossible to implement, because it requires environment temperature up to 60°C. Psichrophilic bacteria and mesophilic bacteria, directly activated as soon as they come into contact with these temperature conditions.
System or experimental laboratory has created these conditions, which at the same time is directly dependent on the ambient temperature. Moreover, from transformation of animal waste into biometan, in consistently decomposition, global warming gases can be reduced to 4% [Richards, B., Herndon, F. G., Jewell, W. J., Cummings, R. J and White, T. E., 1994].
MATERIALS AND METHODS
Traditionally, bovine excrement is used as fertilizer, but today excrement is collected and used to produce biogas. In general, anaerobic fermentation is applicable at mesophilic temperature [El-Mashad, H.M., Wilko, K.P., Loon, V., Zeeman, G., 2003]. This gas is rich in methane and is used in rural areas and in other countries to ensure continuous electricity from renewable sources [http://denmark.dk/en/green-living/sustainable-projects/cow-dung-a-source-of-green-energy/]. Experiment set up based on 6 plastic vessels with mass 6 kg of each, where each container is modified with plastic pipeline system, associated with its gas-balloon respective holder. Base materials for the development of the experiment are waste of cattle and water at environment temperature.
The basic elements of the experiment, in the initial moment, have the following data: Temp.water = 20°C, pHwater = 7.1, Temp.waste = 37.1°C, pHwaste = 7.4. The defined
report water-waste to compare the two processes, is 1:1 and 1:2. Each vessel is filled with the mixture up to ¾ of its volume. The measured temperatures were conducted during September-October 2015, when conducted the experiment. Experimental conditions and reports of components enable the creation and development of the processes required.
During the experimental work was accomplished on the measurement and chemical analysis of animal waste material. To perform the measurement for dry matter and measuring the moisture lost, it was used Laboratory of Physical-Analytical of Food and Animal Feed (LPAFAF) in the Department of Zootechnic and Livestock Business, Faculty of Agriculture and Environment, Agricultural University of Tirana. Some of the main equipments were laid in use for making these data are: Equipment FOS/TAC 2000 PRONOVA, oven-drying thermostat which serves to dry the sample at temperature 65°C, electronic scales (error in measurement 1/10000), laboratory spoon, 1(a) glass beaker (laboratory scalable glasses) and laboratory hand sieve.
LostDeterminationMoisture (LDM) is given by the formula 1:
(m2-m1/m1) x 100 = LDM (%) (1)
The measure the sample (msample) came out by formula 2, where m1is the mass of
the sample together with the container mass (mvessel) is the measure for the vessel:
m1-mvessel= msample (2)
To determine the percentage of dry matter (% DM), implemented the formula 3, where m3 is the mass of the matter after drying in the oven and m4 is the mass of the
matter before drying (so, before joining the oven). Pursuant to the experimental protocol, the sample was entered into the oven-thermostat. The period of time was 1 day (24 hours) under the temperature of 65°C. After the drying process, it was taken and weighted in electronic scales.
(m3/m4) x 100 = % DM (3)
the implementation of these measures is WEENDE methods. For determining the values extracted from the device FOS/TAC 2000 it was followed this way: In a Becher, a sample was taken from the digester. Through laboratory sieve, became separation of solid with liquid. According to the manual of the device, through the scale was measured measure sought m1=5 grams. To this were added distilled water (mdistilled water = 15 grams). Inside
the Beaker was placed on a magnet that helped to mix the measure. Measure the mixture of mmixture = 20 grams was put in contact with the electrodes for measurements required
values.
RESULTS
Considering the temperature created by the environment type "greenhouse", we note that the proportion of methane gas to various reports blended, is different. This is shown in vessels that have been taken for experimentation: Vessel 1, Vessel 2 and Vessel 3 of each report. From Chart 1, we see that, each given in graphic shows the average of the measurements performed by biogas-measuring apparatus (Geotech Biogas Analyser). The graph shows that the ratio 1:1 has the biogas percentage slightly higher than the ratio 1:2. The main reasons are pH and temperature. Also, climate factors, the nature or quality of nutrition that are directly exposed cattle, are factors that can contribute to changing relations of production of biogas [Li, R., Chen, S and Li, X., 2009].
Data presented in Table 2 showed the calculations for the lost of moisture for two vessels. As we see the value is around -87% for each vessel. Dry matter calculated by formula 3, for vessel nr.21 is 13.35 % and vessel nr.22 is 13.97 %. Dry matter is an indicator of the amount of nutrients that are available to the animal in a particular feed [http://www.ccof.org/faqs/what-dry-matter-and-why-important]. These values gave us the informations which is amount of biogas production that we expect.
By noticing carefully Table 3, Table 4 and Table 5, we see a clearer picture of the situation. Table 5 shows that the pH of environment is acid. As more "liquid" to be the mixture, less heat energy in the form requires for the start of the fermentation process and
Chart 1
Table 2
200.00 gr
37.10 gr Empty vessel nr.21 10.40 gr 38.35 gr Empty vessel nr.22 10.40 gr
Matter in vessel nr.21 26.70 gr Matter in vessel nr.22 27.95 gr
-86.65 % -86.03 % Measurements for dry matter
Lost moisture (vessel nr.21) Lost moisture (vessel nr.22) Vessel + sample nr.21 Vessel + sample nr.22
the time at which begins fermentation is short. From this fact, it is seen that water is a factor for the activation of microbes (bacteria methane-forming) process faster.
The measured values are shown below in Tables 3 and 4.
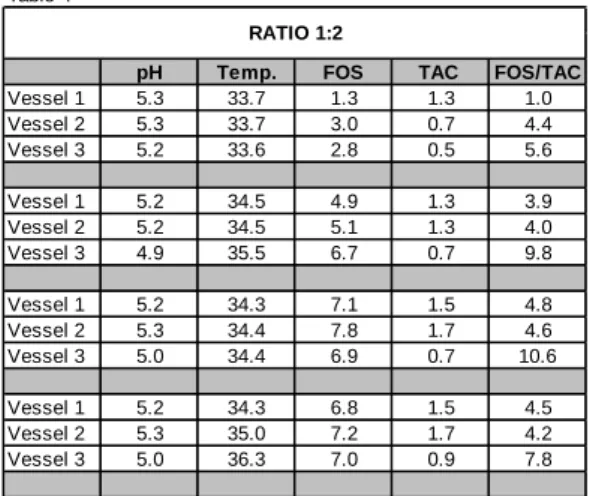
From the values obtained during the measurement laboratory, for each sample taken from the experimental conditions, such as the ratio of 1:1 as well as the ratio of 1:2, by equipment FOS/TAC 2000, we see that the average values differ as in Table 5.
The average pH values in the each container in the the mixing ratio 1:2, shown in Chart 2, shows a decrease compared with the graphic trend of the ratio 1:1. This is also reflected in Chart 1, the values of percentages of biogas produced.
Taking into account the average temperature of the external environment, compared with the average temperature inside the digester for each report, we can say that the difference in temperature created, has brought a 'reaction' of the mixtures creating favorable environment for production these biogas percentages.
Table 5
Average pH for 3 vessels
Average Temperature (°C)
Ratio 1:1 5,40 34,35
Ratio 1:2 5,17 33,51
Chart 2
Table 3 Table 4
pH Temp. FOS TAC FOS/TAC pH Temp. FOS TAC FOS/TAC
Vessel 1 5.5 34.3 6.0 1.5 4.0 Vessel 1 5.3 33.7 1.3 1.3 1.0
Vessel 2 5.4 34.3 5.7 1.6 3.6 Vessel 2 5.3 33.7 3.0 0.7 4.4
Vessel 3 5.3 34.1 5.5 1.4 3.8 Vessel 3 5.2 33.6 2.8 0.5 5.6
Vessel 1 5.3 34.2 6.1 1.5 4.1 Vessel 1 5.2 34.5 4.9 1.3 3.9
Vessel 2 5.3 34.1 5.8 1.6 3.7 Vessel 2 5.2 34.5 5.1 1.3 4.0
Vessel 3 5.3 34.2 5.6 1.5 3.7 Vessel 3 4.9 35.5 6.7 0.7 9.8
Vessel 1 5.4 34.1 6.3 1.5 4.1 Vessel 1 5.2 34.3 7.1 1.5 4.8
Vessel 2 5.4 34.3 5.9 1.6 3.8 Vessel 2 5.3 34.4 7.8 1.7 4.6
Vessel 3 5.5 34.1 6.0 1.6 3.8 Vessel 3 5.0 34.4 6.9 0.7 10.6
Vessel 1 5.5 34.8 6.3 1.5 4.2 Vessel 1 5.2 34.3 6.8 1.5 4.5
Vessel 2 5.4 34.8 5.9 1.7 3.5 Vessel 2 5.3 35.0 7.2 1.7 4.2
Vessel 3 5.4 35.2 6.1 1.6 3.8 Vessel 3 5.0 36.3 7.0 0.9 7.8
CONCLUSIONS
With the pH value measured by the equipment FOS/TAC 2000 PRONOVA, the acid environment "helped" to accelerate the start of the fermentation process. Despite various reports mixtures, another important factor was the temperature. This led to the further advancement of the production of biogas. From the study came out that pH and temperature coordinate with each other by giving a percentage (%) higher production in the ratio 1:1.
REFERENCES
[1] Adeniran,A.K., Ahaneku, I.E., Itodo, I.N and Rohjy, H.A (2014).Relative effectiveness of biogas production using poultry wastes and cow dung. Agric Eng Int: CIGR Journal .16(1):126-132.
[2] Kaygusuz, K and Kaygysuz, A. A renewable energy and sustainable development in turkey.
Renewable energy. E and FN spon Ltd, USA, 3:431-453, (2002).
[3] Balat M. Progress in biogas production processes. Energy Educ Sci Technol 2008;22:15–36.
[4] F. P. Gene, Fundamentals of anaerobic, Environmental Engineering 112 (1986) 867-920.
[5] Richards, B., Herndon, F. G., Jewell, W. J., Cummings, R. J and White, T. E.In situ methane
enrichment in methanogenic energy crop digesters. Biomass and Bioenergy., 6(4): 274–
275,(1994).
[6] El-Mashad, H.M., Wilko, K.P., Loon, V., Zeeman, G., 2003. A model of solar energy utilisation in the anaerobic digestion of cattle manure. Biosyst. Eng. 84, 231–238. [7] http://denmark.dk/en/green-living/sustainable-projects/cow-dung-a-source-of-green-energy/
[8] Li, R., Chen, S and Li, X. Anaerobic co-digestion of kitchen waste and cattle manure production. Energy Sources., 31:1848-1856, (2009).