THE MEDIATING EFFECT OF TAX FAIRNESS ON
THE RELATIONSHIP BETWEEN KNOWLEDGE,
COMPLEXITY AND VOLUNTARY TAX
COMPLIANCE
1
Anna Azriati Che Azmi, Suria Zainuddin,
Mohd Zulkhairi Mustapha & Yusni Nawi
Abstract
This study aims to examine the mediating role of tax fairness on the relationship between tax knowledge, tax complexity, and voluntary tax compliance. Based on 200 samples of taxpayers, it is found that tax knowledge increases tax fairness perceptions, which, consequently, increases tax compliance behaviour. Similarly, tax fairness perceptions do not reduce the tax compliance directly, but indirectly through the role of tax fairness perceptions. This implies that tax authorities should not only focus on introducing or developing tax rules that are fair to the taxpayers but be able to communicate the rationale of a tax rule in the context of how it permeates fairness into the tax system for certain classes of taxpayers. Our study found that, in situations where tax simplification is not possible, this form of information dissemination could lead to better compliance among taxpayers.
Keywords: Tax Compliance, Knowledge, Fairness, Complexity
JEL Classification: H260
1. Introduction
In the simplest terms, tax compliance is defined as the most neutral term to describe taxpayers’ willingness to pay their taxes (Kirchler, 2007). Palil (2010) further refined the definition of tax compliance as taxpayers’ willingness to comply with tax laws, declare the correct income, claim the correct deductions, relief, and rebates, and pay all taxes on time. The compliance behaviour of taxpayers is influenced by not only their knowledge of the tax procedures and processes but also by how complex they perceive the existing tax system. Various studies have suggested that perceptions of tax fairness, complexity and tax knowledge influence compliance among taxpayers (Gilligan and Richardson, 2005; Loo et al., 2009a; Porcano, 1984; Spicer and Becker, 1980).
Corresponding author: Anna Azriati Che Azmi is an Associate Professor at the Department of Accounting, Faculty of Business and Accountancy, University of Malaya. Email: [email protected].
Suria Zainuddin is a Senior Lecturer at the Department of Accounting, Faculty of Business and Accountancy, University of Malaya. Email: [email protected].
Mohd Zulkhairi Mustapha is a Senior Lecturer at the Department of Accounting, Faculty of Business and Accountancy, University of Malaya. Email: [email protected].
However, there is a paucity of research that examines the interaction between these three important factors (i.e. tax knowledge, fairness perceptions and complexity perceptions) in fostering voluntary tax compliance. Thus, the main objective of this study is to expand the knowledge concerning the mediating effect of tax fairness in the relationship between (i) knowledge and voluntary tax compliance, and (ii) complexity and voluntary tax compliance. The results of this study will assist policy makers, such as the Inland Revenue Board, to improve compliance among taxpayers by utilising tax fairness perceptions to improve the knowledge of taxpayers and reduce the perceptions of complexity that exist in a tax system.
This paper is structured as follows. The next section presents the current level of voluntary tax compliance in Malaysia, and this is followed by the literature review and hypotheses development section of this study. Next, the research design and methodology section of the study is presented. The final section presents the discussion and conclusion of the study.
1.1. Background on voluntary compliance in Malaysia
In Malaysia, voluntary tax compliance was implemented with the introduction of the Self-Assessment System (SAS). Under the SAS, the burden of complying with income tax is shifted to taxpayers. Taxpayers are required to compute their own tax liability and submit the form within the stipulated time to the Inland Revenue Board of Malaysia (IRBM). The IRBM is a government body that is responsible for income tax collection. The SAS requires taxpayers to be well-versed with the existing tax laws and provisions, since they are subjected to penalties if non-compliance is found through tax audits and investigations. The dissemination of updated information and guidelines is important under the SAS so that taxpayers are able to calculate their income tax accurately. In 2013 alone, twelve public rulings and six technical guides were issued by the IRBM. Given the frequency and the number of changes made or new information introduced to the existing tax law and regulations in Malaysia, it is very pertinent that this up to date information is communicated to the taxpayers. The dynamic nature of tax law and regulations is one of the causes of the increased perception of complexity among taxpayers.
2. Literature Review and Hypotheses Development
H1:Tax knowledge has a positive effect on tax compliance behaviour.
Another possible factor in fostering better tax compliance is reducing tax complexities. Tax complexities could exist in many forms: uncertainties of tax law, complex tax computation, frequent amendments to tax law, excess detail in the law, excessive burden of recordkeeping, confusing formats and instructions in tax returns, and cost incurred by taxpayers in seeking professional advice (Katz and Ott, 2011; McKerchar, 2007). Consistent findings were established in the literature where tax complexity was one of the significant contributing factors that lead towards non-compliance among taxpayers (e.g. Evans, 2012; Hanefah, 1996; Saad, 2014; Sapiei et al., 2014). Evans (2012); Mohd Hanefah (1996) found that complexity in the tax system can escalate intentional and unintentional tax non-compliance. However, Katz and Ott (2011) found that taxpayers with a complex business situation will tend to support tax simplification proposals compared to those with simpler tax situations. The following hypothesis was developed based on the discussion above.
H2: Tax complexity perceptions have a negative effect on tax compliance behaviour.
Saad (2010, p. 35) found that fairness is multidimensional. In her study, there are seven dimensions of fairness: general fairness, exchange fairness, horizontal fairness, vertical fairness, retributive fairness, personal fairness and administrative fairness. Several studies (e.g. Fallan, 1999; Schisler, 1995; Wartick, 1994) have highlighted the relationship between tax knowledge and tax fairness. Wartick (1994) found that tax knowledge was able to improve the fairness perceptions of a tax law change that resulted in increased taxes. Fallan (1999) concluded that those taxpayers who possessed a good knowledge of tax will have a higher fairness perception compared with those who are not very knowledgeable about tax. Schisler (1995) indicated that an increase in tax knowledge strengthens the taxpayers’ perceptions about the fairness of the income tax system. Good perceptions of fairness and less complexity are two desirable features of a tax system (McKerchar, 2002). These two perceptions are related, as a tax situation perceived as complex will, in turn, influence a negative perception of tax fairness (Bobek and Hatfield, 2001). The following hypotheses were developed based on the discussion above.
H3: Tax knowledge has a positive effect on tax fairness perceptions
H4: Tax complexity perceptions have a negative effect on tax fairness perceptions
in these exchanges (Cook and Hegtvedt, 1983, p. 221). Tax fairness is essential in order to obtain a higher degree of voluntary tax compliance (Gilligan & Richardson, 2005; Saad, 2010). Individual preferences, such as gender and ethnicity, have been found to not only influence compliance attitudes (Hasseldine and Hite, 2003; Kasipillai and Abdul-Jabbar, 2006), but also to have an impact on equality perceptions (Fallan, 1999). Thus, the following hypothesis was developed.
H5: Tax fairness perceptions have a positive effect on tax compliance behaviour
2.1. The mediating role of fairness
The discussion above illustrates the important role of tax fairness in fostering compliance. Loo et al. (2009a) found that even taxpayers with high knowledge in taxation may comply negatively with tax regulations because of their fairness perceptions towards the tax system and tax officers. In other words, their attitude and perception will influence their compliance behaviour. Fairness perceptions have the potential to mediate tax complexity perceptions. Several studies (Porcano, 1984; Spicer & Becker, 1980) have argued that this is possible. Among the factors that contribute to high levels of compliance behaviour are when taxpayers considered the tax law to be fair and low in complexity (Porcano, 1984; Spicer & Becker, 1980). According to Katz and Ott (2011), taxpayers will not complain if they have to face a complex tax system as long as it is useful to them; this study suggests that tax fairness might be a mediator in tax complex situations. In H6 and H7, this study posits that fairness has the following mediator properties.
H6. Tax fairness perceptions mediate the relationship of tax knowledge and tax compliance behaviour.
H7. Tax fairness perceptions mediate the relationship of tax complexity perceptions and tax compliance behaviour.
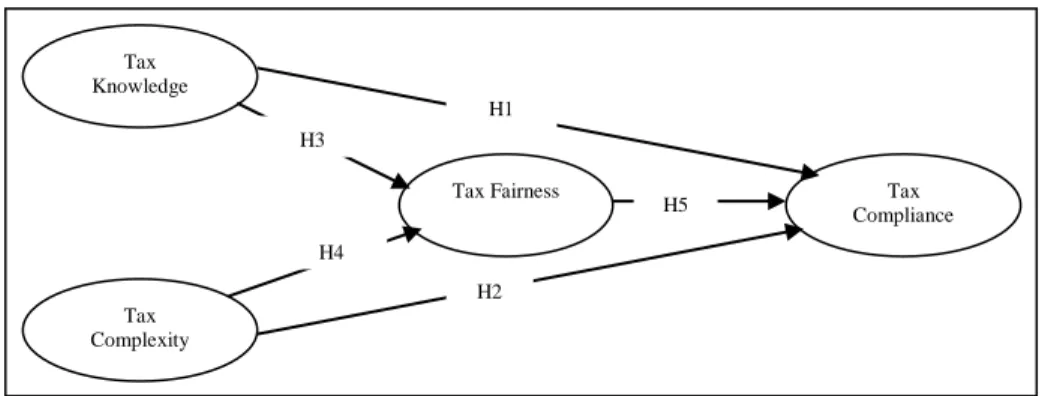
Figure 1 presents the research framework for this study.
Figure 1: Conceptual Model Tax
Knowledge
Tax Complexity
Tax Fairness Tax
Compliance H5
H4 H3
H1
3. Methodology
Due to the unavailability of the taxpayer list in Malaysia, it is not possible to do probability sampling (Islam et al., 2015). Hence, we adopted the selective sampling method. A total of 200 questionnaires were distributed among taxpayers who visited the Inland Revenue board (IRB) branch for assistance and individuals working at the executive and managerial level from various industries who are studying an MBA course part-time at the University of Malaya and University Putra Malaysia. Thus, respondents are independent of each other. The diversity of respondents that visit the IRB branch and part-time MBA students are described in the demographic profile of the respondents. Selective sampling was adopted to ensure that all respondents were taxpayers and to receive a high response rate. All the questionnaires were returned (i.e. 100% response rate). The questionnaire is divided into four sections: tax knowledge, tax complexity perceptions, tax fairness perceptions, and compliance behaviours. There are 25 questions in total: six questions for tax knowledge, six questions for tax complexity, eight questions for fairness perception and five questions for compliance behaviour. All the items in the questionnaire use a seven-point Likert scale, ranging from “strongly disagree” to “strongly agree”. The measurement for each variable is adopted from Saad (2010) and Palil (2010); please see Table 1 for details of the questionnaire items. The Partial Least Squares (PLS) approach is used to test the research model and hypotheses, which is an exploratory study. SmartPLS software is used for this study.
Table 1: Initial Questionnaire Items
Item Variable Source
Introduction of e-filing Know1
Tax Knowledge
Saad (2010)
Knowledge about tax evasion Know2
Taxable income Know3
Income Tax Act Know4
Deductible expenses Know5
Allowable expenses Know6
Tax regulations Complex1
Tax Complexity
Saad (2010) and Palil (2005)
Tax publications Complex2
Tax return form Complex3
Maintain relevant records Complex4
Rules on individual income tax Complex5
Assistance in tax matters Complex6
Fair share of tax burden (individual) Fair1
Fairness Perception
Saad (2010)
Fair share of tax burden (others) Fair2
Similar tax burden Fair3
Higher tax rates for high income Fair4
Low income receives more benefits Fair5
Low income taxed at lower rates Fair6
Punishment depends on degree of non-compliance Fair7
Penalty on unpaid tax Fair8
Income reported Comply1
Compliance Behaviour
Saad (2010)
Income not reported Comply2
Feeling of guilt Comply3
Financially beneficial Comply4
4. Results and Discussions
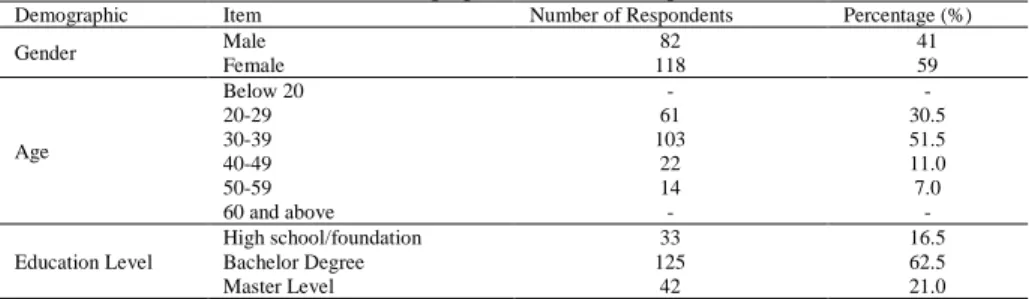
Table 2 shows the demographic profile of the respondents involved in the research. The number of female respondents (59 per cent) is higher compared to male respondents, who comprise only 41 per cent. The age group of most respondents is within the range of 30-39 (51.5 per cent), followed by the age group of 20-29 (30.5 per cent). The highest educational qualification for most of the respondents (62.5 per cent) is a bachelor degree.
Table 2: Demographic Profile of Respondents
Demographic Item Number of Respondents Percentage (%)
Gender Male 82 41
Female 118 59
Age
Below 20 - -
20-29 61 30.5
30-39 103 51.5
40-49 22 11.0
50-59 14 7.0
60 and above - -
Education Level
High school/foundation 33 16.5
Bachelor Degree 125 62.5
Master Level 42 21.0
The means and descriptive statistics for all the study variables are presented in Table 3. The tax knowledge variable scored the highest mean, followed by tax fairness perceptions, while tax complexity perceived by individual taxpayer received the lowest score.
Table 3: Descriptive Statistics
Variable Mean Standard Deviation
Tax Knowledge 5.11 0.816
Tax Complexity 3.76 0.916
Tax Fairness 5.03 0.787
Tax Compliance 4.19 0.806
As indicated earlier, the Partial Least Squares (PLS) approach is used to test the research model and hypotheses. This involves two steps of evaluation: the measurement model and the structural model. The measurement model is evaluated based on the internal consistency and reliability, convergent validity and discriminant validity. The structural model is assessed based on the path coefficients represented by standardized betas.
4.1. Measurement model
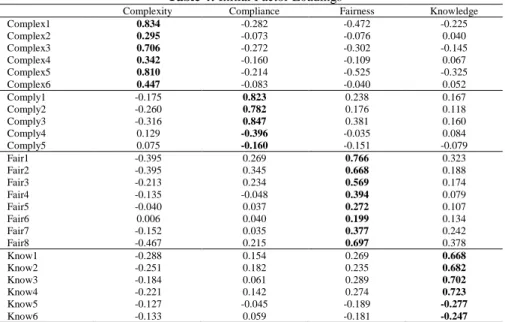
Table 4: Initial Factor Loadings
Complexity Compliance Fairness Knowledge
Complex1 0.834 -0.282 -0.472 -0.225
Complex2 0.295 -0.073 -0.076 0.040
Complex3 0.706 -0.272 -0.302 -0.145
Complex4 0.342 -0.160 -0.109 0.067
Complex5 0.810 -0.214 -0.525 -0.325
Complex6 0.447 -0.083 -0.040 0.052
Comply1 -0.175 0.823 0.238 0.167
Comply2 -0.260 0.782 0.176 0.118
Comply3 -0.316 0.847 0.381 0.160
Comply4 0.129 -0.396 -0.035 0.084
Comply5 0.075 -0.160 -0.151 -0.079
Fair1 -0.395 0.269 0.766 0.323
Fair2 -0.395 0.345 0.668 0.188
Fair3 -0.213 0.234 0.569 0.174
Fair4 -0.135 -0.048 0.394 0.079
Fair5 -0.040 0.037 0.272 0.107
Fair6 0.006 0.040 0.199 0.134
Fair7 -0.152 0.035 0.377 0.242
Fair8 -0.467 0.215 0.697 0.378
Know1 -0.288 0.154 0.269 0.668
Know2 -0.251 0.182 0.235 0.682
Know3 -0.184 0.061 0.289 0.702
Know4 -0.221 0.142 0.274 0.723
Know5 -0.127 -0.045 -0.189 -0.277
Know6 -0.133 0.059 -0.181 -0.247
Table 5: Final Factor Loadings
Complexity Compliance Fairness Knowledge
Complex1 0.844 -0.268 -0.482 -0.269
Complex3 0.723 -0.271 -0.310 -0.185
Complex5 0.831 -0.189 -0.531 -0.328
Comply1 -0.159 0.838 0.261 0.170
Comply2 -0.241 0.792 0.201 0.158
Comply3 -0.310 0.862 0.407 0.165
Fair1 -0.390 0.268 0.778 0.299
Fair2 -0.410 0.330 0.723 0.143
Fair3 -0.230 0.231 0.587 0.092
Fair8 -0.485 0.211 0.687 0.351
Know1 -0.303 0.157 0.203 0.682
Know2 -0.241 0.184 0.205 0.747
Know3 -0.205 0.083 0.302 0.729
Know4 -0.233 0.158 0.263 0.759
Another way of examining internal consistency and reliability is to evaluate the composite reliability and Cronbach alpha of the constructs. Both coefficients should be more than 0.7 to be regarded as having satisfactory reliability, otherwise, if they are below 0.6, the latent variable lacks reliability (Fornell & Larcker, 1981; Nunnally, 1978). Table 6 shows that the composite reliability and Cronbach alpha of the constructs meet the requirements.
Table 6: Reliability, Average Variance Extracted (AVE) And Correlations
AVE Composite
Reliability
Cronbach Alpha
Correlations
Complexity Compliance Fairness Knowledge
Complexity 0.642 0.843 0.722 0.801
Compliance 0.691 0.870 0.787 -0.297 0.831
Fairness 0.486 0.789 0.651 -0.563 0.372 0.697
Knowledge 0.533 0.820 0.708 -0.333 0.197 0.337 0.730
Convergent validity is assessed by examining the average variance extracted (AVE). As a rule of thumb, a value of 0.5 or more signifies the adequacy of the convergent validity (Fornell & Larcker, 1981). The constructs in this study show that the values of the AVE are above or close to 0.5, thus fulfilling the requirement (Table 6). To assess discriminant validity, the loading of each item on its respective construct should be more than the loading of the same item on different constructs; as portrayed in Table 6. Another technique to assess discriminant validity is to examine the square roots of the AVE, which should be greater than the correlations among the different constructs. As shown in Table 6, all the constructs are verified successfully.
4.2. Structural model
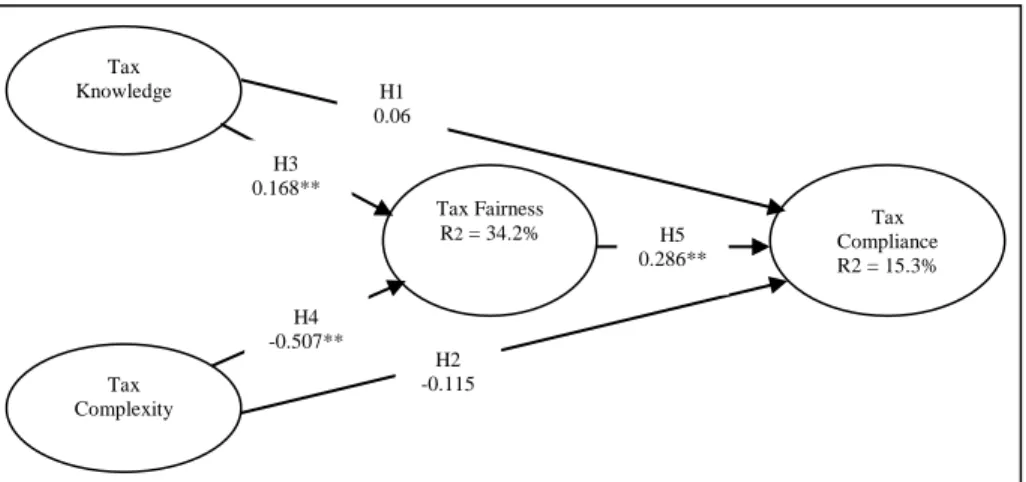
Figure 2: Path Coefficients of the Conceptual Model
A bootstrapping procedure was used to assess the structural model and the hypotheses by reviewing the path coefficients and the level of significance computed by PLS. As shown in Figure 2, no direct relationship is observed between tax knowledge and tax compliance, with the path coefficient (β) of 0.062 (p > .01) (H1). However, a significant positive relationship is found in the relationship between tax knowledge and tax fairness (β = 0.168, p < 0.01). This indicates that the tax knowledge owned by the taxpayer does not directly guarantee tax compliance, which is consistent with the findings of Loo et al. (2009a), whereby, an increase in tax knowledge may not lead to better compliance. Nevertheless, tax knowledge leads to tax fairness perceptions (H3).
The negative effect of the tax complexity perceptions by individual taxpayers on compliance behaviour (H2) is not significant (β = -0.115, p > .01), which signifies that the tax complexity perceptions by individual taxpayers does not significantly reduce the compliance with tax. However, for the relationship between tax complexity and tax fairness perceptions, the results indicate otherwise. There is a significant negative relationship portrayed (β = -0.507, p < .01), which indicates that the more the taxpayer perceives the tax as complex, the
Tax Knowledge
Tax Complexity
Tax Fairness
R2 = 34.2% ComplianceTax
R2 = 15.3% H5
0.286**
H4 -0.507**
H3 0.168**
H1 0.06
more it reduces the tax fairness perceptions of the taxpayer (H4). A significant relationship also exists in the relationship between tax fairness perceptions and tax compliance, but in a positive direction (β = 0.286, p < .01). This shows that tax fairness perceptions significantly increase the tax compliance behaviour of the taxpayer (H5). The results show that 34.2 per cent of the variance in tax fairness is explained by tax knowledge and tax complexity. The percentage of variance explained by tax compliance is 15.3 per cent.
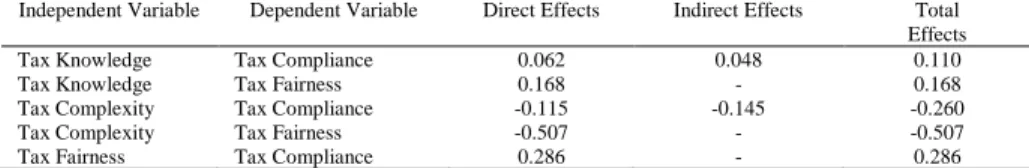
Table 7: Direct, Indirect and Total Effects of Path Coefficients
Independent Variable Dependent Variable Direct Effects Indirect Effects Total Effects
Tax Knowledge Tax Compliance 0.062 0.048 0.110
Tax Knowledge Tax Fairness 0.168 - 0.168
Tax Complexity Tax Compliance -0.115 -0.145 -0.260
Tax Complexity Tax Fairness -0.507 - -0.507
Tax Fairness Tax Compliance 0.286 - 0.286
To analyse the mediating role played by tax fairness perceptions: the direct, indirect and total effects of the path coefficients, as computed by PLS, need to be examined. Table 7 shows the details of the direct, indirect and total effects of the path coefficients as computed by PLS. This indicates that, in the relationship between tax knowledge and tax compliance behaviour, the indirect effect is 0.048, which is less than the direct effect of 0.062. This means that the direct effect of tax knowledge on tax compliance is more than its indirect effect. To further determine whether the relationship has any significant indirect effect, according to Bartol (1983) and Pedhazur (1982), if the absolute amount of the indirect effect is more than 0.05, the effect may be significant. Based on Table 6, the relationship between tax knowledge and tax compliance is mediated by tax fairness perceptions (since the effect is close to 0.05); hence, H6 is supported. Regarding the relationship between tax complexity and tax compliance, the absolute amount of the indirect effect is 0.145 (-0.507 x 0.286). Since the effect is more than 0.05, it can be suggested that the relationship is mediated by tax fairness perceptions (Bartol, 1983; Pedhazur, 1982); thus, H7 is supported.
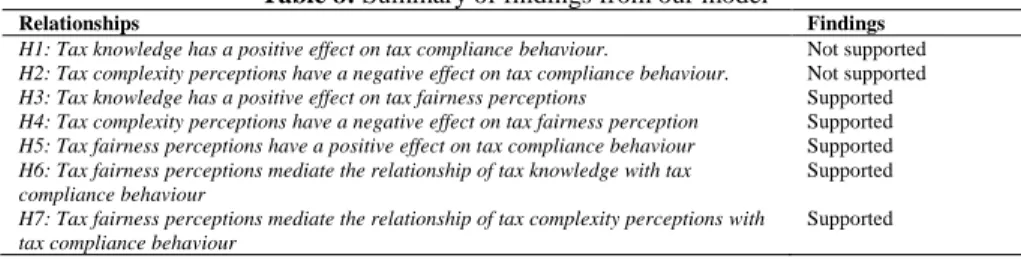
Table 8: Summary of findings from our model
Relationships Findings
H1: Tax knowledge has a positive effect on tax compliance behaviour. Not supported
H2: Tax complexity perceptions have a negative effect on tax compliance behaviour. Not supported
H3: Tax knowledge has a positive effect on tax fairness perceptions Supported
H4: Tax complexity perceptions have a negative effect on tax fairness perception Supported
H5: Tax fairness perceptions have a positive effect on tax compliance behaviour Supported
H6: Tax fairness perceptions mediate the relationship of tax knowledge with tax compliance behaviour
Supported
H7: Tax fairness perceptions mediate the relationship of tax complexity perceptions with tax compliance behaviour
Supported
5. Conclusions
Our results show that tax knowledge and tax complexity do not directly influence voluntary tax compliance. This result contradicts a number of earlier studies, such as Eriksen & Fallan (1996); Kasipillai et al. (2003); and Palil (2010). Our findings also show that tax fairness not only mediates the relationship between (i) tax knowledge and tax compliance, and (ii) tax complexity perceptions and tax compliance but it is also a better mediator in situation (ii) than (i). This suggests that tax fairness perceptions is a crucial factor in fostering better voluntary compliance among tax payers in situations that are complex. Our study supports the suggestion by studies, such as Loo et al. (2009a), Porcano (1984), and Spicer and Becker (1980), that tax fairness could play a mediating role between tax knowledge and complexity with tax compliance.
This has important policy implications for tax policy makers. Tax authorities should focus on introducing or developing tax rules that are fair to the taxpayers. In situations whereby tax simplification is not possible, tax authorities should position the rationale of a tax rule in the context of how fairness permeates into the tax system for certain classes of taxpayers. Tax authorities could also utilize the dissemination of tax knowledge to not only foster better compliance, but, most importantly, to educate taxpayers on the fairness of certain tax rules.
References
Alm. (1991). A Perspective on the Experimental Analysis of Taxpayer Reporting. The Accounting Review, 66(3), 577-593.
Azmi, & Perumal. (2008). Tax fairness dimensions in an Asian context: The Malaysian perspective. International Review of Business Research Papers, 4(5), 11-19.
Bartol. (1983). Turnover among DP personnel: a casual analysis. Communications of the ACM, 26(10), 807-811.
Bobek, & Hatfield. (2001). The effect of policy objectives, complexity, and self-interest on individuals' comparative fairness judgments of a flat tax Advances in Taxation (pp. 1-25): Emerald Group Publishing Limited. Cook, & Hegtvedt. (1983). Distributive justice, equity, and equality. Annual
review of sociology, 217-241.
Eriksen, & Fallan. (1996). Tax knowledge and attitudes towards taxation; A report on a quasi-experiment. Journal of economic psychology, 17(3), 387-402.
Evans. (2012). Tax Governance Issues: Managing System Complexity. Economic Papers: A journal of applied economics and policy, 31(1), 30-35. Fallan. (1999). Gender, exposure to tax knowledge, and attitudes towards taxation; an experimental approach. Journal of Business Ethics, 18(2), 173-184.
Fornell, & Larcker. (1981). Evaluating structural equation models with unobservable variables and measurement error. Journal of marketing research, 39-50.
Gilligan, & Richardson. (2005). Perceptions of tax fairness and tax compliance in Australia and Hong Kong-a preliminary study. Journal of financial crime, 12(4), 331-343.
Hanefah. (1996). An Evaluation of the Malaysian Tax Administrative System and Taxpayers Perceptions Towards Assessment Systems, Tax Law Fairness and Tax Law Complexity. Universiti Utara Malaysia.
Hasseldine, & Hite. (2003). Framing, gender and tax compliance. Journal of economic psychology, 24(4), 517-533.
Hulland, & Business. (1999). Use of partial least squares (PLS) in strategic management research: A review of four recent studies. Strategic management journal, 20(2), 195-204.
Islam, Yusuf, & Bhuiyan. (2015). Taxpayers’ Satisfaction in Using E—Fih ‘ng System in Malaysia: Demographic Perspective. The Social Sciences, 10(2), 160-165.
Kasipillai, & Abdul-Jabbar. (2006). Gender and ethnicity differences in tax compliance. Asian Academy of Management Journal, 11(2), 73-88.
Katz, & Ott. (2011). If we could choose the way we pay: The impact of decision complexity on tax scheme preference. Journal of Applied Business Research (JABR), 22(3).
Kirchler. (2007). The economic psychology of tax behaviour: Cambridge University Press.
Loo, Mckerchar, & Hansford. (2009a). Understanding the compliance behaviour of Malaysian individual taxpayers using a mixed method approach. Journal of the Australasian Tax Teachers Association, 4(1), 181-202.
Loo, Mckerchar, & Hansford. (2009b). Understanding The Compliance Behaviour Of Malaysian Individual Taxpayers Using A Mixed Method Approach. Journal of the Australasian Tax Teachers Association, 4(1). McKerchar. (2002). The Effects of Complexity on Unintentional Noncompliance
for Personal Taxpayers in Australia. Austl. Tax F., 17, 3.
McKerchar. (2007). Tax complexity and its impact on tax compliance and tax administration in Australia. Paper presented at the 2007 IRS Research Conference.
Mohd Hanefah. (1996). An evaluation of the malaysian tax administrative system, and taxpayers’ perceptions towards assessment systems, tax law fairness, and tax law complexity. (Doctor of Philosophy), Universiti Utara Malaysia, Kedah, Malaysia.
Nunnally. (1978). C.(1978). Psychometric theory: New York: McGraw-Hill. Palil. (2005). Taxpayers knowledge: A descriptive evidence on demographic
factors in Malaysia. Jurnal Akuntansi dan Keuangan, 7(1), pp. 11-21. Palil. (2010). Tax knowledge and tax compliance determinants in self assessment
system in Malaysia. University of Birmingham.
Pedhazur. (1982). Multiple regression in behavioral research: Explanation and prediction. New York: Holt, Rinehart and Winston.
Porcano. (1984). Distributive justice and tax policy. Accounting Review, 619-636.
Saad. (2010). Fairness Perceptions and Compliance Behaviour: The Case of Salaried Taxpayers in Malaysia after Implementation of the Self-Assessment System. eJournal of Tax Research, 8(1), 32.
Saad. (2014). Tax knowledge, tax complexity and tax compliance: Taxpayers’ view. Procedia-Social and Behavioral Sciences, 109, 1069-1075.
Sapiei, Kasipilai, & Eze. (2014). Determinants of tax compliance behaviour of corporate taxpayers in Malaysia. eJournal of Tax Research, 12(2), 383. Schisler. (1995). Equity, aggressiveness, consensus: A comparison of taxpayers
and tax preparers. Accounting Horizons, 9(4), 76.
Song, & Yarbrough. (1978). Tax ethics and taxpayer attitudes: A survey. Public administration review, 442-452.
Spicer, & Becker. (1980). Fiscal inequity and tax evasion: An experimental approach. National Tax Journal, 171-175.