Introduction
Meta-analysis and problems of data accuracy
Over the last century the volume of scientific-medical literature has grown exponentially.In order to facilitate the progressive assimilation of such information, there has been a similar growth in the need to critically and systematically synthesize research. This process has been supported by the use of the powerful tools such as meta-analysis and reviews (narratives or systematic reviews). In fact these tools allow researchers to evaluate a set of simultaneous data, through making a summary of the medical literature.They make use of the explicit and reproducible methods for systematically searching for, critically analyzing and producing syntheses of individual studies [1].
Researchers originally began to develop quality scales for experimental studies [2,3,4], however now the interest of researchers is also focused on observational studies [5-7]. An important characteristic of meta-analysis is that the results are determined both by the management in the meta-analysis process and the features of the studies included. The scientific rigor of potential primary studies varies considerably and the common
objection to meta-analytic summaries is that they combine results from studies of different quality [9]. If the quality of the data collected in primary studies is inadequate, this may falsify the conclusions of the review.
Therefore, researchers are now focusing their efforts on implementing strategies to assess the quality of studies [8-10].
The lack of a clear definition of quality represents the first problem faced by those wanting to undertake a quality assessment because it is difficult to estimate something that is not clearly defined.
What is quality?
In the literature there is no specific definition for defining the “quality” of studies. According to Moher et al, “quality gives us an estimate of the likelihood that the results are a valid estimate of the truth” [9,11]. The process of quality assessment implies classifying studies according to a structured list of traits or items that are reported in or determinable from a published paper. These traits are presumed to predict the accuracy of study results and the data reported in the study, where accuracy is a function of both
Quality assessment in meta-analysis
Giuseppe La Torre, Giacomina Chiaradia, Francesco Gianfagna, Angelo De Laurentis,
Stefania Boccia, Walter Ricciardi
Istituto di Igiene, Università Cattolica, Roma
Correspondence to: Giuseppe La Torre, Istituto di Igiene, Unità di Epidemiologia e Biostatistica, Università Cattolica di Roma, Largo F. Vito 1, 00168, Roma. E-mail: [email protected]
Abstract
Background: An important characteristic of meta-analysis is that the results are determined both by the management of the meta-analysis process and by the features of studies included. The scientific rigor of potential primary studies varies considerably and the common objection to meta-analytic summaries is that they combine results from studies of different quality. Researchers began to develop quality scales for experimental studies, however now the interest of researchers is also focusing on observational studies. Since 1980, when Chalmers developed the first quality scale to assess primary studies included in meta-analysis, more than 100 scales have been developed, which vary dramatically in the quality and quantity of the items included. No standard lists of items exist, and the used quality scales lack empirically-supported components.
Methods: Two of the most important and diffuse quality scales for experimental studies, Jadad system and Chalmers’ scale, and a quality scale used for observational studies, developed by Angelillo et al., are described and compared.
Conclusion: The fallibility of meta-analysis is not surprising, considering the various bias that may be introduced by the processes of locating and selecting studies, including publication bias, language bias and citation bias. Quality assessment of the studies offers an estimate of the likelihood that their results will express the truth.
systematic and random error, to detect potential sources of bias in meta-analytic results and to characterise the strengths and limitations of the research in an area of study [12,13].
Often to each of these items is assigned a number of points based on a priori judgement of clinical investigators, which are then summed into a ‘quality score’ that summarizes the essential features of the many dimensions of quality [2,14]. These items should be independently evaluated by at least two raters, who are blinded both to the authors and the results of the study in order to avoid conditioning of the raters to these elements and to limit subjective components [15,16]. Differences among evaluators are resolved through discussion and rereading. Finally, the score is used to exclude low-quality studies from the analysis or to weight the data of different studies according to their quality scores, or as a descriptive characteristic of the study, used to explain study variability and heterogeneity [15]. The analysis of overlapping of the 95% confidence intervals could be useful to confirm differences between two groups [6,17,18].
Despite the double-rater and the blinding judgement, many limitations of quality assessment persists, such as the difficulty to quantify the items and the lack of constraints in selecting an evidence-based quality scale, which contribute to enhancing the subjectivity of the instrument involved.
Limits of quality assessment Difficulty to assess
Quality assessment is based on data and information reported in primary studies that have to then be explained in the full-text section of the article. However, sometimes research studies are poorly reported, so it could be possible that some of the items are not reported in the text of the article even if they are present in the study [19]. For this reason, well-designed but poorly reported studies could be perceived as being of lower quality than studies reporting more data, independent of their validity [20].This represents the first problem, which is difficult to resolve without requesting further information from the authors.
Furthermore, it appears that quality is of a fairly high dimension and possibly non-additive and nonlinear, and that quality dimensions are highly application-specific and hard to measure from published information [14]. So the information that can be derived from a quality assessment becomes limited.
It is therefore necessary that the reporting of research investigations has to be improved and standardized [16,21-24]. Over the last few years, the
overall quality of trials has significantly increased [18], but this is not happened to the same extent for observational studies which often still remain considerably different from one and other.
Lack of evidence-based scale
Since 1980, when Chalmers developed the first quality scale to assess primary studies included in meta-analysis [2], more than 100 scales have been developed [25], that vary dramatically in the quality and quantity of the items included. Although research methods experts list many similar components of quality, their lists are rarely identical, and the definitions of the items also varies substantially. No standard lists of items exist, and the used quality scales lack empirically-supported components. Efforts are required to document the link between the different items and the results of meta-analyses. However, this is limited by the intrinsic characteristic of study design. Moreover, even when the same study design is considered, different items impact on the results of different areas of study [2,6]. Despite these facts, focusing on empirically-verified criteria is mandatory.
Another important controversial issue is the scoring of items: some scales use gradation of score within each of the items while others score only their presence or absence [8]. In the first case, different weights are given to different items, but it is not done in any standardized way. This therefore represents a vary important source of subjectivity in considering the importance of the different items on the total score. In this case the challenge requires more effort, since the entity of the item’s impact on the meta-analysis result is more difficult to estimate. In any case, if a different weight could be assigned to an item, it is worth establishing a fixed score (without the possibility of gradation) a priori, to limit the subjectivity of the scoring.
possible [8].The latter is less useful in experimental studies than in observational studies, whose study design is often not well standardized, for which many items could be required to avoid any kind of bias. Into each group, the sum of a single item generates more different results (0-n) for different studies than a single item score (0-unclear-1). Therefore it is possible to obtain a regression coefficient of the score with regards to the effect estimates, and estimate the impact of that group on the meta-analysis results.
How scoring items should be incorporated within the analysis stage is a matter of ongoing debate. Following the recommendation of the Cochrane Collaboration and other experts in the field, many meta-analysts assess quality [8] by including only studies above some minimum score [15] in a sensitivity analysis. Not all authors agree with this approach, considering that some information will be lost. Some have used quality scores as a weighting variable in averaging across studies (e.g., study weight= score/SE2)
[14,16,27,28], in order to improve signal/noise ratio without excluding any study [16]. However, weighting is not recommended, since weights between item categories are not standardized, therefore selecting them might lead to the incorporation of larger subjective choices than by selecting a cut-off level [15,29].To limit this effect, it has been proposed that one should consider the item score as a potential confounder, therefore to use a regression model in which the quality score and other variables are related to the effect measure [18,29]. However in this process, the possibility of random error has to be considered, since a consistent number of results follows the analysis of numerous items. Using weighting according to a priori selected criteria or to regression results assumes that there is a linear relation between the estimates of quality and effect estimates. It is possible that the scaling relation is not linear and the weighting system is more complex [16].An alternative approach would be to consider the heterogeneity of the results from the pooling of high quality studies, while excluding low-quality studies if the results from the subgroup analysis are less heterogeneous. However this process leads to an overestimation of the impact of the quality score on the results, because this is presumed based on its grade of heterogeneity.This is turn results in a selection of extreme values, which could be due to chance.
Effects of drifting
Difficulty in assessing a reliable finding advocates the importance of obtaining an
acceptable concordance between raters, i.e. reproducibility of a scale [30,31]. Silva Filho et al. compared different quality assessment tools applied to a group of clinical trials on the same topic. It revealed that the concordance between reviewers varied according to the instrument utilized (D=0.12-0.53) and the Cochrane Collaboration scale obtaining the major level of concordance [1]. Reliability improvement could be achieved by reading a standardized sheet in which examples of scoring are given, thus encouraging the raters to use the same yardstick. Different ideas of quality without the constraints to use a standardized method have lead to the development of different scales: so it is not surprising that these scales have yielded different findings when they were used for the same research, even reversing the effect direction [8,13,30,32]. Unfortunately, quality scale are often used to contrast, model, or modify meta-analysis results without regard to the aforementioned problems, as when used to directly modify weights or contributions of individual studies in an ad hoc manner [14]. In fact, many authors refuse the quality-score approach, with some indicating quality assessment as the most insidious form of bias in the conduct of meta-analysis [29,33]. To standardize the method for any topic, we need to evaluate the impact of items on meta-analysis results.To obtain this goal, it is necessary that meta-analysts calculate the impact of any group of items and that results are reported with their explicit criteria given in full-text. Furthermore, the use of the same unit will facilitate the pooling of the data. Coefficient regression of correlation between quality scoring of item groups and effect estimates (metaregression), and the threshold level in which the heterogeneity ratio between high and low quality is smaller for each item group, could be a good choice. If used separately they could lead to random error and selection bias, while merging them could limit this effect. Furthermore, this process could be useful in future to calculate the cut-off level for high and low quality studies, and the extent of weighting with which low quality studies could be analysed. In order to come to a more cautious decision, it is necessary to also consider the number of “unclear” items. In doing so we obtain a quality scale system that fits itself to the data set, avoiding subjectivity and non-applicability of some of the criteria on all of the topics.
Quality assessment of experimental studies
correct manner in which to conduct the study and on the control of bias. In fact, the interpretation and application of the results depends on the proper conduct of the randomization process, the description of the patients accepted as well as of the patients not accepted in the trial, the experimental and supplementary treatment regimens, those who withdrew, the blinding method used (where appropriate), testing of how well the rules have been followed and the use of proper statistical analysis. Several studies suggested that specific measures of trial quality, such as concealment of random allocation, blinding of patients and outcome assessors, handling of dropouts may significantly influence observed treatment effects in single studies and meta-analysis results. There are a number of reasons for attempting to develop a useful technique to assess the quality of a randomized controlled trial. For example, in many instances small and inconclusive studies have been reported to show no effect of a therapy that seemed promising enough to warrant independent studies. It is conceivable that useful clinical effects might be better understood and accepted if one could combine the data from several well-designed studies. On the other hand, large studies sometimes have conflicting conclusions. Avalid resolution of conflicting conclusions would be facilitated by an assessment of quality [2].
Two of the most important and diffuse quality scales, Jadad system [3] and Chalmers’ scale [2] are described in the following section.
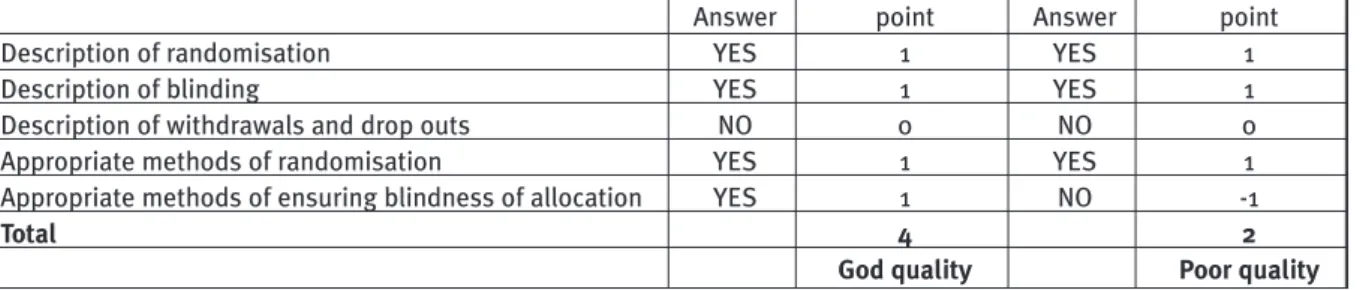
The Jadad system consists of three topics (description of randomisation, of blinding, of withdrawals and drop outs) that are directly related to reducing bias. The possible answers to all the three questions are yes/no. There are five possible points for its quality score: three single points for yes responses and two additional points for appropriate methods of randomization and ensuring blindness of allocation. If for the additional points give a negative answer, we have to reduce the score of -1. So, the highest score is 5, and the lowest one is -2.The trial is judged to be
of bad quality if the total score is < 3. In Table 1 an example of Jadad scoring system is described.
Chalmers’ scale analyses four aspects of an RCT in its assessment of the quality of the research: 1) basic descriptive material, 2) the study protocol, 3) the analysis of the data, and 4) data useful for potential combining of several RCT results. Data regarding the four different aspects are filled in four different forms. In particular, the Form 1 includes basic identifying data and other elements, such as whether or not the journal articles are known to be peer reviewed; sources of financial support for the trial; whether or not a biostatistician is an author or mentioned as a consultant, sources and numbers of patients, type of trial and author’s statement of significant findings. The items included in Form 2 regard description of inclusion and rejection criteria, the eligible population not accepted for the trial, withdrawals or dropouts, therapeutic regimens, blinding procedures, testing procedures. Items in Form 3 relate to the statistical significance, posterior b estimates of observed difference for negative trials, statistical inference, appropriate statistical analysis, handling of withdrawals, statistical discussion of side effects, retrospective analysis, blinding of statistician. Items listed in Form 4 include the dates that the study started and stopped, results of the pre-randomization data analysis, tabulation of endpoints and timing of events considered in the study (such as death but also withdrawals). Form 2 is filled out by two or more professionally trained people with experience in clinical trials. Forms 1, 3, and 4 are not seen or completed by these evaluators until after Form 2 has been filled out. Differences among evaluators are resolved by consultation. A score is awarded to each item on each form when the item is applicable. The total score is then divided by the total possible score, i.e., not applicable item scores are not counted in the denominator. Finally, an overall quality index for each trial is obtained by adding up the item scored. In creating this overall index, three aspects of each trial were graded: 1) the design of the trial and the trials protocol (Form 2, weight = 0.600);
Table 1. Hypotetical examples of RCT scoring according to Jadad
Answer point Answer point
Description of randomisation YES 1 YES 1
Description of blinding YES 1 YES 1
Description of withdrawals and drop outs NO 0 NO 0
Appropriate methods of randomisation YES 1 YES 1
Appropriate methods of ensuring blindness of allocation YES 1 NO -1
Total 4 2
2) the statistical analysis of the trial (Form 3, weight = 0.300); and 3) the presentation of trial results (Form 4, weight = 0.100) [2].
Both scales described how the items should be scored when assessing the quality [2,3].
It is evident that the two scales are very different. The scale developed by Jadad is composed of only three items and gives weight to the quality of reporting than to methodological quality [26].The scale developed by Chalmers is composed of thirty-three items grouped in four forms and gives weight to both the quality of reporting and the methodological quality. Compared to Jadad system, Chalmers’scale is very long and less easy to manage (reviewers need more time to assess quality) but the final judgment is more precise. Even if the scales vary in their size, complexity and level of development, it would be useful to ascertain whether different scales, when applied to the same study, provide similar results. This information could guide assessors in their choice of scale.
Quality assessment of observational studies
Although RCTs are considered to provide the strongest evidence regarding an intervention, in many situations randomized controlled designs are not feasible and only data from observational studies are available [7].These studies may lack the experimental element of a random allocation to an intervention, therefore they risk being more biased than clinical trials. Since they are based on finding differences between the different exposure characteristics or the outcomes between 2 groups, selection bias could strongly affect the results. Furthermore, patients could recall the information on exposure better than healthy controls (recall bias, in case-control studies), and investigators could influence the data reported, if he sets up questions according to his scope, affecting the patient answers consecutively (reporting bias).
In this section we describe a quality scale used for observational studies, developed by Angelillo et al. [5], reviewed and re-proposed from Pavia et al. [34] (Table 2). For each item met in the primary article, 1 point is assigned to the study, except for items evaluating data analysis, which were scored as 0.5. The authors face the problem of poor reporting and have to consider the data that is not specifically indicated in the text as not observed. Finally, a sensitivity analysis was performed on the results by two subgroups, which were based on individual scores above or below 50% of the maximum score. Moreover, the quality scores were included in a multivariate meta-regression analysis. The first section, divided according to study design, is set to avoid selection bias. The random
selection of cases and controls limits the possibility that the wrong people enter into the study population and limits the disparity of the distribution of potential confounders in each group. The same occurs when all individuals of a specific population are included, e.g. all cases affected by the same disease in a defined period and in the same place (I).Item IV deals with the selection of controls, which should ideally originate from the same population of cases.The response rate, in particular the number of the subjects lost to follow-up, indicates the proportion of individuals that refuse to participate to the study; which may be due to a
Table 2. Quality scale used for observational studies
Case-control studies
I Cases either randomly selected or selected to
include all cases in a specific population
II Cases identified without knowledge of
exposure status
III Response rate for identified cases >75%
IV Control drawn randomly from the same
population of cases
V No known association between control status
and exposure
VI Response rate for identified controls >75%
Cohort studies
VII Initial response rate >75%
VIII Comparison of persons who did and did not
participate
IX Follow-up rate >75%
X Comparison of who were and were not lost to
follow-up
XI Exposed or nonexposed subjects identified
without knowledge of disease status
XII No known association between nonexposed
status and disease
All studies
Misclassification bias
XIII Exposure assessment made blindly with
respect to the case-control status of subjects
XIV Exposure evaluations made in relation to the
time of diagnosis
XV Method of determining the exposure
XVI Specific disease criteria given
XVII Disease validated by histology or other gold
standard
Adjustment or matching for confounders
XVIII <list of potential confounders specific for
scope of the meta-analysis>
Data analysis
XIX Demographic data listed
XX Statistical analysis of demographic data
XXI Power calculations performed
XXII Precise P values or CIs given
specific characteristic of the individuals, resulting in selection bias (III, VI-X). Moreover, absence of blindness from the investigators regarding the status of disease/exposure of potentially eligible individuals could influence the decision to exclude or included an individual based on his peculiar characteristic (II,V, XI, XII).All of these items aim to highlight selection biases in the studies.
Items XIII-XVII, which relate to the definition of disease or exposure status, are set to limit information bias (misclassification). Incorrect labelling of included individuals as exposed or not exposed (XIII,XV) and as diseased or not diseased (XVI,XVII) could result in underestimation of the effect. In particular, blinding of the subjects (unaware of scope of data collection) and of the data collector (XIII) could limit recall and reporting bias; lastly, the time lag between exposure and effect has to be properly considered in order to avoid easy cause-effect associations and overestimation of the effect (XIV).
The XVIII item is variable according to the aim of the meta-analysis.The meta-analysts establishes a priori, a list of potential confounders, and 1 point has to be assigned to each of the confounding factors considered in the study. Finally, items XIX-XXIII concern all of the indexes of global data quality collected during the study.
Although almost complete, not all observational studies could be assessed by this scale.An example could be genetic association studies, for which other scales could be used.To this aim, Boccia and La Torre [6] added some items to the previous scale, specific for the genetic epidemiology field. Since genetic analyses may be affected by laboratory mistakes in samples of genotyping, analysts should perform the analysis twice for a small sample subset, in order to validate the laboratory procedure (a). It is also suggested that the allele frequencies should be tested to determine if they are in Hardy-Weinberg equilibrium, in order to both exclude a genotyping error and a selection bias in the control group (b); two general items are also added in this scale: (c) to check if the controls are drawn from population rather than from the hospital, and (d) the time and place of individuals selection should be specified. a. Reproducibility of laboratory tests mentioned b.Hardy-Weinberg equilibrium assessed
c. Population-based controls
d.Place and time of the study reported
Effects of quality assessment on meta-analysis results
The authors of the different scales clearly had different perceptions of quality but definitions
were rarely given. Different ideas of quality determined the development of different scales, so it is not surprising that these scales generate discrepant results when applied to different studies [30].
The quality of primary studies included in meta-analyses can influence results in unpredictable ways,including masking or even reversing the effect direction [32].When comparing low-quality studies with high quality studies, some researchers found that low-quality studies underestimated effect sizes compared to high-quality studies. In contrast, other researchers have documented larger effect sizes among the low-quality studies and other researchers found no or limited association between overall quality scores and effect sizes [8]. Different scales generate diverse assessments of study quality, which may cause inconsistency in the efforts to relate study quality to outcome. Juni et al. [30] compared the results from 25 quality scales that were applied to studies comparing low molecular- weight heparin with standard heparin. For six quality scales the relative risks were nearly identical for both treatments in high-quality trials, whereas better effects for low-molecular-weight heparin were documented in low-quality trials. Seven scales documented an opposite trend: no intervention differences for low-molecular weight heparin were found in low-quality trials, but high-quality trials showed evidence of improved outcomes. For the remaining 12 studies, no differences by study quality were documented. The authors noted that these discrepant results were not surprising given the heterogeneous nature of the quality scales.
Conclusions
other hand, a well-designed trial that is poorly reported would receive a low-quality score.
It is clear that the assessment of the quality of primary studies is very difficult and despite the enormous time and energy required to develop a scale, a lot of them have many weakness. Because of this, it is important to create standard techniques to develop a scale and caution is recommended in assessing quality using scales that have not been adequately developed. Some important elements of scales that should be applied in general to all items in all studies are its ease of use and the rigorously development of the scale. Quality assessment of trials used in meta-analysis is very important. In fact, the safety and efficacy results of a meta-analysis are significantly affected by the quality of the original trials: if quality is not formally assessed then the results may be less meaningful [11].
References
1) Silva Filho CR, Saconato H, Conterno LO, Marques I, Atallah AN.Assessment of clinical trial quality and its impact on meta-analyses. Rev Saude Publica 2005; 39(6): 865-73.
2) Chalmers T, Smith H, Blackburn B, et al.A method for assessing the quality of a randomized control trial. Controlled Clinical Trials 1981; 2: 31–49.
3) Jadad AR, Moore A, Carroll D, et al. Assessing the quality of reports of randomized clinical trials: is blinding necessary? Control Clin Trials 1996;17(1): 1–12.
4) Schulz KF, Chalmers I, Hayes RJ, Altman DG. Empirical evidence of bias. Dimensions of methodological quality associated with estimates of treatment effects in controlled trials. J Am Med Assoc 1995;273(5): 408–12.
5) Angelillo IF,Villari P. Residential exposure to electromagnetic fields and childhood leukaemia: a meta-analysis. Bull World Health Organ 1999; 77(11):906-15.
6) Boccia S, La Torre G, Gianfagna F, Mannocci A, Ricciardi G. Glutathione S-transferase T1 status and gastric cancer risk: a meta-analysis of the literature. Mutagenesis 2006;21(2): 115-23. 7) Stroup DF, Berlin JA, Morton SC, et al. Meta-analysis of observational studies in epidemiology: a proposal for reporting. Meta-analysis Of Observational Studies in Epidemiology (MOOSE) group. JAMA 2000;19: 2008-12. 8) Conn VS,Rantz MJ.Research methods:managing primary study quality in meta-analyses. Res Nurs Health 2003; 26(4): 322-33. 9) Moher, D, Cook, D, Jadad, A, et al. Assessing the quality of reports of randomised trials: Implications for the conduct of meta-analyses. Health Technology Assessment 1999; 3(12): 1–98. 10) Saunders L, Soomro G, Buckingham J, Jamtvedt G, Raina P. Assessing the methodological quality of nonrandomized intervention studies. Western Journal of Nursing Research 2003; 25: 223–37.
11) Moher D, Jadad A, Nichol G, Penman M.,Tugwell P,Walsh S. Assessing the quality of randomized controlled trials: An annotated bibliography of scales and checklists. Controlled Clinical Trials 1995; 16: 62–73.
12) Rothman KJ, Greenland S. Accuracy considerations in study design. In Rothman KJ and Greenland S. (eds) Modern epidemiology, 2nd edn. 1998, Philadelphia, Lippincott, pp. 135-45. 13) Moyer A, Finney JW. Rating methodological quality: toward improved assessment and investigation. Account Res 2005; 12(4): 299-313.
14) Greenland S, O’Rourke K. On the bias produced by quality scores in meta-analysis, and a hierarchical view of proposed solutions. Biostatistics 2001; 2(4): 463-71.
15) Berman NG, Parker RA. Meta-analysis: neither quick nor easy. BMC Med Res Methodol 2002; 2:10.
16) Moher D, Pham B, Jones A, et al. Does quality of reports of randomised trials affect estimates of intervention efficacy reported in meta-analyses? Lancet 1998; 352(9128): 609-13. 17) Egger M, Davey Smith G, Altman DG. (eds). Systematic Reviews in Health Care. Meta-analysis in Context. BMJ Books, London, pp. 285-312.
18) Villari P, Manzoli L, Boccia A. Methodological quality of studies and patient age as major sources of variation in efficacy estimates of influenza vaccination in healthy adults: a meta-analysis.Vaccine 2004; 22: 3475–86.
19) Westwood ME, Whiting PF, Kleijnen J. How does study quality affect the results of a diagnostic meta-analysis? BMC Med Res Methodol 2005; 5(1): 20.
20) Sindhu F, Carpenter L, Seers K. Development of a tool to rate the quality assessment of randomized controlled trials using a Delphi technique. J Adv Nursing 1997; 25, 1262–68. 21) Bossuyt PMM, Reitsma JB, Bruns DE, et al. The STARD statement for reporting studies of diagnostic accuracy: Explanation and elaboration.Ann Inter Med 2003,138:W1-W12. 22) Begg CB, Cho MK, Eastwood S, et al. Improving the quality of reporting of randomized controlled trials: the CONSORT statement. JAMA 1996; 276: 637-9.
23) The Standards of Reporting Trials Group. A proposal for structured reporting of randomized controlled trials. JAMA 1994; 272: 1926-31.
24) The Asilomar Working Group on Recommendations for Reporting of Clinical Trials in the Biomedical Literature. Checklist of information for inclusion in reports of clinical trials.Ann Intern Med 1996; 124: 741-3.
25) West S, King V, Carey T, et al. Systems to rate the strength of scientific evidence. Evidence Report/Technology Assessment No. 47 AHRQ (Publication No. 02-E016). [Prepared by Research Triangle Institute–University of North Carolina Evidence-Based Practice Center under Contract No. 290-97-0011.] Rockville, MD:Agency of Healthcare Research and Quality, 2002. 26) Juni P, Altman DG, Egger M: Systematic reviews in healthcare: Assessing the quality of controlled clinical trials.BMJ 2001;323:42-6. 27) Fleiss JL, Gross AJ. Meta-analysis in epidemiology, with special reference to studies of the association between exposure to environmental tobacco smoke and lung cancer: a critique. J Clin Epidemiol 1991; 44(2):127-39.
28) Berard A, Bravo G. Combining studies using effect sizes and quality scores: application to bone loss in postmenopausal women. J Clin Epidemiol 1998; 51(10): 801-7.
29) Bohning D. Meta-analysis: a unifying meta-likelihood approach framing unobserved heterogeneity, study covariates, publication bias, and study quality. Methods Inf Med 2005; 44(1):127-35.
30) Juni P, Witschi A, Bloch R, Egger M.The hazards of scoring the quality of clinical trials for meta-analysis. JAMA. 1999; 282(11): 1054-60.
31) Balk EM, Bonis PA, Moskowitz H, et al. Correlation of quality measures with estimates of treatment effect in meta-analyses of randomized controlled trials. JAMA 2002;287(22):2973-82. 32) Sterne J, Juni P, Schulz K, Altman D, Bartlett C, Egger M. Statistical methods for assessing the influence of study characteristics on treatment effects in ‘‘meta-epidemiological’’ research. Stat Med 2002; 21: 1513–24.
33) Greenland S. Invited commentary: a critical look at some popular meta-analytic methods.Am J Epidemiol 1994; 140: 290-6. 34) Pavia M, Pileggi C, Nobile CG, Angelillo IF. Association between fruit and vegetable consumption and oral cancer: a meta-analysis of observational studies. Am J Clin Nutr 2006; 83(5): 1126-34.