http://www.sciencepublishinggroup.com/j/sjedu doi: 10.11648/j.sjedu.20190701.18
ISSN: 2329-0900 (Print); ISSN: 2329-0897 (Online)
Measuring Quality Teaching: Developing a Process
Focused Framework
Li Yan, Gao Yang
Department of Finance and Economics, Tianjin City Vocational College, Tianjin, China
Email address:
To cite this article:
Li Yan, Gao Yang. Measuring Quality Teaching: Developing A Process Focused Framework. Science Journal of Education.
Vol. 7, No. 1, 2019, pp. 42-49. doi: 10.11648/j.sjedu.20190701.18
Received: April 29, 2019; Accepted: May 26, 2019; Published: June 15, 2019
Abstract:
There is international acknowledgement that the ability of industry and nations to meet the competitive challenges of a growing global economy is often determined by the acquired industry relevant, knowledge, skills and attitudes of its workforce. A significant factor impacting on the level of success achieved by individuals can be directly related to the quality of the teaching experienced in formal Tertiary Vocational Education and Training (TVET) educational settings. The purpose of this paper is to explore, through a documented Chinese case-study of Tianjin City Vocational College, how quality teaching can be measured. The project methodology used was based on an intuitive-rational approach segmented into three (3) phases; preparation, process and reporting. The preparation phase focused on defining quality teaching and developing four research instruments to investigate quality teaching practices. The process phase involved gathering and analysing data generated from questionnaires, classroom observations and interviews. The reporting phase presented the findings of the research to relevant stakeholders. In reviewing the initial findings, it was acknowledged that the framework proposed does not match other quality evaluation methodologies in this area. This is partially because this evaluation methodology used focused on the actual teaching and learning experienced by participants. This measurement of the process at the point of delivery, rather than the outcomes at the point of completion, provides a detailed overview of the current educational climate and teaching practices of the institution being investigated. The data generated allows institutional response to improving teaching quality to be pro-active, impacting on current teaching practices, rather than reactive, focusing on past teaching practices. It was concluded that the evaluation framework created, and the associated research instruments developed, were robust and reliable. It was argued that they could be used with confidence by TVET institutions who want to pro-actively improve the teaching quality experienced by their learners.Keywords:
Quality Teaching, Person-Environment Fit, Direct Assessment, Evaluation1. Quality Teaching
1.1. Background
The quality and relevance of educational delivery has emerged as a prominent concern in recent discussions on tertiary educational reform. The increasing demands of a technologically driven knowledge economy means learners need to acquire the relevant knowledge, skills and attitudes industry demands. Failure to gain the relevant knowledge, skills and attitudes undermines both the employability of individuals and the competitiveness of the nation. Increasingly industry is looking to Tertiary Vocational Education and Training (TVET) institutions to produce
1.2. Emerging Teaching Practices
In traditional TVET institutions there is general agreement that a teachers’ technical and procedural knowledge of the content taught is an important factor in enabling learners to participate successfully in that discipline. In these environments’ teacher’s rigid classroom management practices – enabling the transmission of knowledge - determines the quality of the educational event delivered [3]. However, the constantly expanding knowledge base of disciplines, the changes in required skills driven by technological advances and the ever-changing demands of industry mean traditional classroom management dominated, knowledge transmission focused approaches fail to produce the creative, innovative, add-value graduate industry and society demand [4].
To meet these demands teaching needs to be focused on helping learners to identify the right questions, find the best answers, inspiring learners to take risk and to help them develop an add-value attitude. In these environments’ classrooms are not managed. Instead teachers use a range of personal skills and instructional strategies to adapt the technical and procedural knowledge presented to meet the educational, social, employment and cultural needs of learners. Teachers need to be able to promote learner’s cognitive processes, promote affective-motivational processes, and promote social processes in students. Teachers are now facilitators of leaning not repositories of knowledge [5].
1.3. Measurements of Quality
Despite numerous flaws, outcome indicators, (such as levels of student engagement, achievement and retention), are internationally used as measures of teacher effectiveness. In fact, student performance, often measured using standardised tests in specific subject areas, is used as a proxy for defining teacher quality in both the policy and research literature [6]. But these measures only capture the final result of teacher performance. They do not measure the teachers’ actual teaching activities and classroom behaviour. Researchers argue these quantitative measures, focused on educational outcomes achieved, are reactive measuring “after the teaching” results and are considered reflection-on-action. In essence, the data generated by outcome measures do not adequately measure the details of the learning and teaching process or the impact of change on participant’s engagement [9].
Measuring the quality of teaching processes—the quality of the learning experience of learners—is very complex. A number of interrelated factors, such as tutors pedagogical skill, tutors discipline knowledge, physical spaces, learning resources, learner attitudes, assessments, classroom culture, need to be considered. The actual quality of teaching experienced by the learner will be determined jointly by themselves as individual and the environment they learn within. This approach to teaching quality, where indicators are not generated by the person or their environment
separately (but rather by their fit or congruence with each other) is based on a person– environment fit (P–E fit) theory [8].
1.4. Paper Structure
This paper uses data generated from four quality teaching evaluation instruments used in Tianjin City Vocational College in China. The first section provides details on the context of the study. The second section describes the four evaluation instruments developed to investigate quality teaching. The third section provides a commentary on the data generated from the instruments. The final section discusses the quality teaching evaluation framework developed.
2. Context
2.1. Overview
In 2018 the President of Tianjin City Vocational College, with a role of over 5,000 learners and 300 tutors, acknowledging that quality teaching had a significant impact on learner performance, initiated a project to investigate teaching and learning quality within the institution. The project methodology was based on an intuitive-rational approach segmented into three (3) phases; preparation, process and reporting. The preparation phase focused on defining what was meant by quality teaching and identifying research instruments to investigate teaching practices. The process phase involved the pre-visit deployment of questionnaires and onsite classroom observations and interviews. The reporting phase involved presenting preliminary reports to stakeholders and preparing a final report [7].
2.2. Measuring Quality
During the preparation phase of the project four evaluation instruments - tutor survey, student survey, student interviews and classroom observations - based on exploring the learning environment of learners and tutors were identified. The evaluation instruments used are described below:
i. Student Survey: Learner perceptions of their personal competence, negative and positive, of their ability to learn is a powerful indicator of how teachers are teaching and ultimately on their performance.
ii. Tutor Survey: Tutor perceptions of their personal competence, negative and positive of their teaching efficiency and effectiveness is a powerful indicator of how they teach and ultimately on learner outcomes. iii.Structured Student Interviews: Interviews provide a
holistic snapshot of the area investigated, enabling participants to express in more detail their thoughts and feelings.
2.3. Benefits
It was anticipated that exploring the learning environments of learners and tutors created in this Inner-City Vocational College, using these four instruments, would provide the following benefits:
i. It would enable the researcher to evaluate, and report on, the actual impact of teaching on learning at the point of delivery.
ii. The combined data generated by all the evaluation instruments would enable stakeholders and participants to identify areas of teaching strength and areas for improvement.
iii.Identification of specific strengths and weaknesses in teaching practices help to clarify capability development needs of tutors.
Providing capability development events at point of need means adjustments and refinements can be implemented to teaching practices during, not after, delivery. The final report generated from the data can be used to guide changes to physical spaces, facilitate improvements in actual practice, and monitor the effectiveness teaching at multiple points during, not only at the completion, of the academic year.
3. Instrument Design and Development
3.1. Student Survey
The essence of a learning environment is the interaction that occurs between individuals, groups and the setting within which they operate. Learner and teacher impressions of the environment in which they operate are a vital indicator of teaching quality. Their reactions to, and perceptions of, this environment have a significant impact on individual and group performance. Research indicates learner achievement is enhanced in those environments which students feel comfortable within and positive about. In educational settings several performance measures have been created using P–E fit theory. These instruments are developed with the formula, B = f (P, E) where behaviour (B) is considered to be a function of (f), the person (P), and the environment (E) [9].
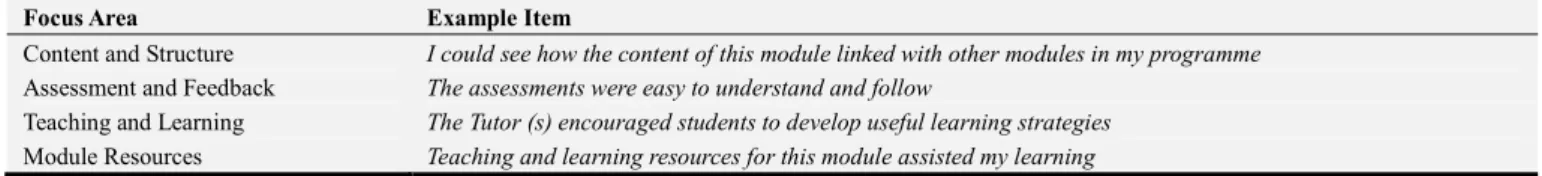
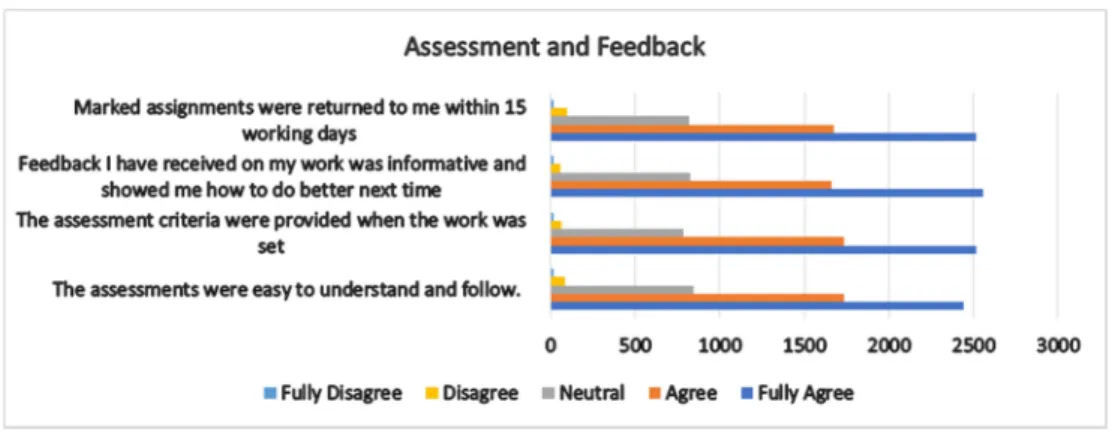
To investigate in more depth learner’s attitudes to their learning environment, four focus areas were identified. Each focus area contained four items, 16 items in total. The items contained statements about their experienced learning environment. Learners were asked to reflect on their environment and, using a five (5) point Leichhardt scale, agree or disagree if the practice actually took place in their environment [10]. This is scales and items are illustrated in Table 1 below.
Table 1. Student Survey Instrument.
Focus Area Example Item
Content and Structure I could see how the content of this module linked with other modules in my programme Assessment and Feedback The assessments were easy to understand and follow
Teaching and Learning The Tutor (s) encouraged students to develop useful learning strategies
Module Resources Teaching and learning resources for this module assisted my learning
3.2. Tutor Survey
A tutors’ ability to see themselves as capable of providing instruction within a specific discipline area, their belief that the instruction provided will actively engage learners and their confidence they are positively impacting on learner achievement, provides the foundation of teacher efficacy. The tutors positive, or negative, judgment of their personal competence of teaching has proven to be a powerful indicator of how much time teachers spend in teaching content and ultimately student outcomes. Research indicates that teachers with a strong sense of self-efficacy are better planners, are inclined to take risk, are more open-minded and supportive of students [11].
Collective Teacher Efficacy (CTE) is defined as the
collective belief of tutors in their collective ability to positively affect learner achievement. Recent research indicates CTE has twice as much impact on learner’s achievement than the provision of feedback and almost three times bigger than the effect of classroom management [12].
To investigate tutor’s beliefs in their abilities and competencies a short questionnaire was developed. This questionnaire was based on four (4) scales that each contained four (4) items; sixteen (16) items in total. The items contained statements about the teaching practices of participants. Tutors were asked to reflect on their current practice and, using a five (5) point Leichhardt scale, agree or disagree if the practice actually took place in their courses. This is scales and items are illustrated in Table 2 below.
Table 2. Tutor Survey Instrument.
Focus Area Example Item
Communication Students receive adequate course information (subject guides, timetables …) so, they can create a personal study plan Assessment Activities Assessment activities are designed to encourage peer and self-assessment
3.3. Student Interviews
In the field of social science research, the usefulness of interviews has long been recognised and is often a key factor in research design. The value of interviewing is in the holistic snapshot it builds of the area investigated enabling participants to express in more detail their own thoughts and feelings of the learning environment created. Of the three interview methods available (unstructured, structured and narrative) one, structured interviews, using a set of fixed closed questions, has been found to be easy to replicate and very quick to conduct. This structured format also yields numerical data that can be reported succinctly in tables and graphs [13]. In this study the structured interview method allowed the researcher to ask a comprehensive list of
interview questions targeting the specific phenomenon and experiences highlighted in the learner surveys. This allowed a more holistic picture of the learning environment created to be described and reported on [14]. To investigate in more depth learner’s attitudes to their learning environment four focus areas were identified. Each focus area contained a number of closed questions, twenty (20) items in total. The items contained statements about their experienced learning environment. Learners were asked to reflect on their environment and, using a five (3) point Leichhardt scale, agree or disagree on if the practice actually took place in their environment. This is scales and items are illustrated in Table 3 below.
Table 3. Student Structured Interview Instrument.
Focus Area Example Item
Course Organization and Planning The tutor was well prepared for each class period
Communication The tutor used good examples to illustrate and/or to clarify course material
Interaction The tutor is available to provide extra help for this class
Assessment The tutor’s feedback on assignments and exams was useful for learning
3.4. Classroom Observation
For TVET tutors to improve their practice they need to first, critically reflect on their current practices. Second, align their current capabilities against identified standards. Finally, identify how they can improve their knowledge, skills and attitudes of teaching and learning.
Given the multitude of activities that occur in a learning environment this is a complex task and reliance on teacher only self-assessment can be problematic. For example, some studies have found very little correlation between teachers’ self-report assessments of their teaching and their actual practices. Classroom observations provide a neutral, external view of the learning environment. It provides tutors with information on activities and actions they may not be personally aware of [16]. The data generated from classroom observations can provide indicators as to how tutors actions
and or inaction contribute to the learning culture within the environment. The data will also provide insights into how tutors can actively improve their practice. In this study classroom observation was the only opportunity to view the actual practices of teaching and learning within the institution. As such it was an indispensable part of the evaluation of quality teaching [17]. To ensure classroom observations were both accurate (that is, investigate the standards that had been identified) and reliable (that is, would not be influenced by the idiosyncrasies of the observer or a major) an observation marking schedule was developed. This schedule was based on four (4) areas of interest that each contained three (3) specialised items; twelve (12) items in total. The items contained statements about identified teaching practices. Each time a specific practice was observed this was noted in a dynamic spreadsheet. This is illustrated in Table 4 below.
Table 4. Classroom Observation Instrument.
Focus Area Example Item and Practices
Pedagogical Knowledge Item: Monitoring of progress: Practices: Verbal questioning, Monitoring student practice / product, Formative Assessments (short quiz, complete task), Total Group Response (show of hands …)
Instructional Delivery Item: Student Activity: Practices: Asking & responding to questions, Listening & note taking. Participating in discussion, Participating in guided practice
Learning Environment Item: Physical Environment: Practices: Organised, neat and uncluttered, Layout appropriate for teaching approach, Adequate resources to complete tasks, Visually enhanced support materials
Classroom Management Item: Classroom Behaviour: Practices: Positive behaviour is reinforced, Negative behaviour is addressed, Students share responsibility for behaviour
4. Data Generated
4.1. Student Survey
The student survey was completed by 5120 respondents from a range of majors. Given the intent of the survey was to ascertain learner’s perceptions of their learning environment,
individual items of specific interest, generated by an analysis of the data was presented in a segmented graph. Fourth, specific comments on the item, generated by an analysis of
the data, was made.
An example of this process, using the scale assessment and feedback, is illustrated in Figure 1 below.
Figure 1. Scale: Assessment and Feedback.
General Comments: Assessment requirements are clearly explained to learners and marks and feedback are returned promptly. In general learners were pleased with the feedback they received and indicated it helped them plan for future assessments. However, learners indicated assessment processes and procedures were not explained clearly.
A review of the data presented the item - The assessments were easy to understand and follow – warranted further investigation. This was illustrated using a segmented graph shown in Figure 2 below.
Figure 2. Detailed response of Item 4.
Specific Comments: Feed forward is solution-oriented strategy providing learners with a clear indication on how to successfully complete an assignment. It is a diagnostic tool allowing learners to align their current capabilities with the required capabilities. When assessments are unclear these positive impacts of feedforward are lost.
4.2. Tutor Survey
The questionnaire was completed by 71 respondents from a range of majors. Given the intent of the survey was to ascertain tutors’ collective beliefs in their abilities and competencies, stratification of the sample (by age, gender, experience or discipline) was not deemed necessary and therefore is not reported on. In reporting the data, a set procedure was followed. First, the responses from all the items in an identified focus area was. presented using a cluster bar graph. Second, general comments based on the analysis of the collective data of the identified focus area was made Third, individual items of specific interest, generated by an analysis of the data was presented in a segmented graph. Fourth, specific comments on the item, generated by an analysis of the data, was made.
An example of this process, using the scale assessment and feedback, is illustrated in Figure 3 below.
General Comments: Collectively tutors were confident they provided learners with clear explanations of the assessment tasks to be undertaken during the course. However, assessment tasks were not always designed to encourage peer and/or self-assessment and some tutors recognised feedback on assessment activities could be improved. Tutors also acknowledged pre- moderation of assessments by peers was not always completed.
A review of the data presented the item – I check with peers to ensure the assessment will achieve the desired outcomes – warranted further investigation. This was illustrated using a segmented graph shown in Figure 4 below.
Figure 4. Detailed response of Item 3.
Specific Comments: The development of shared
understanding is a critical factor in building a sense of collective. All members of the collective group need to have a clear understanding of how they develop assessment activities to collect evidence and provide feedback. This would create a starting point for the creation of this shared collective understanding. One approach that could be used to provide this foundation would be the introduction of peer verification for pre- and post-assessment activities.
4.3. Student Interviews
Group interviews were conducted with 46 respondents from a range of majors. Given the intent of the interviews was to ascertain learner’s collective beliefs about their learning, stratification of the sample (by age, gender, experience or discipline) was not deemed necessary and therefore is not reported on. In reporting the data, a set procedure was followed. First, the responses from all the items in an identified focus area was presented using a cluster bar graph. Second, general comments based on the analysis of the collective data of the identified focus area was made. Third, individual items of specific interest, generated by an analysis of the data was presented in a segmented graph. Fourth, specific comments on the item, generated by an analysis of the data, was made.
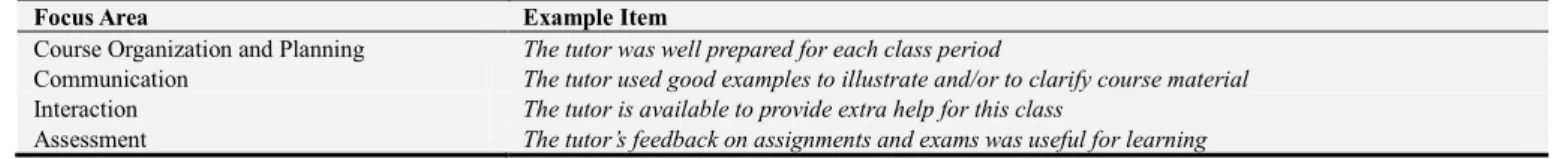
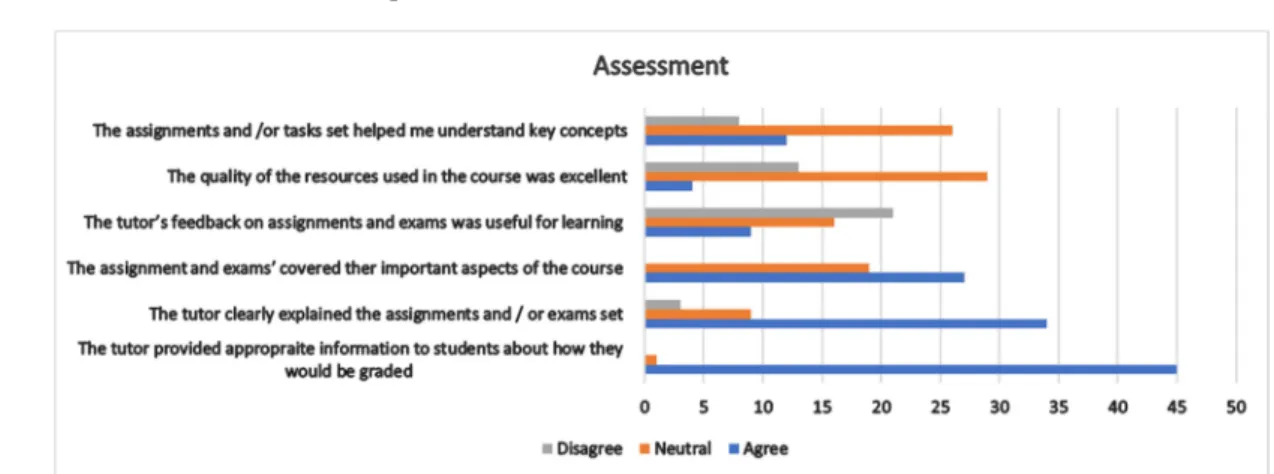
An example of this process, using the scale assessment is illustrated in Figure 5 below.
Figure 5. Scale: Assessment.
General Comments: Collectively learners indicated that tutors provided them with relevant information on how they would be assessed in the course. Tutors also provided detailed explanations of how to complete the assessments set. However, learners indicated that neither the assessments themselves, nor the feedback provided to them after the assessment, helped them either understand the key concepts investigated or how to improve their success through adopting or modifying learning strategies.
A review of the data presented the item – The tutor’s feedback on assignments and exams was useful for learning– warranted further investigation. This was illustrated using a
Specific Comments: It appears that Tutors had sound disciplinary knowledge and are skilled in creating assessments that examines learners’ acquisition of this knowledge. However, the feedback provided was often superficial, lacking the depth required to stimulate reflection or to motivate learners to engage in future learning activities. In essence, the data indicates teaching quality would increase if tutors were regularly exposed to pedagogical skills focused on effective assessment design and the provision of feedback in TVET settings.
4.4. Classroom Observations
During a three-day period twelve (12) observations were completed in a range of majors and in a range of environments (classrooms, workshops, computer suites). Given the intent of the observation was to ascertain tutors’ actual practices in teaching and learning, stratification of the sample (by subject specialty or programme major) was not deemed necessary and therefore is not reported on. In reporting the data, a set procedure was followed. First, individual items, and associated practices, was presented in segmented graphs. Second, specific comments on the item data was made. Third, general comments on the data was shard. An example of this process, using the item Teaching Strategies is illustrated in Figure 7 below.
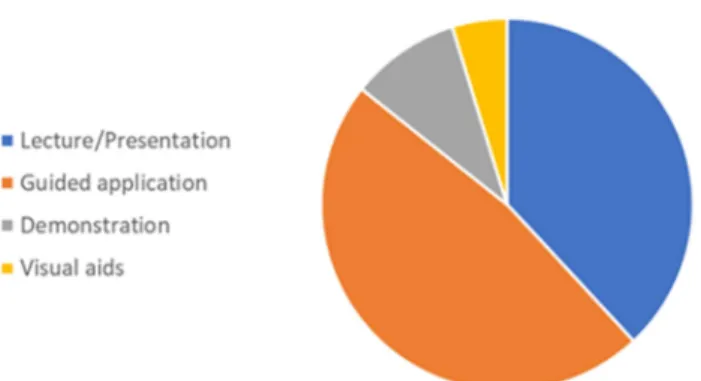
Figure 7. Item: Teaching Strategies.
General Comments: The predominate forms of tutor-learner engagement is presentation and guided application. These can be regarded as teacher centric. Physical demonstrations of skills / procedures / processes were often limited by the classroom layout. In some observed environments the smart use of mobile technologies overcame the difficulties created by the physical layout.
5. Discussion and Review
In reviewing the initial findings of this evaluation framework for quality teaching it must be acknowledged it does not match other evaluation methodologies in this area. This is partially because this evaluation reported on the actual teaching and learning experienced by participants at the point of delivery, measuring the process, rather than the using the outcomes of the teaching at the point of completion.
In essence the framework will provide a detailed snapshot in time of the current educational climate and teaching practices of the institution being investigated.
This paper has demonstrated that using the quality teaching evaluation framework developed enables researchers to measure, and report on, the actual impact of teaching practices on learning during the process of delivery. The combined data generated by all the evaluation instruments enables institutional leaders, tutors and learners to identify teaching strategies that impact positively on learner achievement. The data also describes approaches that impede learner success. This reflective analysis on the data generated drives a cycle of continuous improvement. This ensures adjustments and refinements to learning events are timely, implemented during, not after, delivery. This means the changes made will impact positively on learner achievement before the learner completes their studies and not occur retrospectively.
The final report generated from the data generated can also be used to guide changes to actual physical layout of classrooms, support spaces and workshops, facilitate improvements in institutional teaching practices, and provide a benchmark to continuously monitor the effectiveness of teaching at multiple points during - not solely at the completion - of the academic year.
However, prior to the framework being used extensively, it is recommended that the focus areas, scales and items identified in the four instruments are extensively reviewed by tutors, learners and researchers. Such reviews should ensure all salient aspects of quality teaching are covered. It is also recommended that further studies using the framework developed be undertaken in order to demonstrate the findings presented here can be replicated.
6. Conclusion
Quality teaching and educational delivery is a prominent theme in discussions on tertiary educational reform. The increasing demands of a globally networked economy means countries are reliant on Tertiary Vocational TVET institutions to provide graduates who have the relevant knowledge, skills and attitudes that will drive economic growth. It is argued that failure to produce these work-ready graduates undermines both the employability of individuals and the competitiveness of the nation. Work-readiness not only requires learners to have strong technical knowledge of the industry, they need additional attributes - such as communication, team work, problem solving – to successfully apply this knowledge in authentic situations. This study has demonstrated there is a high correlation between the quality of a teachers teaching practices and the level of work-readiness of learners.
teaching practices as learners are learning, immediately improving learner achievement. This is significantly different to outcomes-based evaluations that can only impact on future, rather than actual, quality teaching experiences of learners.
This paper has demonstrated that the evaluation framework created, and the associated research instruments developed, are robust and reliable and they can be used with confidence by TVET institutions who want to pro-actively improve the teaching quality experienced by their learners.
References
[1] Hu, S., & Mccormick, A. C. (2012). An engagement-based student typology and its relationship to college outcomes. Research in Higher Education, 53 (7), 738-754. doi:http://dx.doi.org/10.1007/s11162-012-9254-7
[2] Zhang, D., & Campbell, T. (2015). An examination of the impact of teacher quality and opportunity gap on student science achievement in China. International Journal of Science & Mathematics Education, 13 (3), 489-513.
[3] Kalin, J., Peklaj, C., Pecjak, S., Levpuscek, M., & Zulian, M. (2017). Elementary and Secondary School Students' Perceptions of Teachers' Classroom Management Competencies. CEPS Journal, 7 (4), 37-62.
[4] Nooruddin, S. s. (2017). Technical and Vocational Education and Training for Economic Growth in Pakistan. Journal Of Education & Educational Development, 4 (1), 130-141.
[5] Peklaj, C. (2015). Teacher Competencies through the Prism of Educational Research. CEPS Journal, 5 (3), 183-204.
[6] Wiseman, A. a., & Al-bakr, F. f. (2013). The elusiveness of teacher quality: A comparative analysis of teacher certification and student achievement in Gulf Cooperation Council (GCC) countries. Prospects (00331538), 43 (3), 289-309.
[7] Clayton, J (2009) Evaluating online learning environments: The development and validation of an online learning environment instrument. Köln, Germany: LAP Lambert Academic Publishing.
[8] Shidler, L. (2009). The Impact of Time Spent Coaching for Teacher Efficacy on Student Achievement. Early Childhood Education Journal, 36 (5), 453-460.
[9] Fraser, B. J. (1998). Classroom environment instruments: Development, validity and applications. Learning Environments Research: An International Journal, 1 (1), 68-93.
[10] Sink, C. A., & Spencer, L. R. (2005). My Class Inventory-Short Form as an accountability tool for elementary school counselors to measure classroom climate. Professional School Counseling, 9 (1),
[11] Kyungv Ryung K., & Eun H, (2018). The relationship between teacher efficacy and student academic achievement: a meta-analysis. Social Behaviour & Personality: An International Journal, 46 (4), 529-540.
[12] Hattie, J. (2015): The Applicability of Visible Learning to Higher Education. In: Scholarship of Teaching and Learning in Psychology, 1 (1), 79-91.
[13] Stuckey HL. Three types of interviews: Qualitative research methods in social health. J Soc Health Diabetes [serial online] 2013 [cited 2018 Jun 27]; 1:56-9. Available from: http://www.joshd.net/text.asp?2013/1/2/56/115294
[14] McLeod, S. A. (2014). The interview method. Retrieved from www.simplypsychology.org/interviews.html
[15] Kaufman, J. & Junker, B. (2011). What drives alignment between teachers’ survey self-reports and classroom observations of standards-based mathematics instruction? SREE Fall 2011 Conference